Gold [1-3 days view]Short Gold
Entry: 1291.50
SL: 1303.40
TP: 1247.75
Global markets are currently in a risk off environment given the recent trade-war escalation tweets by Trump. This also is in line with safe-haven currency such as JPY outperforming this week.
Technically, market reacted below long term descending trednline resistance.
Price is also currently testing what I would call the natural MA of the market.
MACD shows a bearish crossover, however, do note that it is still within bullish territory.
Update: Trade was triggered overnight, and market has moved quite a bit as expected. I've trailed my stop loss to protect the trade and some profits. This trade is now risk free.
Charting

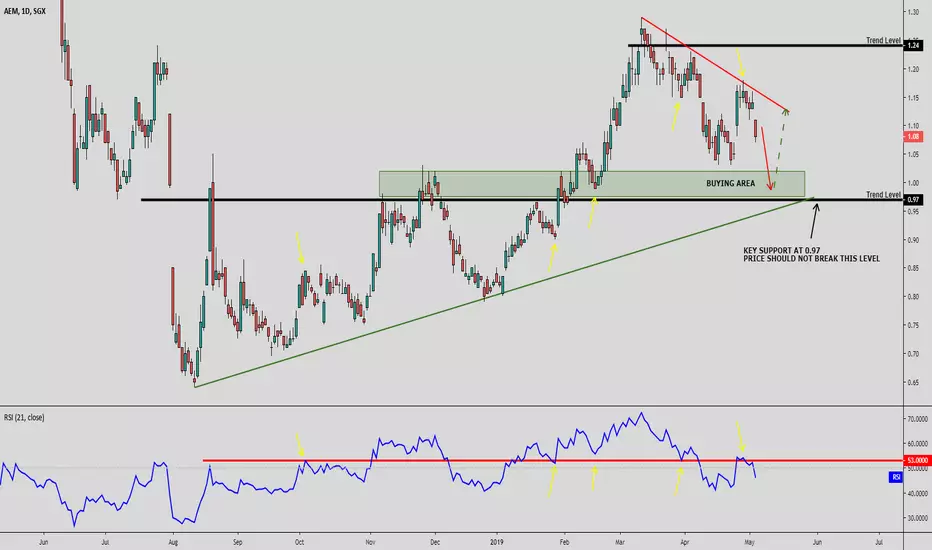
AEM Holdings (SGX)Market drop in progress towards Trend level at $1.00/$0.97 region. After which an intermediate bounce is expected.
Market reacted below desceding trendline resistance
RSI (21) reacted below 53% resistance level and has entered bearish territory below 50% level.
RSI (21) 53% resistance level is also where price has reacted many times in the past, as seen by the yellow arrows.
Buying area finds confluence with fibo retracement and strong supply and demand level.
Just an educational post to show how a confluence of technical elements can give a good trade with much higher probability. Also, because there is no good risk reward to this, I'm posting this as an educational material.
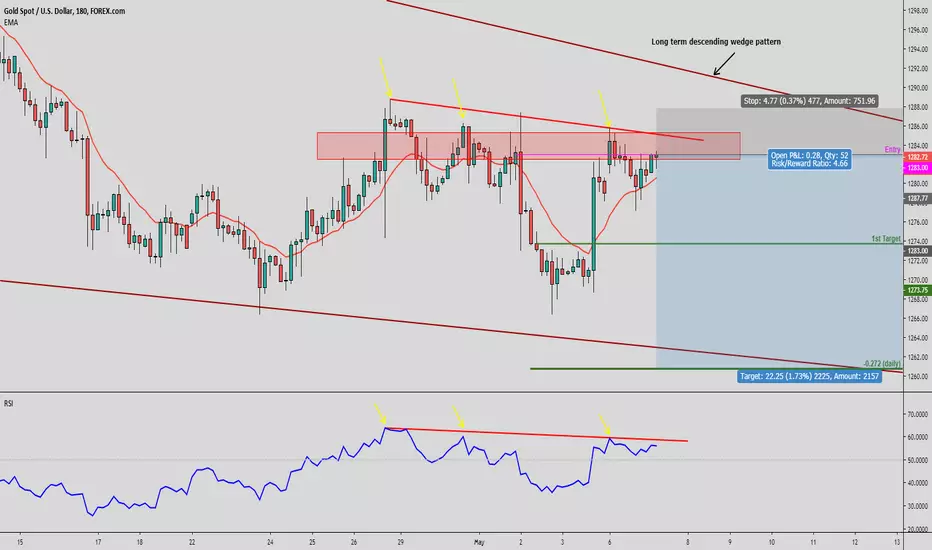
Gold [1-3 days view]Short Gold
Entry: 1283
SL: 1287.77
TP1: 1273.75
TP2: 1260.75
I expect a Gold to drop.
Market close to descending trendline resistance.
RSI also testing descending trendline resistance. Market has reacted below this resistance multiple times in the past (shown by yellow arrows).
Long term, market within a descending wedge pattern.
Market however is still holding above it's short term natural EMA. Once this EMA is broken, we should see a higher conviction of a deeper drop.
Gold [1-3 days view]SHORT Gold
Entry: 1278.75
SL: 1284
TP1: 1266.25
TP2: 1254.75
Market is within a long term descending wedge pattern.
Currently, price has tested and reacted below descending trendline resistance.
RSI also testing 55% resistance level where market has previously reacted before (as pointed out by the yellow arrows).
I am more confident that price will only pull back lower towards the 1st target.. 2nd target is quite a stretch.

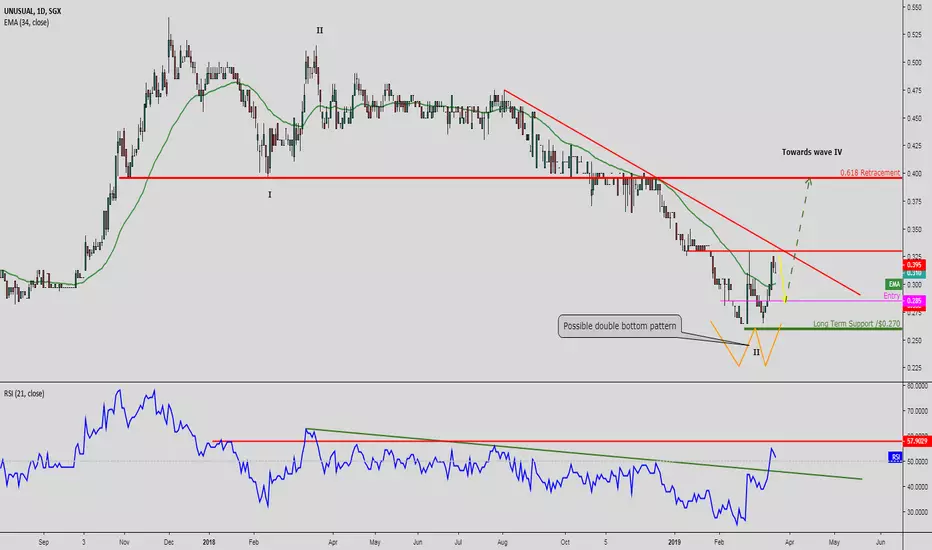
Unusual (1D1 - SGX) [1-3 weeks view]Long 1D1 with low conviction
Entry: $0.285
SL: $0.270
Market is forming a possible double bottom reversal pattern.
Only when price surpasses $0.330 will this reversal pattern be confirmed.
$0.330 is also a strong resistance level found twice via:
- Descending trendline resistance
- Double bottom neckline
Should market break above $0.330, we can expect to see price rise towards $0.395 which is both 0.618 retracement level and a probable wave 4 target.
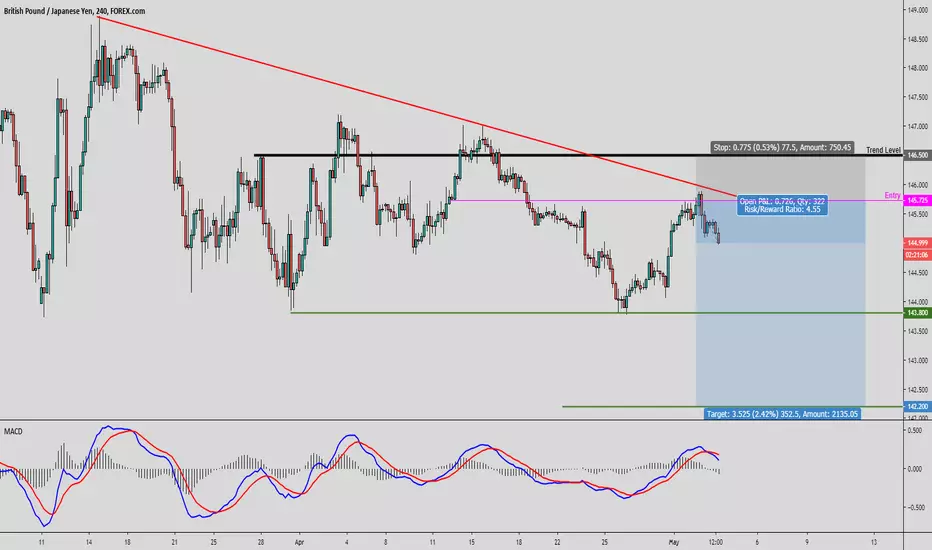
GBPJPY [1-3 days view]SHORT GBPJPY
Entry: 145.725
SL: 146.500
TP1: 143.800
TP2: 142.200
Market reacted below descending trendline resistance.
Similarly, MACD indicator showed a bearish cross signalling for market to go lower.
This trade was entered yesterday but I forgot to publish it. However, as expected, market has moved in my direction. I have also moved my trailing stop lower to protect this trade.
Trade is now risk free.
AUDJPY [ 1-3 days view]SHORT AUDJPY
ENTRY: 78.695
SL: 79.045
TP: 77.500
Market reacting below descending trendline resistance.
Market also holding below it's natural MA (34). We see that price respected MA (34) quite often in the past.
Stochastics also shows a reversal with room for further downside potential.

Gold [1-3 days view]Short Gold
Entry: 1299.05
SL: 1313.15
TP1: 1266.25
TP2: 1254.75
Market reacted above descending wage support with price closing above EMA (21).
MACD still in bearish territory however, showing a golden cross signalling a possible reversal.
Wait for a pullback to short below 1299.05 where also happens to be descending range resistance.

Forget Bitcoin and watch this textbook TA!Away from the action on BTC and the S&P500, I'm making big profits on hidden gems, like this UK stock. A classic TA inverse head and shoulders setup! Straight out of the dusty textbooks. Strong volume on the left shoulder and weak volume on the right shoulder, just as it should be. I bought just above the breakout line. The breakout is clean, retests to a perfect level and then takes off like a rocket! Beautiful. (and highly profitable).

TELL Possible Head and Shoulder Continuation PatternWatching the $9.31 area for a bounce at or before to help validate a H&S continuation pattern. Could still hit $8.92 on the downswing, this would also keep our H&S pattern alive, anything below will invalidate. If we break that and go lower I am bearish. RSI approaching oversold conditions, as well. This tells me we have a good possibility to bounce at the neckline.

Quarkchain Overnight (8-10 hour buy)Closing triangle pattern could indicate a breakout shortly. Currently the ROC & MACD Oscillators are indicating the same pattern as the price trend (upwards), therefore convergence...a buy signal. MACD line cross above the Signal line as well as the ROC point upward are both buy signals. Let's see how this over night trade would play out. This is just charting practice for me. I'm not in this trade nor do I recommend it. Just want to see how it plays out.

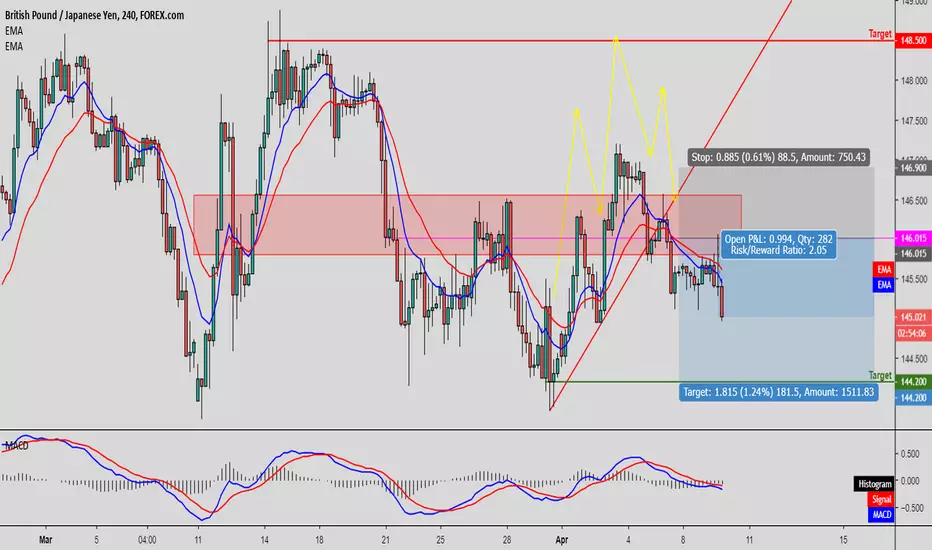
GBPJPY [1-3 days view]Short GBPJPY
Entry: 146.015
SL: 146.900
TP: 144.200
Market broke below ascending trendline support (now resistance)
H&S pattern seen forming
Market holding below EMA and MACD now in bearish environment
$SPY - Daily Chart Extreme Overbought & Parabolic Snapback Setup$SPY - our $283 level of resistance finally broke over with the market busting over and gapping up this week. Spy currently sitting at $288.26 at time of post. Highs of market are at $293.85. 7th green day in a row, constant gap ups making it hard to get day trades with market breadth sucked out before market opens. In individual names, I have been take about 30% less trades than normal. Longs my hold time is about 1/2 of what it was a few months ago. Always have to adapt and find the trend with market conditions.
$SPY - expecting a pullback sooner than later with stochastics now at 90.17. Market is due for a breather and pullback to at least 9ema, otherwise other notable level is $283 area again (for tap off support).
Have a great weekend coming up!

USDCAD SHORTUSDCAD Is Struggling to break the 1.3450 Zone
Looking for bearish price action below the blue line to send us short
With a strong push it should break the daily channel to the downside come up for a re-test and continue downward
RED:SL
BLUE: ENTRY
GREEN:TP
NO PRICE ACTION NO TRADE!
GBP/CAD - ShortI am new to trading and recently started to publish my analysis. Any advice or feedback is welcome via comments or in the chat. Looking for opportunities to learn new information & techniques.
I have done some analysis on the GBP/CAD . The analysis has been done on the 1 hour candlestick chart with the trendline being drawn on the 4hr and I will be keeping an eye on this pair.
There is a strong resistance line 1.777 which has been tested around 5/6 times. This is where you can also see a triple top forming. Which is a signal for the price to start to go down.
It has touched the trendline three times over the past week and also the resistance line.
I would place my:
SL @ 1.782
TP @ 1.760
lets see how this plays out

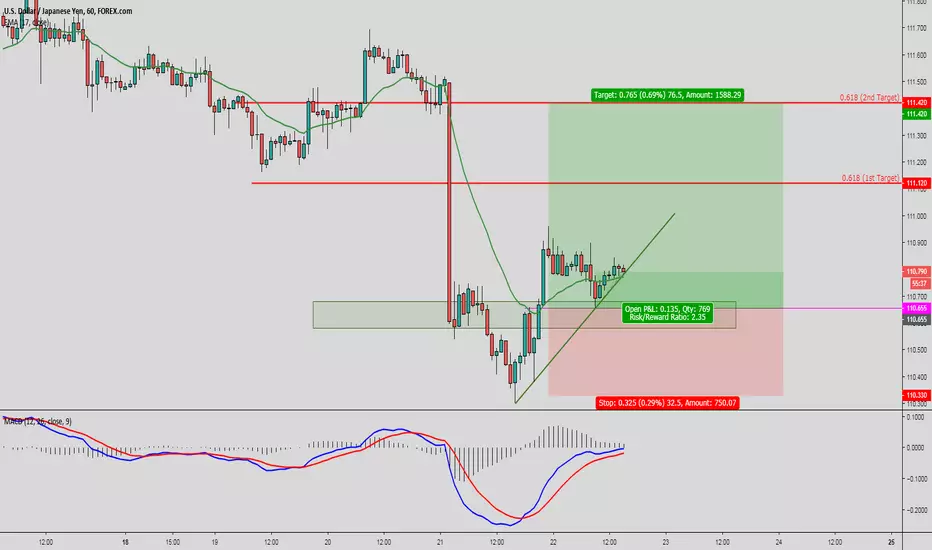
USDJPY [1-3 days view]Long USDJPY
Entry: 110.655
SL: 110.33
TP: 111.42
After the crazy impulsive move down, market actually rebounded. Price is now testing ascending trendline support.
Market is also holding above EMA (17). MACD is now testing 0% level and has moved up into bullish territory.
This is a short term play with a simple risk reward of 1:2
Market pulled back and triggered my buy order.
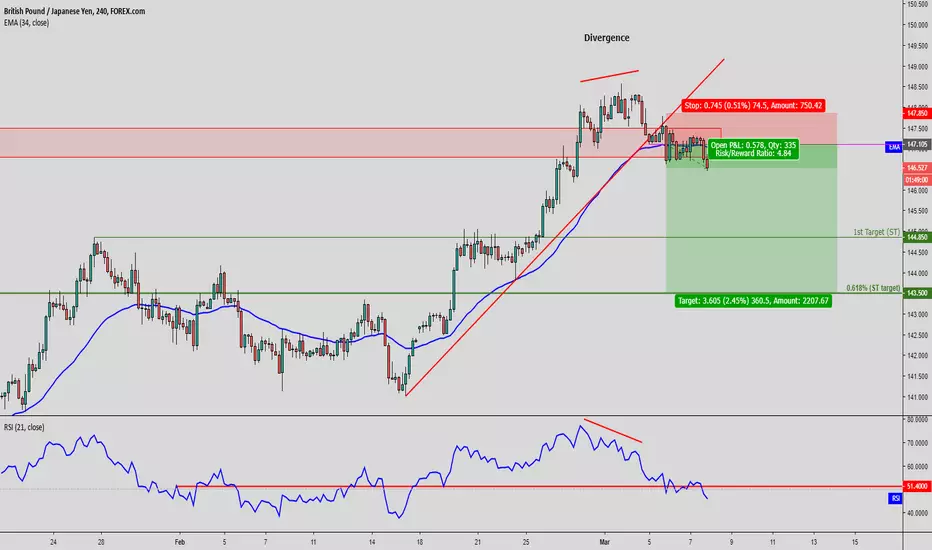
GBPJPY [1-3 days view]Short GBPJPY:
ntry: 147.105
SL: 147.85
TP1: 144.850
TP2: 143.5
After a strong rally upwards, we see a divergence between momentum and price. RSI (21) has also crossed into the bearish territory below the 50% level.
Shortly after which, market broke below the ascending trendline support (now resistance).
Price has also closed below EMA (34) which has acted as a pretty solid support/resistance for GBPJPY
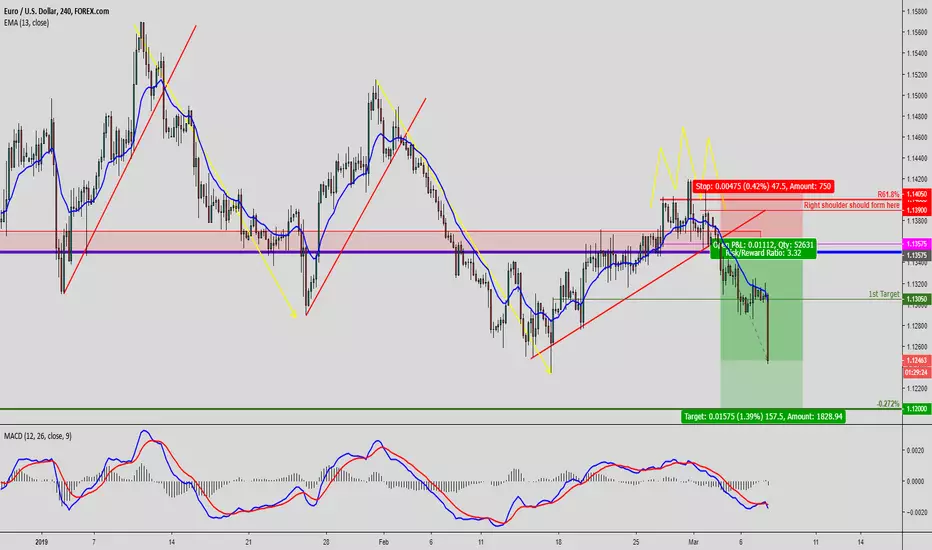
EURUSD [1-3 days view]This trade was triggered earlier this week. However, I chose not to publish it as it was a low probability trade for me at that time for the following reasons:
Market was only testing the ascending trendline support (now resistance)
Normally I would wait for a pullback to retest the trendline before entering to short
Market was also forming a Head & Shoulders reversal pattern however at trade time, it was still not confirmed.
I choose to publish this trade now because I believe it presents a very strong case of how a trade can really move in your direction when multiple technical elements show confluence to provide that confirmation despite the low conviction I had.
1. Market was forming a Head & Shoulders reversal pattern
2. Market broke below the ascending trendline support (now resistance).
3. At the same time, market also had one candle close just below the EMA (13). This EMA as noted in the past provided quite a good support/resistance where price reacted above and below it.
4. MACD momentum indicator at trade execution crossed below 0% and entered bearish territory. The MACD and signal line also showed strong downwards momentum.
5. Everytime price broke below an ascending trendline support (turned resistance), market will make a strong and sustained downwards push. This happened at the 2nd week of Jan 2019 and once more at the start of Feb 2019. Now at the start of March 2019, we see this pattern repeated again.
This is a quite a beautiful example of how technical analysis can be a very powerful skill to have for any market participant. Reach out to me to find out more!
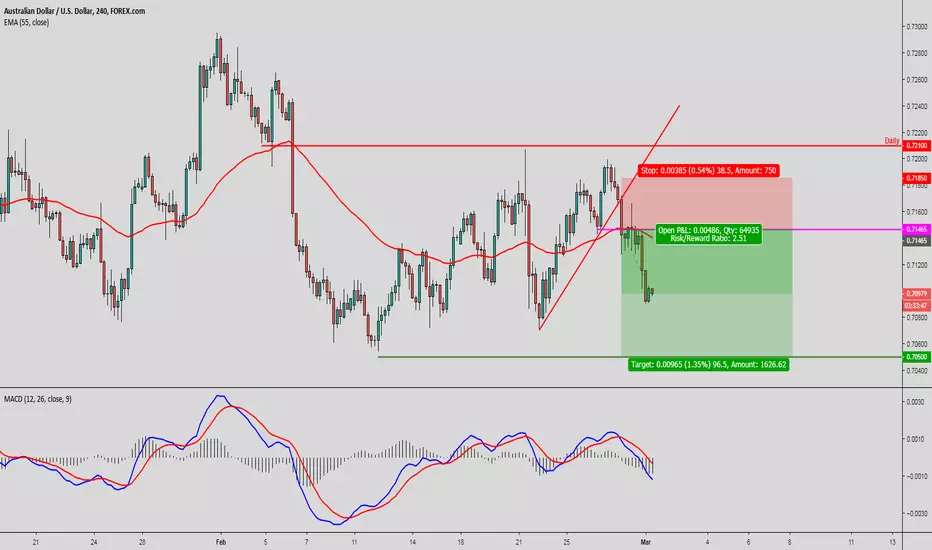
AUDUSD [1-3 days view]Entry: 0.71465
SL: 0.7185
TP: 0.705
This trade was knocked in this wed (27th Feb 2019). The reasons why I went short is listed below:
Whilst market reacted above the ascending trendine support (in red), it failed to surpass resistance at 0.72100
Market then broke below ascending trendline support and also spiked below 55 period EMA
At the same time, MACD showed a 'death cross' and also broke below '0' meaning it has entered bearish territory.
This week has not been an easy week! But still keeping my eyes peeled open for more opportunities!
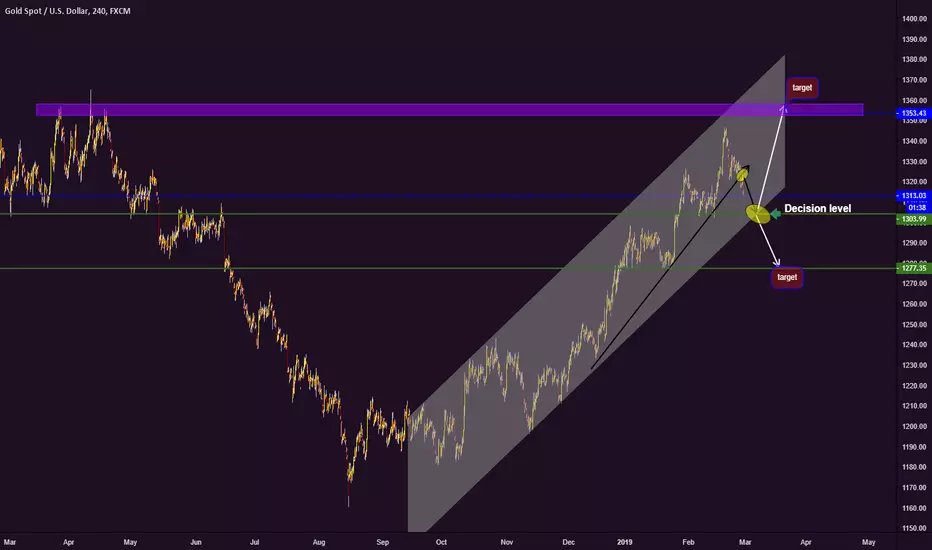
GOLD UNBIASED LONG TERM PROJECTIONTwo scenarios, two ideas, at this point I am leaving it up to the market

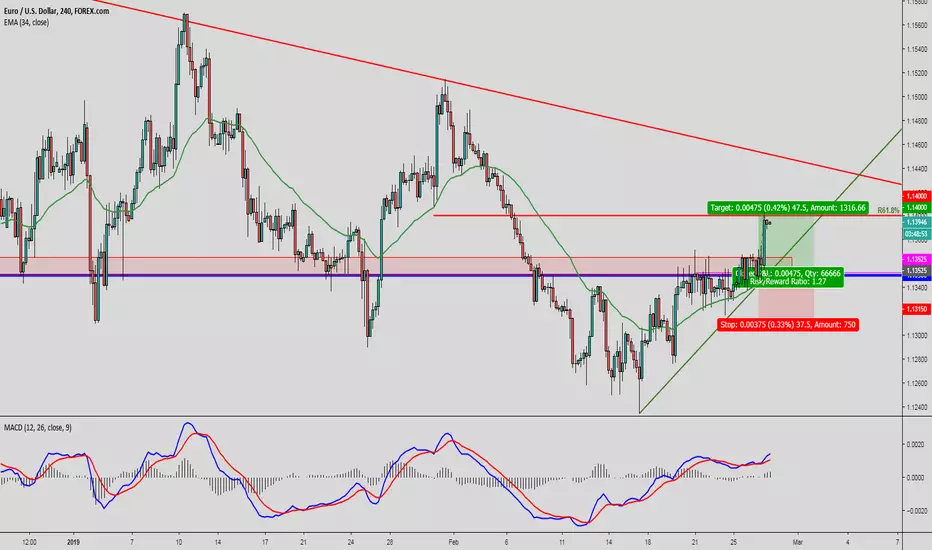
EURUSD [1-3 days view]This was quite a simple set up though admittedly, the risk reward wasn't great. However, when presented with an opportunity, I will grab it.
Here i saw market reacting above ascending trendline and also holding above EMA34. MACD was also in a bullish environment. Market was also testing a very key long term trend level at 1.135.
I set my entry at 1.13525 and waited for the 2nd pullback and retest of the trendline. Pullback happened exactly as expected and knocked my position in.
1.14 price target is actually based on fibo retracement at the 61.8% of the previous downswing.
Market hit target exactly and closed this position with a profit of 47 pips. With this much confluences, wouldn't you take the trade too?
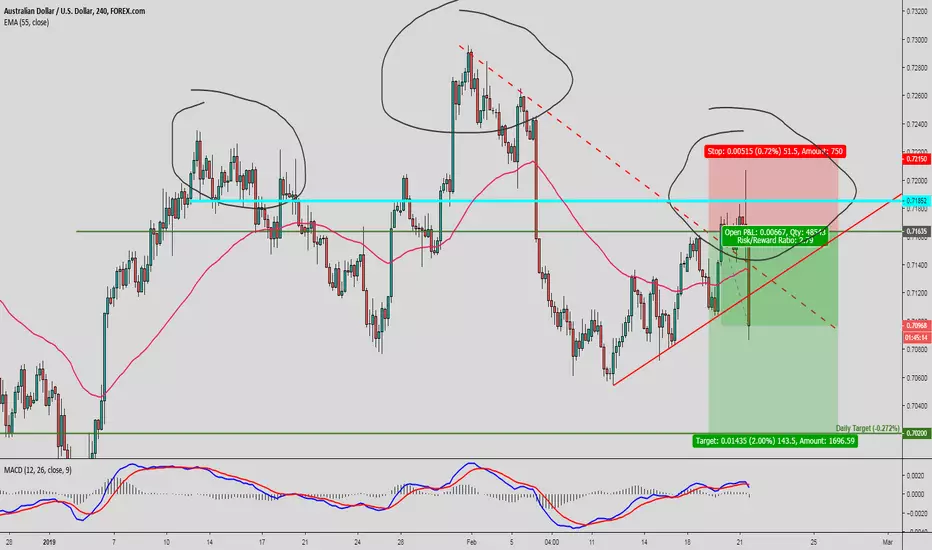
AUDUSD [1-3days view]1st Short AUDUSD
Entry: 0.71635
SL: 0.7215
TP: 0.7020
Short order was triggered yesterday after market pulled back to the descending trendline resistance (dotted line).
Market however surpassed this line and seemed to be heading for a bullish breakout... However, it reacted just nicely below the resistance at 0.71852 (thick neon blue line) to form the right shoulder... despite the spike, my position was not taken out and I held onto it.
Here we see that a head and shoulders patterned has formed. The right shoulder being classically lower than the left shoulder.
Market is also now below 55 period EMA.
Market then puked further making my position extremely profitable after one whole day of waiting. I moved my trailing stop lower to protect profits. My trade is now risk free and profitable. Will look to scale in to this trade when possible.