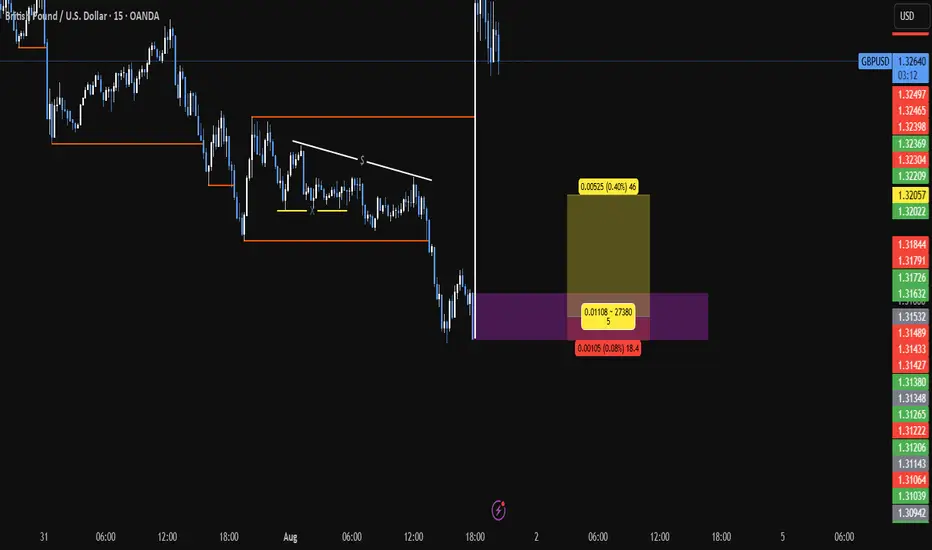
GBPUSD BUYBUY @1.31532
SL @1.31427
TP @1.32057
If SL hits by a candle sweep and closed above the entry level again buy....
And always risk 1%
Chart Patterns
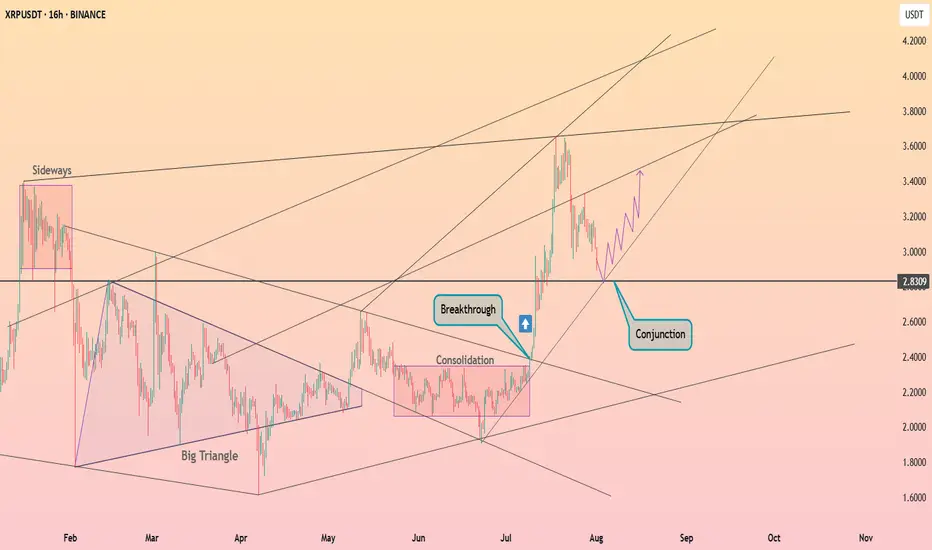
XRP continues to pullback ┆ HolderStatBINANCE:XRPUSDT surged above $2.83 after consolidating in a tight range. Price is now retesting the breakout zone at a key structural conjunction. If the level holds, a renewed move toward $3.40 may follow as bulls reclaim control.
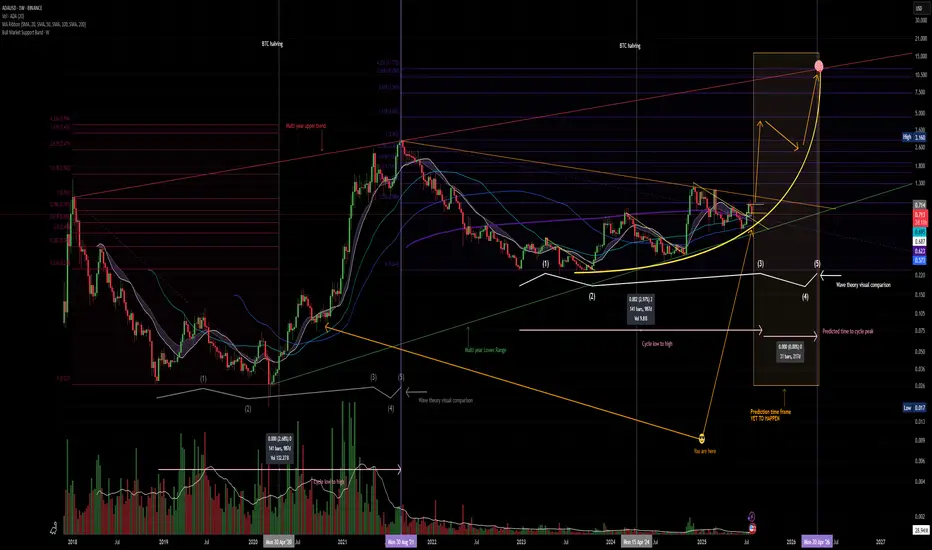
Panic sets in. but its all goodThe crypto market has experienced a strong panic driven correction as the FED refuses to cut rates and inflation is on the rise while wages are slowly in decline.
CRYPTOCAP:ADA continues to provide thrills and chills
Is it time to dump? and cry into your empty wallet?
IMO NO, CRYPTOCAP:BTC has recently taken out liquidity below the $117,000.00 price point which is a normal move, if you are over leveraged it can feel horrible but I assess as a normal correction.
CRYPTOCAP:ADA price remains in the range in which it has formed .93 - .71 the possibility that CRYPTOCAP:ADA can dip deeper to .65 is possible but unlikely. This correction provides a cooling off of MACD and RSI on higher timeframes and the chart still remains BULLISH.
Remember be greedy when others are fearful.
A man who says he never had a chance never took a chance!
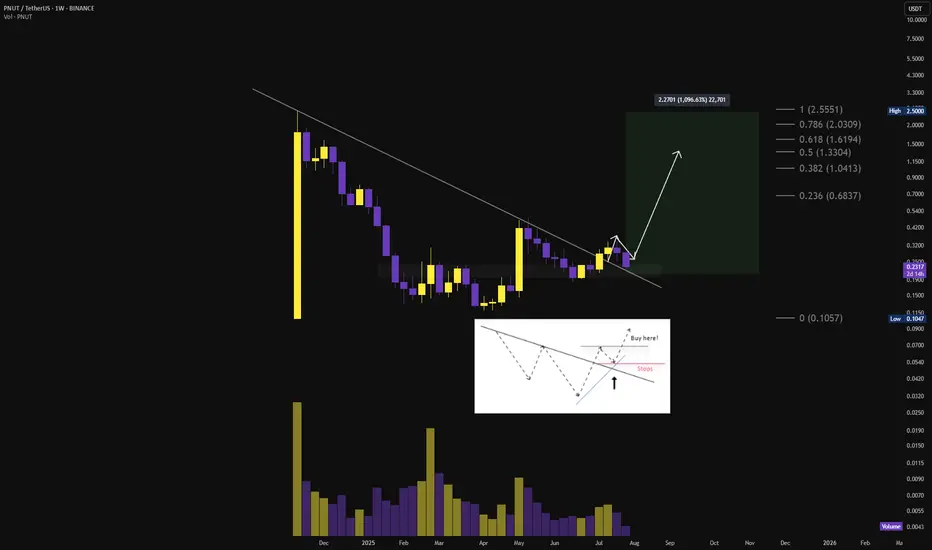
$PNUT TO 2.5$ THIS RALLY?🚨 $PNUT breakout from falling wedge confirmed ❗
Target at $0.34 is done for a 70% move off the breakout✅
Now retesting the breakout zone: $0.21–$0.23
Breakout remains intact. Consolidation expected before the next explosive leg. 📈
Local breakout above $0.33 → reopens pathway to:
→ $0.50 → $0.68 → $1.00 → $1.33 → $2.00 → $2.50
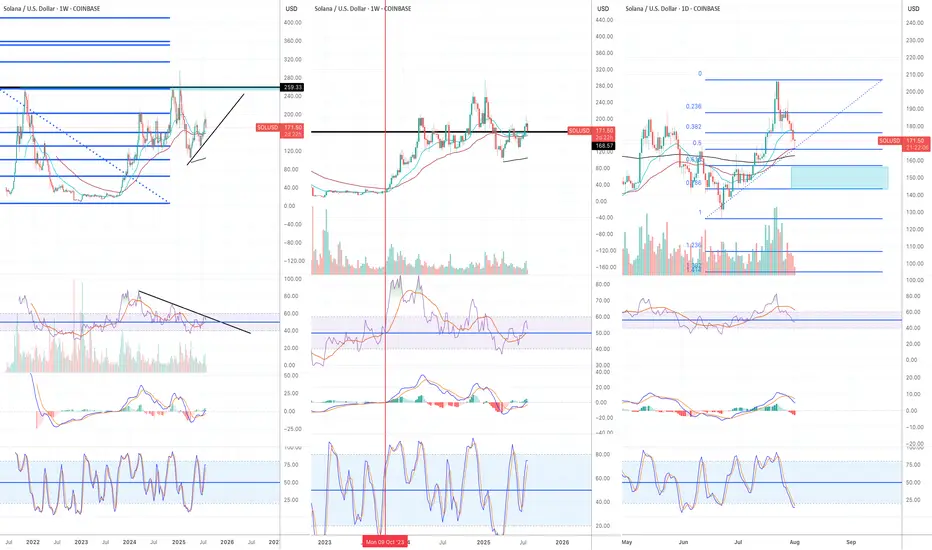
Still bullish in the higher time frames Solana has been struggling to break and stay above $170-200 zone this cycle.
It has been a very difficult asset to trade, however, I can see more bullish setups than bearish setups in higher timeframe charts.
Monthly:
1) July monthly candle closed above Fib 0.618 and formed higher high higher low.
2) RSI and MACD are still in the bull zone.
3) Stochastic are in the bear zone, but they are pointing to the upside.
Weekly:
1) EMA21 is still above EMA55.
2) The current weekly candle is forming bearing engulfing candle, however, there are two more days before it closes. It is still above EMA 21.
3) RSI orange line (RSI based moving average) is moving upwards and entering the bull zone.
4) MACD is about to enter the bull zone.
5) Stochastic hasn't reached overbought territory yet.
6) The set up of these three momentum indicators is very similar to the set up in Oct 23 before Solana started a massive bull trend. (see red vertical line)
Daily:
1) EMA21>EMA55>EMA200
2) As I said in the previous articles, EMA 55 and 200 don't cross easily. But when they do, the price often pulls back significantly before it starts to move in the direction of the trend.
3) Daily candle broke below EMA21, however, the price is reacting strongly to EMA55.
4) The price is still higher high higher low.
I will wait and see if the price is going to bounce off from $143 -157 region. (see blue rectangular block).
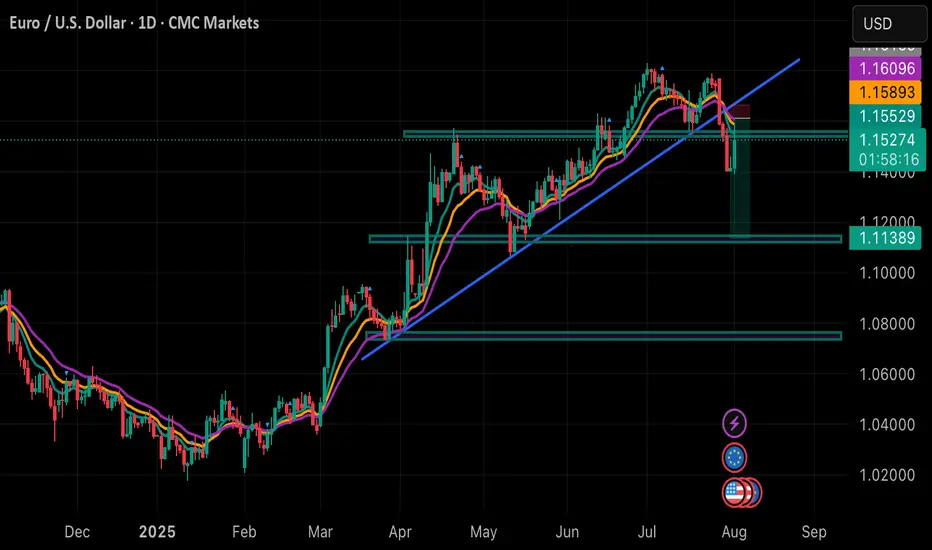
Eurusd sell pending order set already. Hopefully on mondayBased on my technical analysis, I strongly speculate EURUSD fall on Monday.
XAUUSD ANNASIS OUTLOOK BULLISH 1/8/2025 XAUUSD – Trade in Progress
Long from $3,295 – targetting $3,355 / $3,365
+600+ pips potential on extended breakout
Bulls gaining strength above $3,300
Holding with confidence – structure supports it
#XAUUSD #GoldTrade #LiveSetup #TargetPending

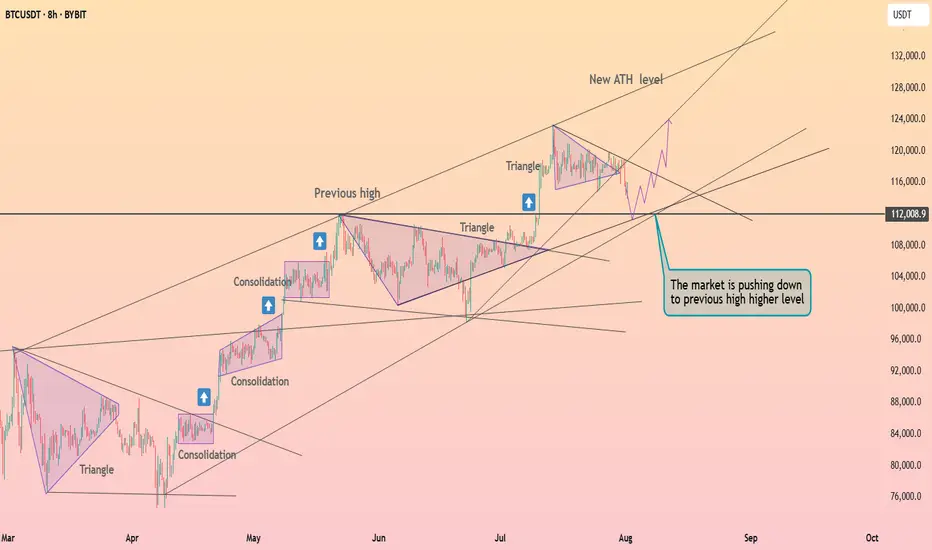
Bitcoin exited from the triangle ┆ HolderStatBINANCE:BTCUSDT is dipping to retest $112,000, the last breakout level. The price remains inside a large ascending triangle and may soon resume its uptrend. If this support holds, targets above $125,000 come back into play.
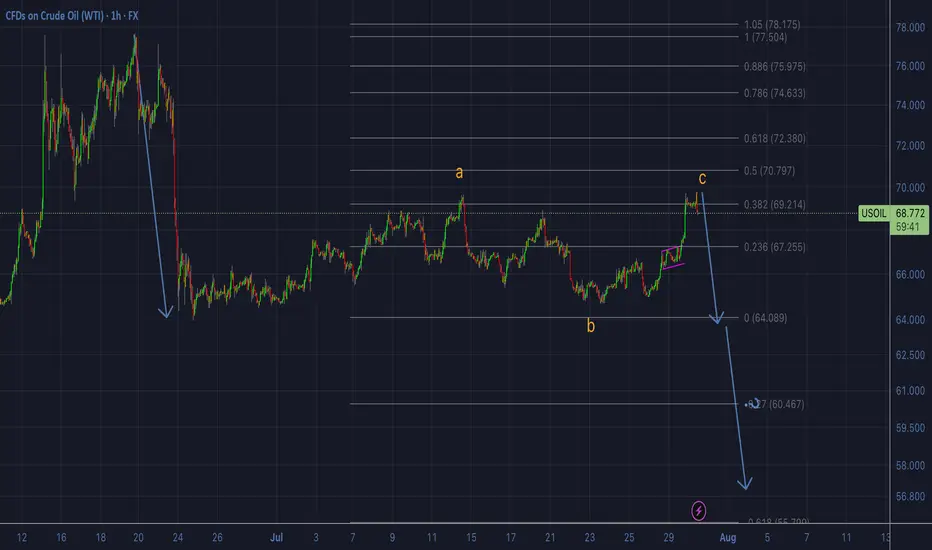
OIL - shortFollowing our previous forecasted up-move, from now on we will switch to looking for sell setups only. We would normally expect the C wave of the corrective pattern retrace all the way to the 0.618 fib of the downward impulse, as the A wave had already retraced to the 0.382. But that isn't necessarily always the case. As long as the C retracement has broken the top of the A retracement, the pattern formally speaking can be complete. We will not be looking for further buys, therefore, from now on. Even if it does continue to the 0.618, we will skip the eventual buy and focus on the sells. At the same time, because the eventuality of more up exists, we will wait for a proper sell setup before we enter any short position. Updates will follow.
BLACKBERRY BBBREAKOUT OF DESCENDING TRENDLINE COULD SEE 22$-24$
BlackBerry today is a Canadian technology company specializing in cybersecurity software and Internet of Things (IoT) services for enterprises and governments worldwide. Formerly renowned as a mobile device manufacturer, BlackBerry Limited (formerly Research In Motion, RIM) exited the smartphone business in 2016 and now focuses on secure communications, endpoint management, and embedded systems, especially for industries like automotive, healthcare, and government.
Company Profile & Business
Headquarters: Waterloo, Ontario, Canada
Core products: Cybersecurity solutions, BlackBerry Unified Endpoint Management (UEM), QNX operating systems, secure messaging (BlackBerry Messenger Enterprise, BBMe), and automotive software platforms.
Global presence: Products and services are sold worldwide across the Americas, Europe, Middle East, Africa, and Asia-Pacific.
Recent Financials & Stock
Stock ticker: NYSE/TSX: BB
Recent price: As of July 30, 2025, BlackBerry closed at $3.74 per share, reflecting a decline from earlier in the month. Price targets for the company now range from $2.71 to $4.75, with analysts citing positive revenue growth and the company's first positive cash flow in three years after its recent quarterly results.
Business momentum: The company recently posted about 10% higher revenue compared to forecasts for the third quarter fiscal year 2025, with a shift to positive earnings and cash flow—highlighting improvements in its cybersecurity and IoT software businesses.
Notable News & Developments
End of smartphones: BlackBerry-branded mobile devices are officially discontinued. The company fully exited the hardware business by 2018 and stopped supporting BlackBerry 10 in 2022.
Nostalgia revival: In 2025, a separate company (Zinwa Technologies) is reviving classic BlackBerry devices (like the BlackBerry Classic and Passport) by retrofitting them with modern Android internals. These are not officially affiliated with BlackBerry Limited, but appeal to enthusiasts for the classic design and QWERTY keyboard, albeit with privacy caveats due to non-BlackBerry software.
Enterprise focus: BlackBerry remains a leader in secure software for businesses, including automotive OS (QNX), endpoint security, and secure messaging. Major clients include automotive OEMs, financial corporations, and government agencies.
Quick Facts Table
Aspect Details
Industry Cybersecurity, IoT software, enterprise services
Founded 1984 (as Research In Motion, Canada)
Consumer Phones Discontinued; brand revived unofficially by others
Current Stock Price $3.74 (July 30, 2025)
Latest Product Focus Automotive software, secure endpoint management
BlackBerry is no longer a phone maker, but remains a significant player in secure enterprise and automotive software, with stock prices and business outlook reflecting its transition into these fields.
Zinwa Technologies is a Chinese technology company that has gained attention in 2025 for its project to revive classic BlackBerry smartphones, specifically the BlackBerry Classic (also known as the Q20), under its own branding. Unlike BlackBerry Limited (which no longer makes hardware), Zinwa has purchased batches of old BlackBerry Q20 devices—both new-old-stock and used units from supply chains in Hong Kong—and is refurbishing them with entirely new internal components while retaining the iconic design features such as the physical QWERTY keyboard and 720x720 touchscreen.
Key Details on Zinwa Technologies’ BlackBerry Revival:
Project Name/Models: The updated phone is called the Zinwa Q25 (2025 is referenced in the model name). Zinwa is also planning to modernize other BlackBerry devices, including the KEYone (“K25”) and the Passport (“P25” or “P26”).
What’s Modernized?: The original shell, keyboard, notification LED, and display remain, but Zinwa installs a new motherboard with a MediaTek Helio G99 processor, 12GB RAM, 256GB storage (expandable), a 50MP rear camera, 8MP front camera, a new 3,000mAh battery, and global 4G LTE support. There is a USB-C port, headphone jack, microSD support, and the phone runs Android 13 (with no confirmed plans for updates to later Android versions).
How It’s Sold: Two options are offered—a fully assembled Zinwa Q25 smartphone for $400, or a $300 conversion kit for those who already own a BlackBerry Classic and want to upgrade themselves. Both are expected to ship in August 2025.
Nostalgia Meets Modern Tech: The initiative targets fans of physical keyboards and retro gadgets as well as a new wave of Gen Z users seeking “digital detox” devices. The device is positioned as a niche product for enthusiasts rather than a mass-market flagship.
No Connection to BlackBerry Limited: Zinwa Technologies has not acquired the BlackBerry brand or company; its project is independent and relies on recycling and upgrading old BlackBerry hardware.
Future Plans: Zinwa has stated it may refresh additional BlackBerry models based on demand and feedback, following the Q25 release.
In sum, Zinwa Technologies is bringing back the BlackBerry Classic as a refreshed, Android-powered device for technology enthusiasts and nostalgia seekers, reflecting a trendy intersection of retro design and modern smartphone capabilities in 2025.
#BB

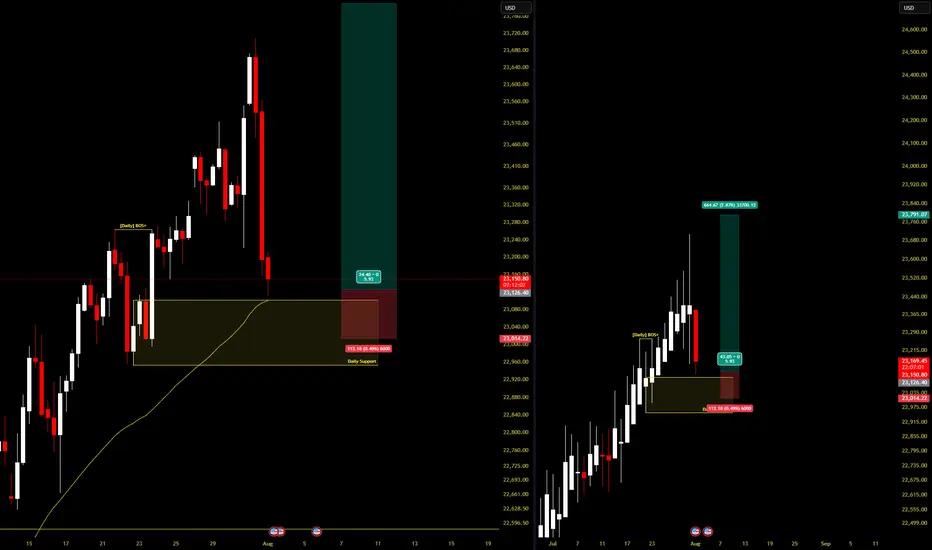
NASDAQ LONG NOWDaily break of structure provided me a view of the daily support at 22,960.
My entry is also supported by the 50-MA at the left chart. Im targeting 23,800 with 1:6 risk reward.
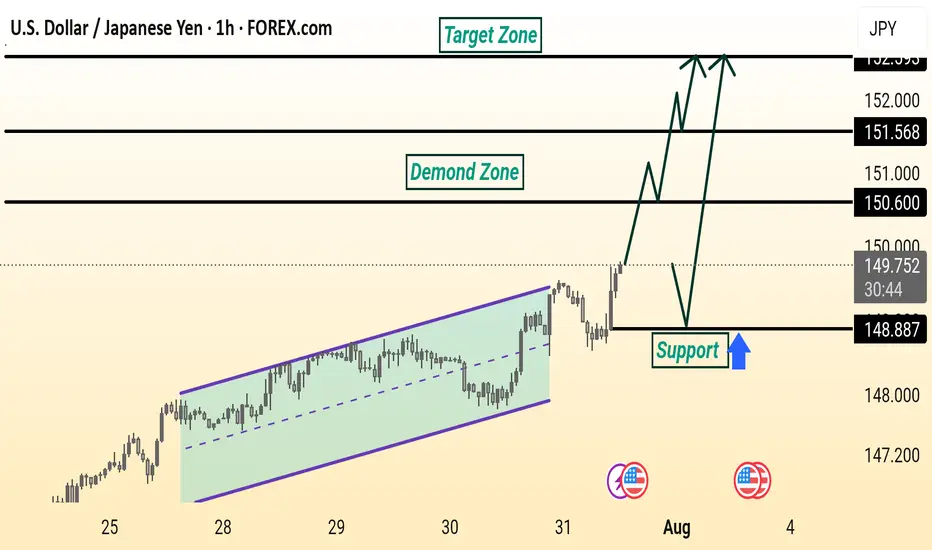
USD/JPY Analysis is Ready USD/JPY is showing a bullish setup. Price broke out of a rising channel and is expected to retest the 148.887 support level before moving higher toward the 150.600 and 151.568 resistance zones, targeting the 152.000 area. The demand zone adds strength to the potential upside.
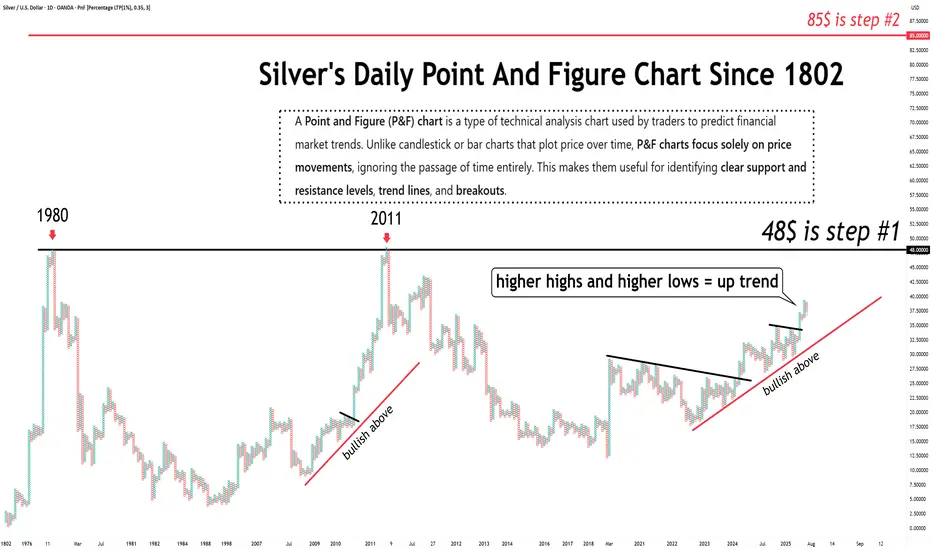
The long term prospects for silver are STILL bullish.Just so we are clear...
The long term prospects for silver are STILL bullish.
Once $48 is cleared, $85 becomes the next target.
Close out the Week STRONGLooks like price has found its bottom and is ready to push from here. We are looking for a strong forceful break out from this zone so we can go for the higher levels. Everything looks right from here and value keeps shifting up. I know we should get a solid entry but waiting for it to line up with time.

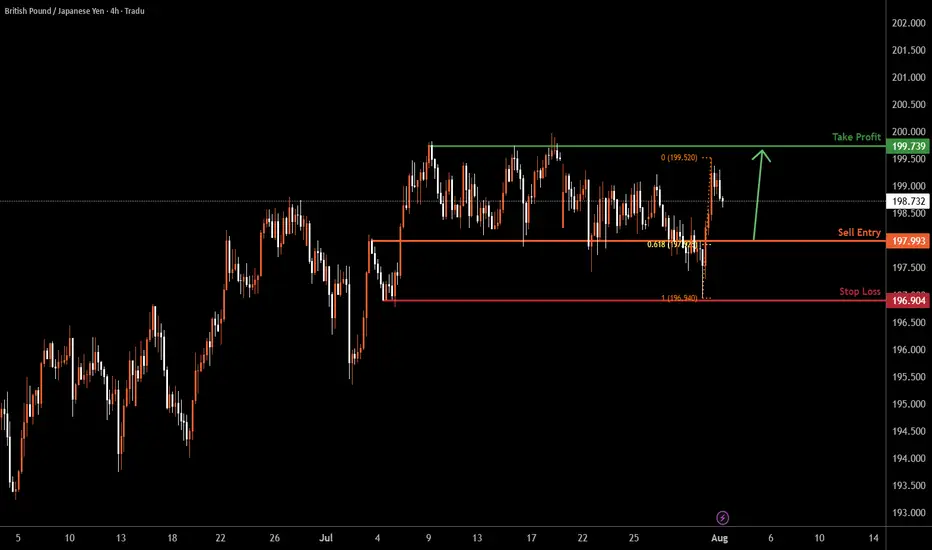
GBP/JPY H4 | Bullish bounce offGBP/JPY is falling towards the buy entry, which is an overlap support that lines up with the 61.8% Fibonacci retracement and could bounce to the take profit.
Buy entry is at 197.99, which is an overlap support that aligns with the 61.8% Fibonacci retracement.
Stop loss is at 196.90, which is a swing low support.
Take profit is at 199.73, which is a multi-swing high resistance.
High Risk Investment Warning
Trading Forex/CFDs on margin carries a high level of risk and may not be suitable for all investors. Leverage can work against you.
Stratos Markets Limited (tradu.com ):
CFDs are complex instruments and come with a high risk of losing money rapidly due to leverage. 65% of retail investor accounts lose money when trading CFDs with this provider. You should consider whether you understand how CFDs work and whether you can afford to take the high risk of losing your money.
Stratos Europe Ltd (tradu.com ):
CFDs are complex instruments and come with a high risk of losing money rapidly due to leverage. 66% of retail investor accounts lose money when trading CFDs with this provider. You should consider whether you understand how CFDs work and whether you can afford to take the high risk of losing your money.
Stratos Global LLC (tradu.com ):
Losses can exceed deposits.
Please be advised that the information presented on TradingView is provided to Tradu (‘Company’, ‘we’) by a third-party provider (‘TFA Global Pte Ltd’). Please be reminded that you are solely responsible for the trading decisions on your account. There is a very high degree of risk involved in trading. Any information and/or content is intended entirely for research, educational and informational purposes only and does not constitute investment or consultation advice or investment strategy. The information is not tailored to the investment needs of any specific person and therefore does not involve a consideration of any of the investment objectives, financial situation or needs of any viewer that may receive it. Kindly also note that past performance is not a reliable indicator of future results. Actual results may differ materially from those anticipated in forward-looking or past performance statements. We assume no liability as to the accuracy or completeness of any of the information and/or content provided herein and the Company cannot be held responsible for any omission, mistake nor for any loss or damage including without limitation to any loss of profit which may arise from reliance on any information supplied by TFA Global Pte Ltd.
The speaker(s) is neither an employee, agent nor representative of Tradu and is therefore acting independently. The opinions given are their own, constitute general market commentary, and do not constitute the opinion or advice of Tradu or any form of personal or investment advice. Tradu neither endorses nor guarantees offerings of third-party speakers, nor is Tradu responsible for the content, veracity or opinions of third-party speakers, presenters or participants.
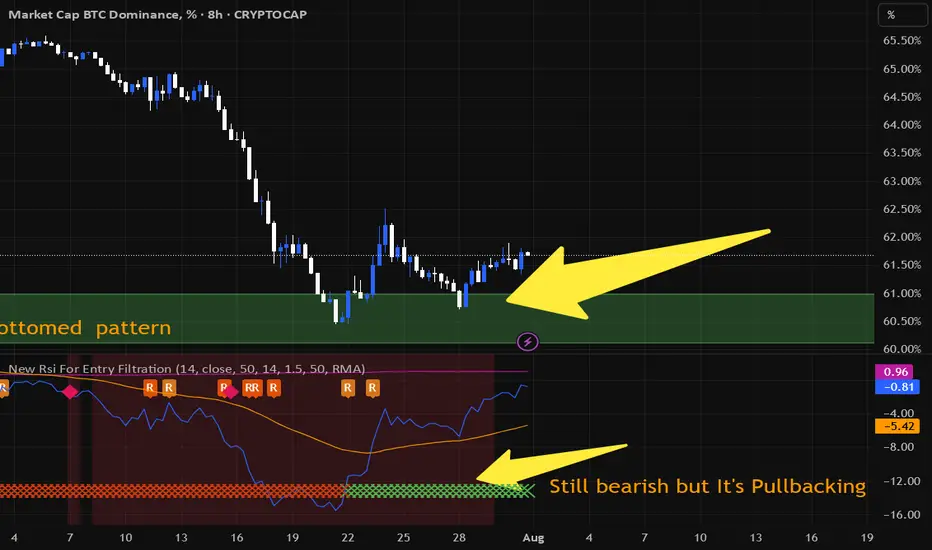
BTC Dominance and Altcoins SituationBitcoin dominance has reached a key support on the daily time frame. The NEW RSI indicator still sees the market as bearish but is pulling back. We will probably not see the growth of major altcoins like Ethereum for a few days. This analysis is not a financial recommendation in any way.
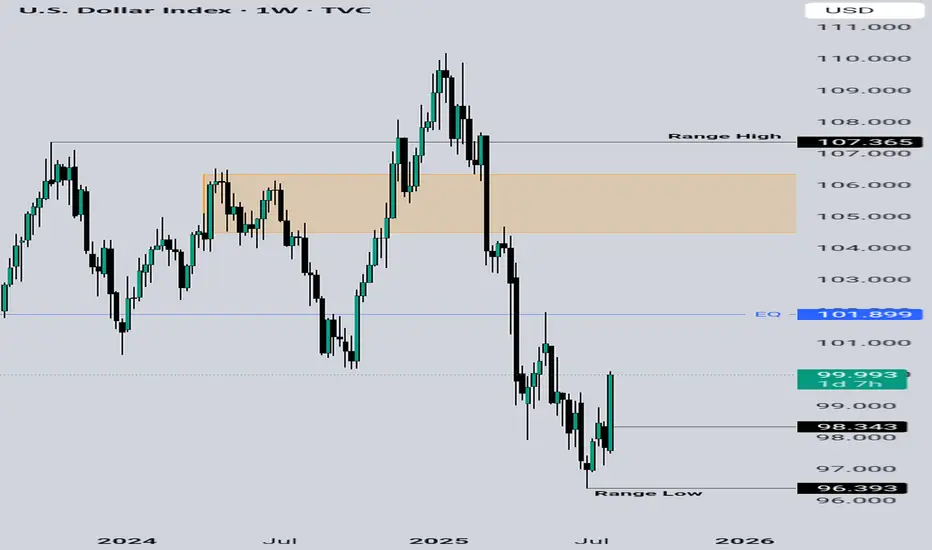
Bullish on The US Dollar Currently short term bullish on the dollar until it gets to the orange box. A retracement lower to accelerate the move higher is permitted. Let's see how this unfolds in the coming weeks
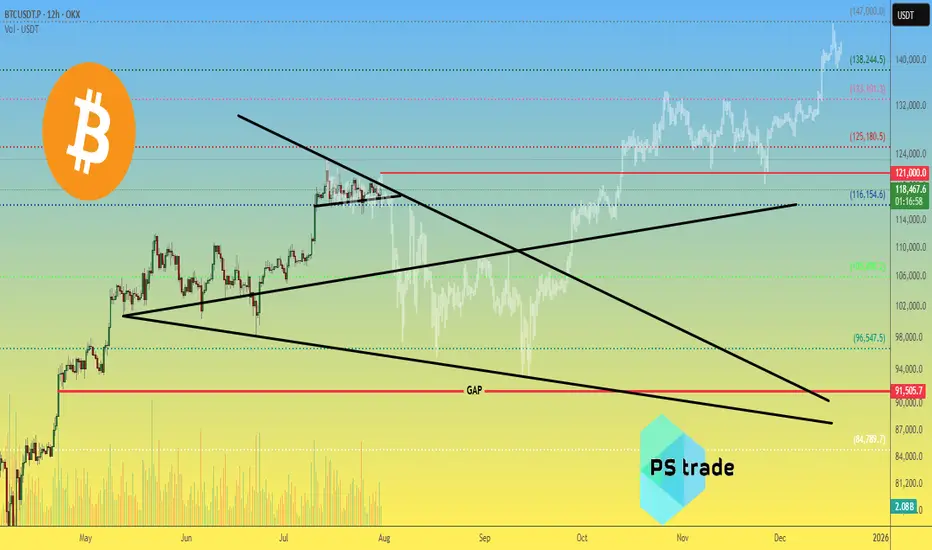
Bitcoin BTC price analysis by the end of 2025🕯 July is coming to an end, with 3 weeks of OKX:BTCUSDT consolidation between $117k–121k.
Tomorrow begins the last month of summer — and it promises to be "hot" as, according to our earlier published calendar Trump's administration plans to send letters with new, increased tariffs to "all countries" on 01.08.
💰 Also, take a look at Bitcoin Monthly Returns. In our view, 2025 resembles 2020 the most.
What do you think?
👉 According to this dynamic, the real "hot" may come not in summer, but late autumn.
💰 We've also tried to find a price fractal for #BTCUSD that fits the current structure — and for now, it looks plausible:
◆ In the coming days, CRYPTOCAP:BTC should not rise above $121k.
◆ A low of correction might hit mid-September around $93k.
◆ A cycle top for #BTC could arrive to the end of 2025, near $147k.
📄 Now that you've seen our version — share your forecasts on future #BTCUSDC price action in the comments 👇
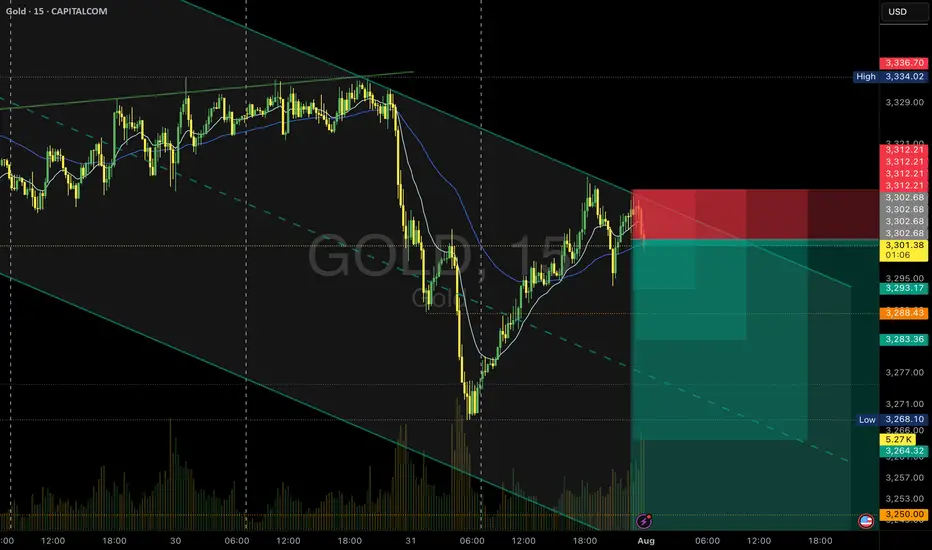
Gold Sell Setup - M15PEPPERSTONE:XAUUSD
Timeframe: m15
Risk Level: Medium
🔹 Setup:
Price is testing the upper boundary of the descending channel.
📈 Entry:
Current price zone: 3302.5
🎯 Targets (TP):
TP1: 3393
TP2: 3283
TP4: 3264
TP6: 3244
⛔ Stop Loss (SL):
3312.2
#XAUUSD #GOLD #SELL #Signal #MJTrading
Psychology Always Matters:
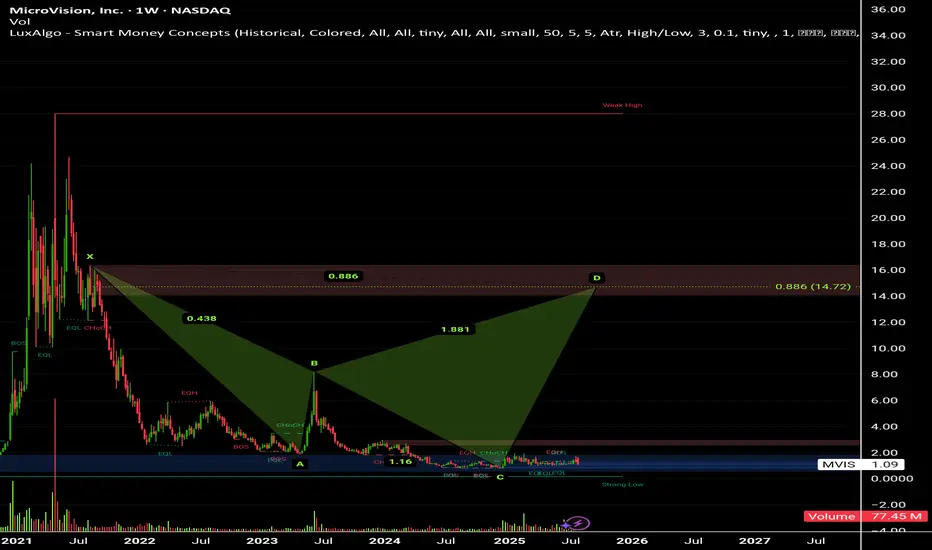
Microvision Inc (MVIS).Stock on triggering Explosive Level.
🦈 Shark Harmonic shap Target price above 14$ .
Any breaking up Resistance level 1.21$ , Buying signal triggering, Explosive level = 1.95$
Highly recommended for Buying now 👌
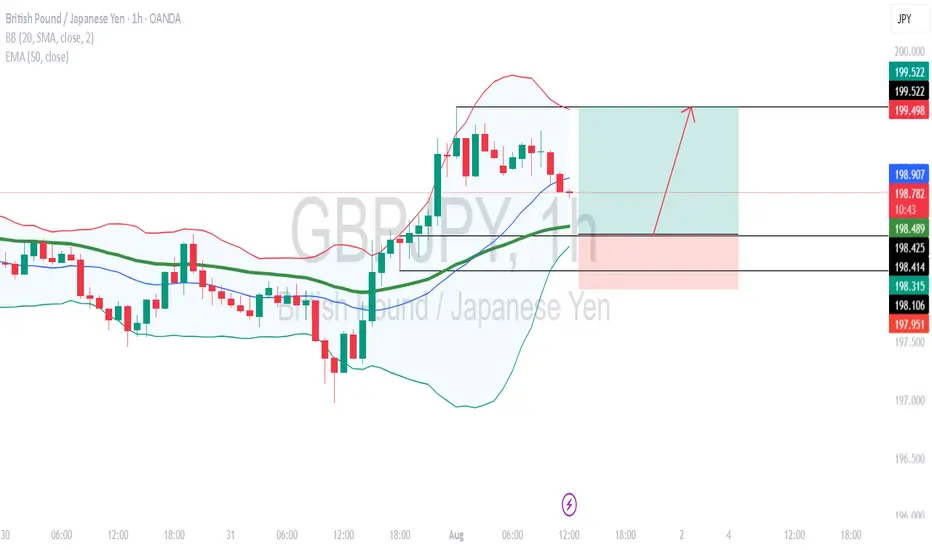
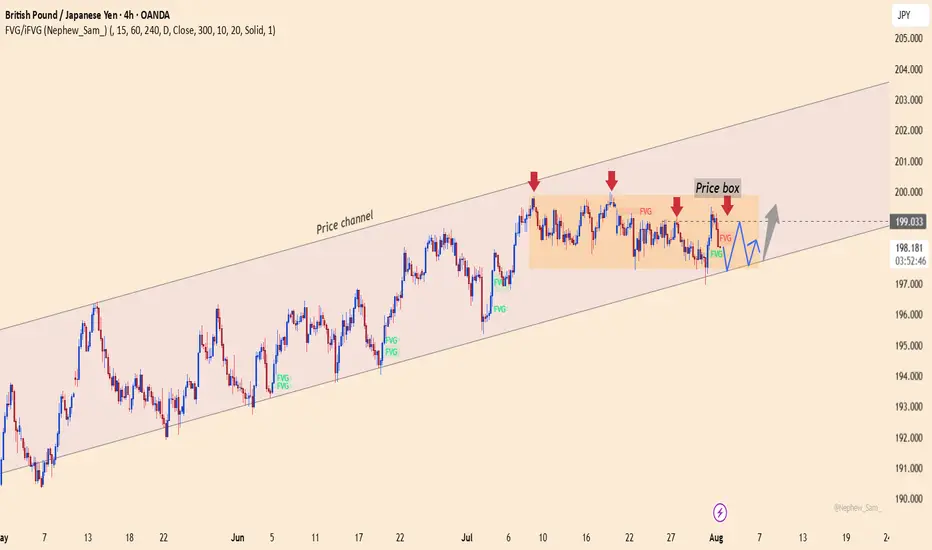
GBPJPY holds momentum, waiting for the final pushThe GBPJPY pair is moving sideways between 197.400 and 199.000, while maintaining its position inside the ascending price channel. Each pullback is quickly absorbed near the lower support, indicating that buying pressure is quietly building.
💡 Bullish factors supporting the trend:
– UK Services PMI beats expectations, strengthening economic outlook.
– BOJ maintains negative interest rates, weakening the JPY.
– Risk-on sentiment drives capital back into the GBP.
🎯 Suggested strategy:
Buy near 197.400 or on a breakout above 199.000.
Target: 201.500 | Stop-loss: below 196.800.
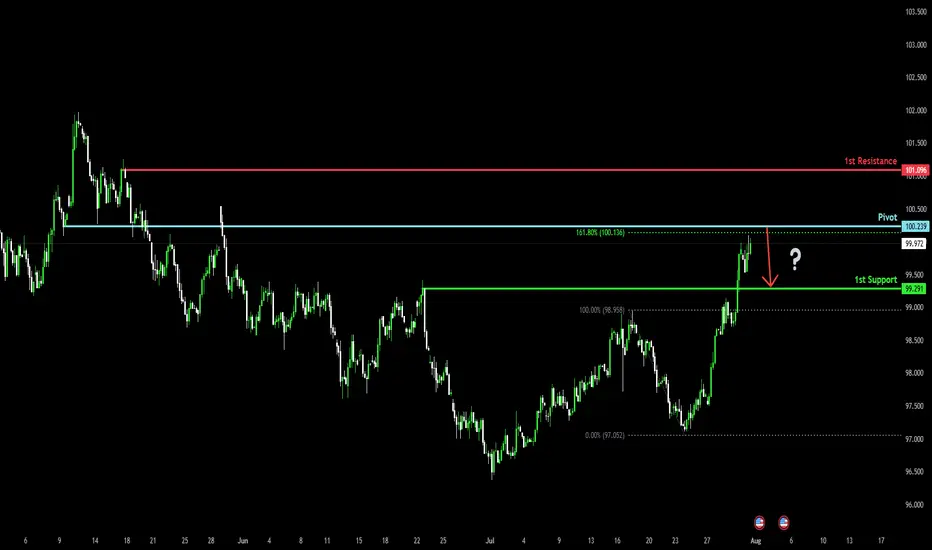
Bearish reversal off overlap resistance?The US Dollar Index (DXY) is rising towards the pivot and could reverse to the 1st support.
Pivot: 100.23
1st Support: 99.29
1st Resistance: 101.09
Risk Warning:
Trading Forex and CFDs carries a high level of risk to your capital and you should only trade with money you can afford to lose. Trading Forex and CFDs may not be suitable for all investors, so please ensure that you fully understand the risks involved and seek independent advice if necessary.
Disclaimer:
The above opinions given constitute general market commentary, and do not constitute the opinion or advice of IC Markets or any form of personal or investment advice.
Any opinions, news, research, analyses, prices, other information, or links to third-party sites contained on this website are provided on an "as-is" basis, are intended only to be informative, is not an advice nor a recommendation, nor research, or a record of our trading prices, or an offer of, or solicitation for a transaction in any financial instrument and thus should not be treated as such. The information provided does not involve any specific investment objectives, financial situation and needs of any specific person who may receive it. Please be aware, that past performance is not a reliable indicator of future performance and/or results. Past Performance or Forward-looking scenarios based upon the reasonable beliefs of the third-party provider are not a guarantee of future performance. Actual results may differ materially from those anticipated in forward-looking or past performance statements. IC Markets makes no representation or warranty and assumes no liability as to the accuracy or completeness of the information provided, nor any loss arising from any investment based on a recommendation, forecast or any information supplied by any third-party.
GBPJPY pullback for another bullish moveDaily candle closed with strong bullish.
A healthy pullback observed during Asian session.
I'm waiting at marking area for buy entry.
Calculate your own risk & reward.
Good Luck