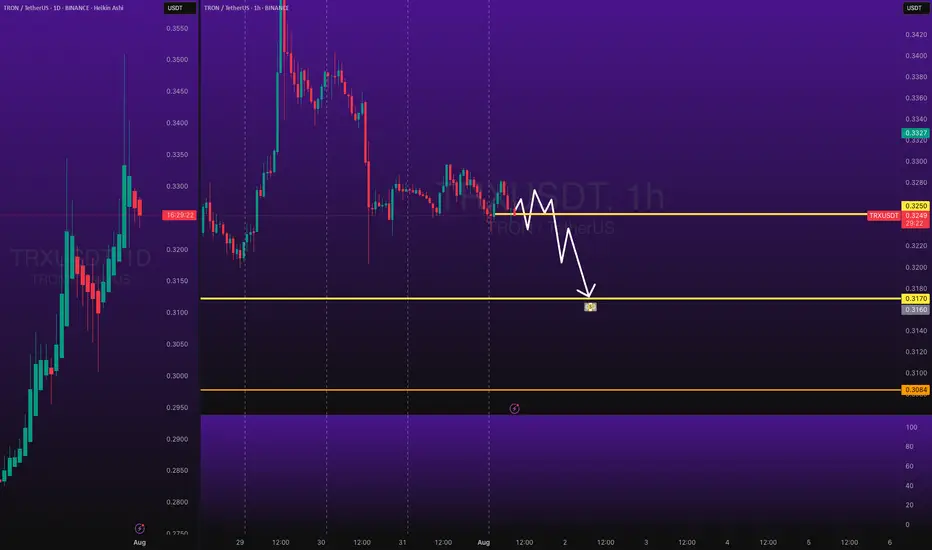
TRXUSDT Short Trade - Price CorrectionsBINANCE:TRXUSDT Short Day Trade - Low Risk, with my back testing of this strategy, it hits multiple possible take profits, manage your position accordingly.
Note: Manage your risk yourself, its risky trade, see how much your can risk yourself on this trade.
Use proper risk management
Looks like good trade.
Lets monitor.
Use proper risk management.
Disclaimer: only idea, not advice
Chart Patterns
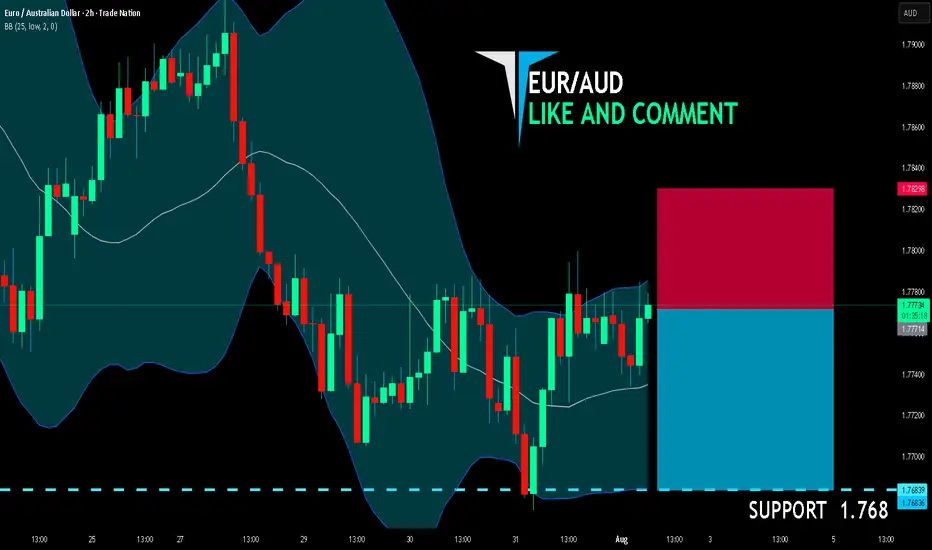
EUR/AUD BEARS ARE GAINING STRENGTH|SHORT
EUR/AUD SIGNAL
Trade Direction: short
Entry Level: 1.777
Target Level: 1.768
Stop Loss: 1.782
RISK PROFILE
Risk level: medium
Suggested risk: 1%
Timeframe: 2h
Disclosure: I am part of Trade Nation's Influencer program and receive a monthly fee for using their TradingView charts in my analysis.
✅LIKE AND COMMENT MY IDEAS✅
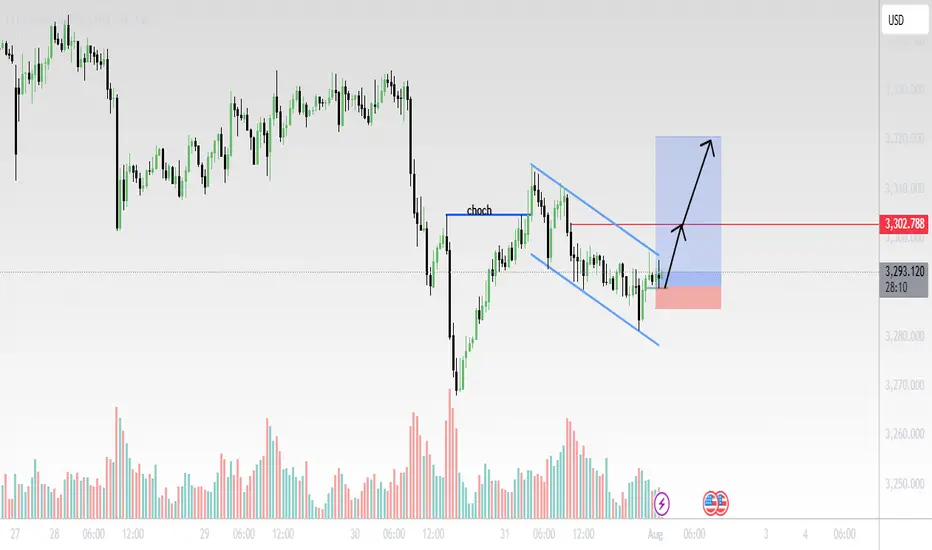
Gold (XAU/USD) 30-Min Chart Analysis – August 1, 2025Structure Summary:
CHoCH (Change of Character) confirmed after price broke the previous lower high, signaling a potential trend reversal.
Price has since formed a bullish falling wedge (blue trendlines), a classic continuation pattern after CHoCH.
Volume spikes during reversal attempts suggest accumulation.
Trade Setup:
Entry: Breakout above wedge resistance.
Stop Loss: Below recent swing low near 3280 area (red zone).
Target: Around 3315–3320 zone (blue box), aligned with previous demand-turned-supply area.
📌 Outlook:
Bullish breakout expected if momentum sustains.
Watch for confirmation candle with volume above the wedge.
Clean R:R setup with tight SL and wide TP potential.
📊 Technical Bias: Bullish
❗Risk Management: Adjust position size based on lot exposure and account size.
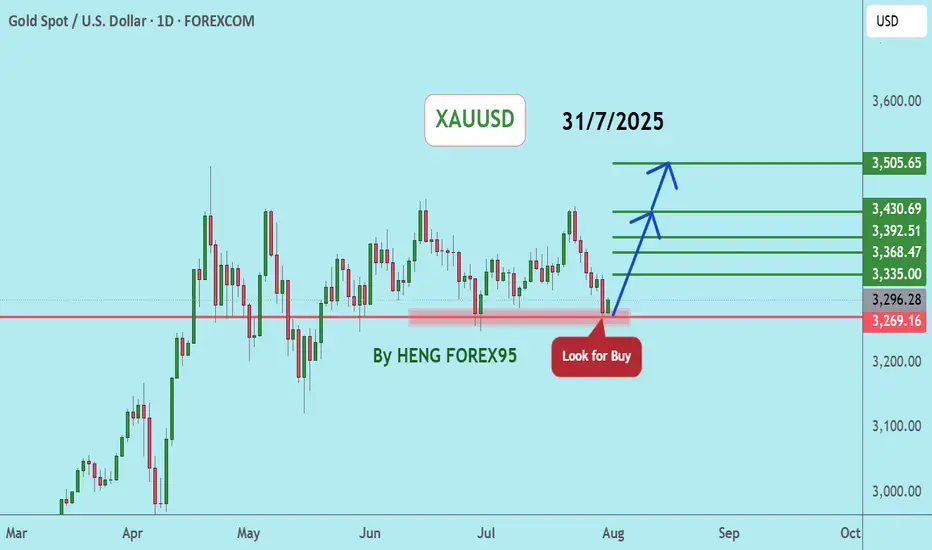
BULLISH REVERSALAfter struggling between the 2 key levels, XAUUSD showed a change of character indicating a reversal. Target is 500 pips.
HBARSimiliar scenario to BYBIT:BTCUSDT.P just have to wait for the daily close.
I marked out a potential entry are with the red line, which is a 4H order block which COULD be tapped
Again I will update you on my entry ASAP
Do not forget to follow and like, it helps me alot.
Stay blessed
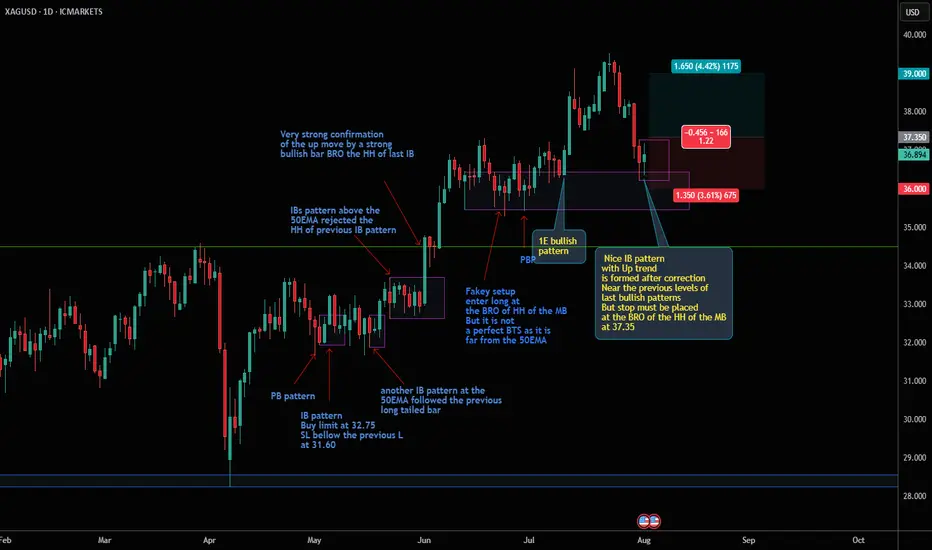
Silver XAGUSD is forming a bullish IB pattern The market of silver XAGUSD is in Up trend
it formed a correction wave
near the previous levels of multi bullish price action between 36 and 36,30
this market is forming an IB pattern
buy stop order must be place at the HH of the MB at the price 37.35
SL 36
TP 39
Cup and handleTarget 1 is 5800, calculated from taking the height of the cup and handle structure divided by 2, added to the top of the handle inflection point.
GBPUSD MULTI TIME FRIME ANALYSISBased on the TREX method, this analysis is expected to be bearish, but the market is 50-50 and the pound may break the zone and rise.
If the sound quality is bad, forgive your greatness.

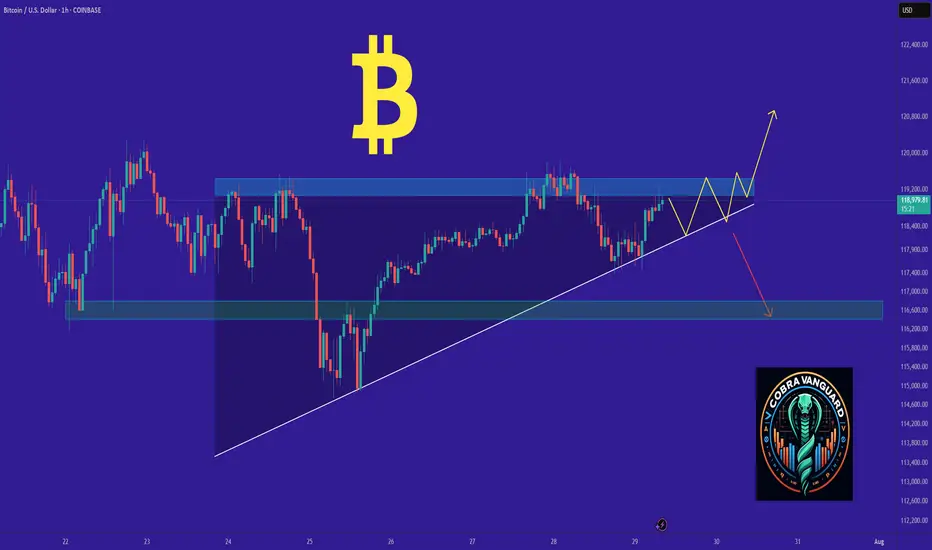
BITCOIN's Situation (1h) !!!The price is within an ascending triangle, which could be encouraging. However, since crypto doesn't always follow patterns, it might break down from below and correct to around $116K!
Best regards CobraVanguard.💚
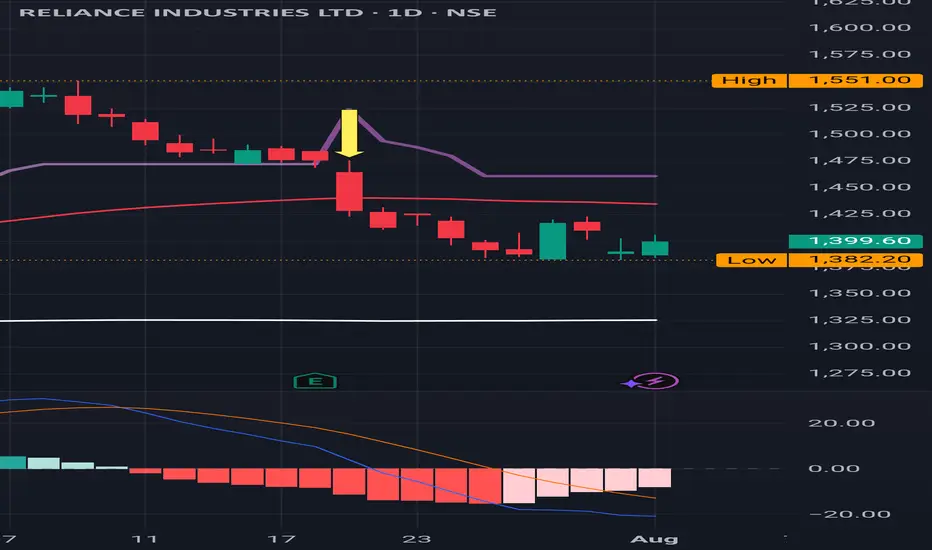
REL : Sitting at an important support level of 1400 ish.
REL : Sitting at an important support level of 1400 ish.
( Not a Buy / Sell Recommendation
Do your own due diligence ,Market is subject to risks, This is my own view and for learning only .)
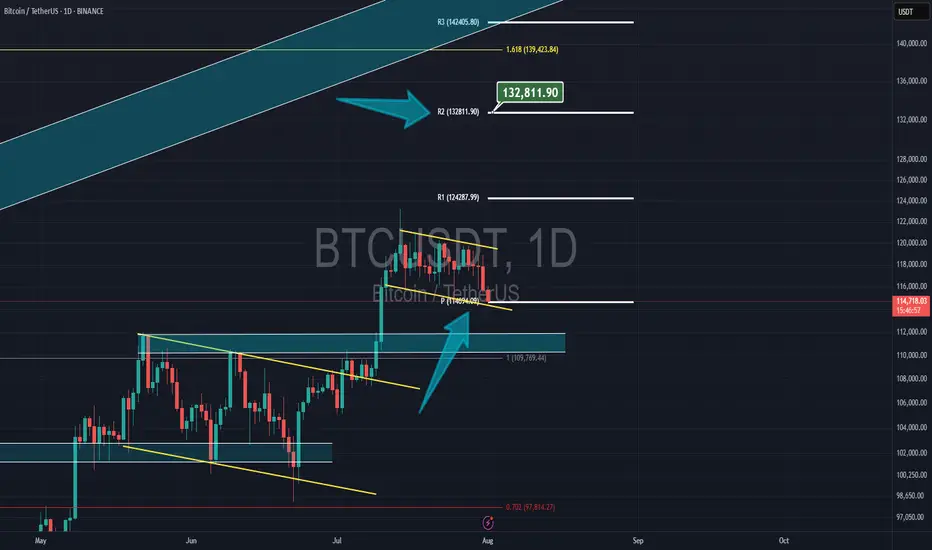
Bitcoin & NEW monthly PivotBitcoin had a correction yesterday but now its still above the new monthly pivot at $14,700 and my target is the 2nd resistance of the pivot at $132,800
BUY GOLDStill buy oriented for now. Cont from prev post. Will take positions based on price fracturing
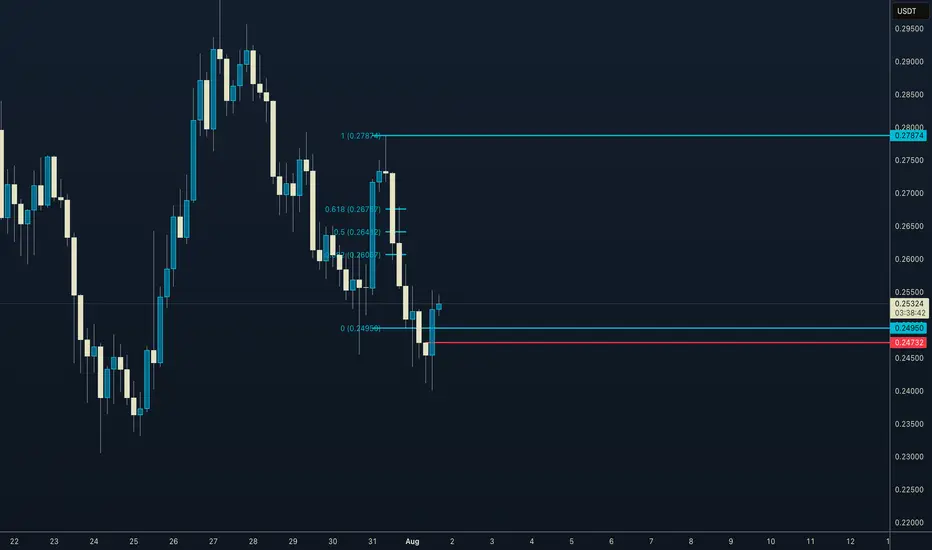
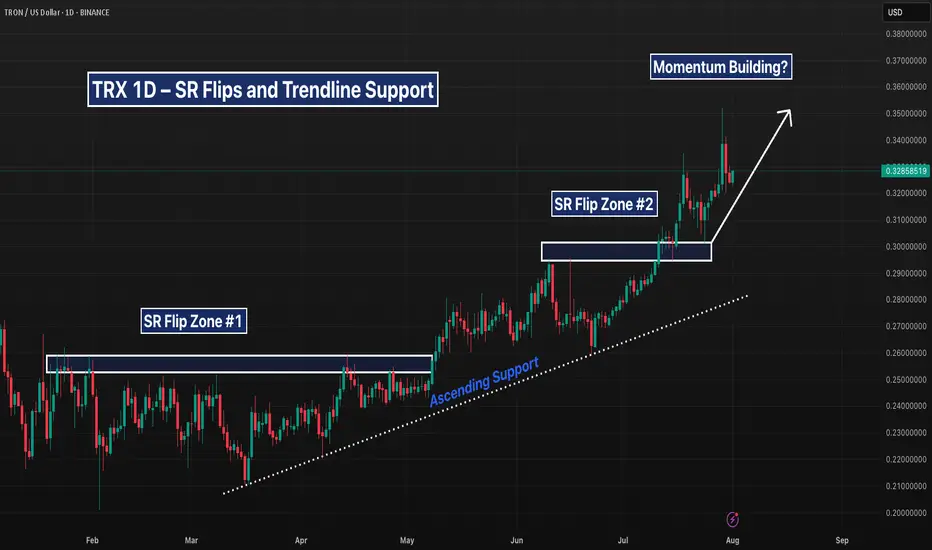
TRX 1D – SR Flips and Trendline Support Hold StrongTRX continues to respect trend structure — clean support retests, ascending trendline intact, and back-to-back SR flips fueling continuation.
With another higher low forming off the recent flip zone, bulls may be eyeing a move into the $0.35+ range. But watch closely — if price breaks below $0.30, structure could crack.
Trend still leans bullish… for now.
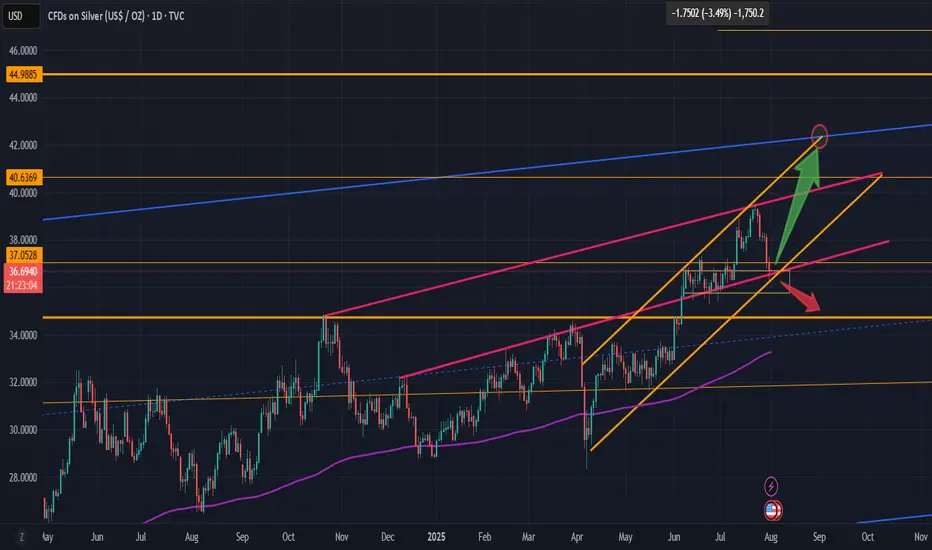
Silver short term potential correction within a bull marketSilver short term potential correction within a bull market. Either way...
Don't leverage. Buy ETF or physical, and hold.
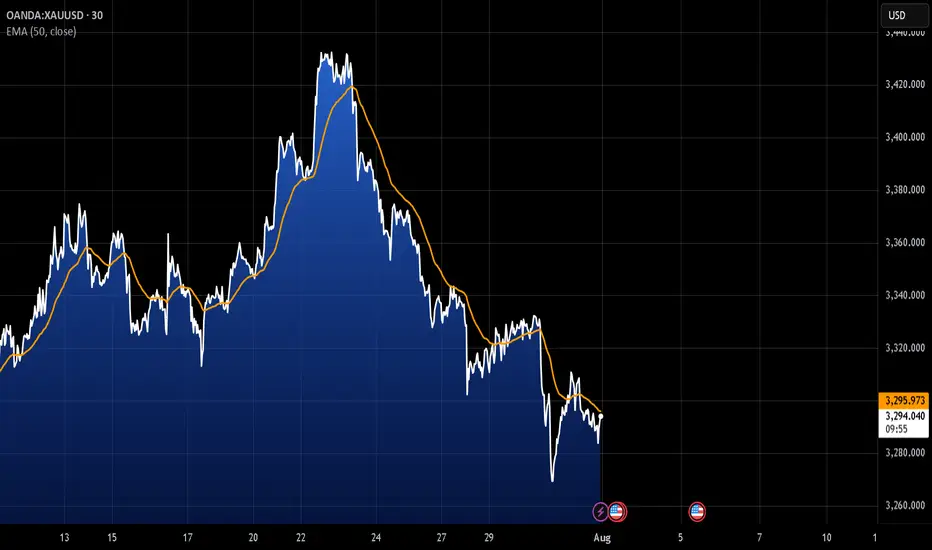
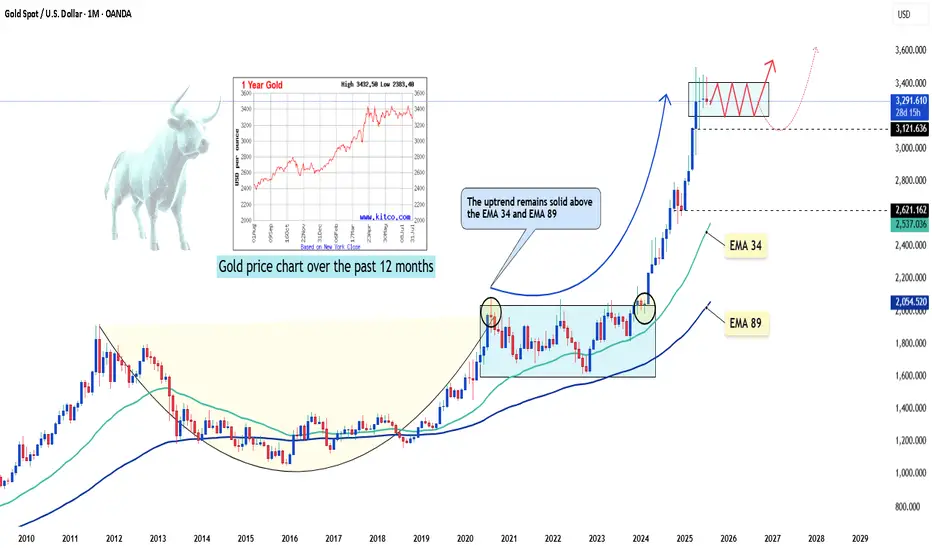
XAUUSD – the calm before the next breakout?Hello traders, what’s your take on the current trend in OANDA:XAUUSD ?
Looking back over the past 12 months, gold has delivered a truly impressive performance. From around $2,380 in August 2024, the precious metal surged to an all-time high of $3,432 by April this year — a gain of more than $1,000 in less than a year. But what’s more telling than the rise itself is how the market behaved afterward: instead of crashing, gold has maintained a high consolidation range, suggesting the uptrend is still very much alive.
This powerful rally didn’t happen in isolation. In a world marked by uncertainty, gold has once again asserted its role as a safe-haven asset. Inflation remains persistent across major economies, geopolitical tensions continue to stretch from Eastern Europe to the Middle East and Asia, and de-dollarization efforts by countries like China and Russia are reshaping global capital flows. None of these events alone could shake the markets, but together, they have laid the groundwork for gold’s sustained relevance.
From a technical standpoint, the long-term bullish structure remains intact. Following its peak at $3,432, gold has entered a modest correction phase — one that may well be a healthy consolidation before the next directional move.
Interestingly, while many investors remain cautious, the chart paints a different story: a market that isn’t afraid, but simply catching its breath. The real question is no longer “Can gold hold above $3,400?” but rather “Is the market gearing up for a fresh breakout — or a deeper correction?”
We may not be able to predict the future, but we can observe how price reacts at key levels. And sometimes, it’s in these seemingly quiet phases that the biggest turning points begin to form.
What do you think — is gold preparing for another leg up?
Drop your thoughts in the comments below! 👇
Time to catch its breathAfter the break to lower prices in the daily S&P 500 chart, the expectation for Monday is for the market to stop and catch its breath which means are not looking for a big day down on Monday but rather a sideways so only slightly lower move without new fundamental information to stimulate the market.

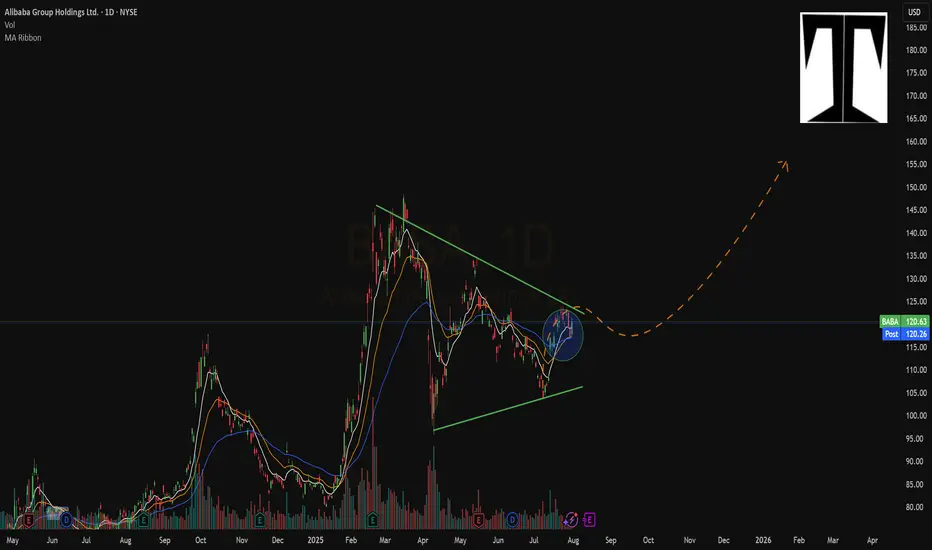
New Setup : $BABAInside this wedge there is a nice pullback to the ema 50.
Bullish ATR Break popped out with a new crossover.
Ready To Catch It !
XAUUSDUpdate:
Gold Price Trend: As per our previous analysis on July 28, 2025, the price has now tested the support at 3,269. We expect that if the gold price can hold above 3,249, the gold price trend will remain bullish. We recommend considering buying in the red zone.
🔥Trading futures, forex, CFDs and stocks carries a risk of loss.
Please consider carefully whether such trading is suitable for you.
>>GooD Luck 😊
❤️ Like and subscribe to never miss a new idea!
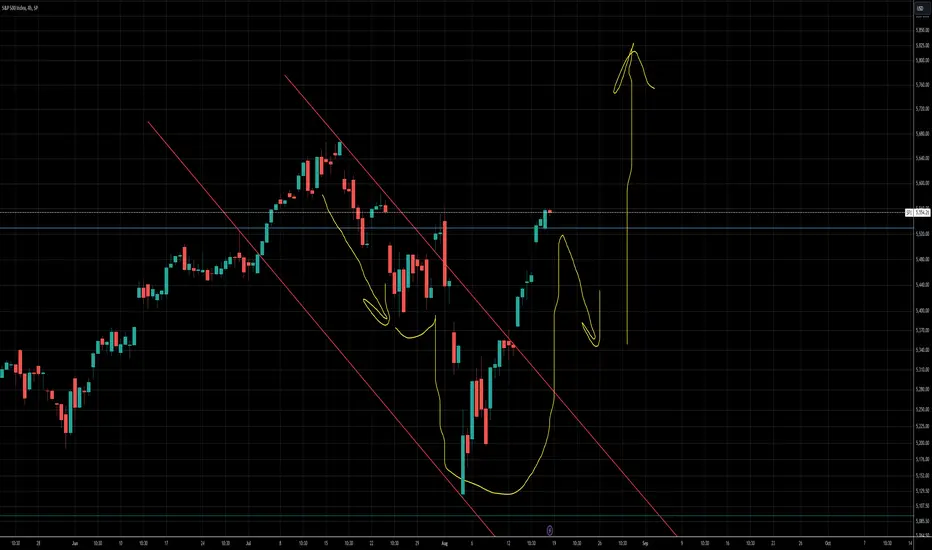
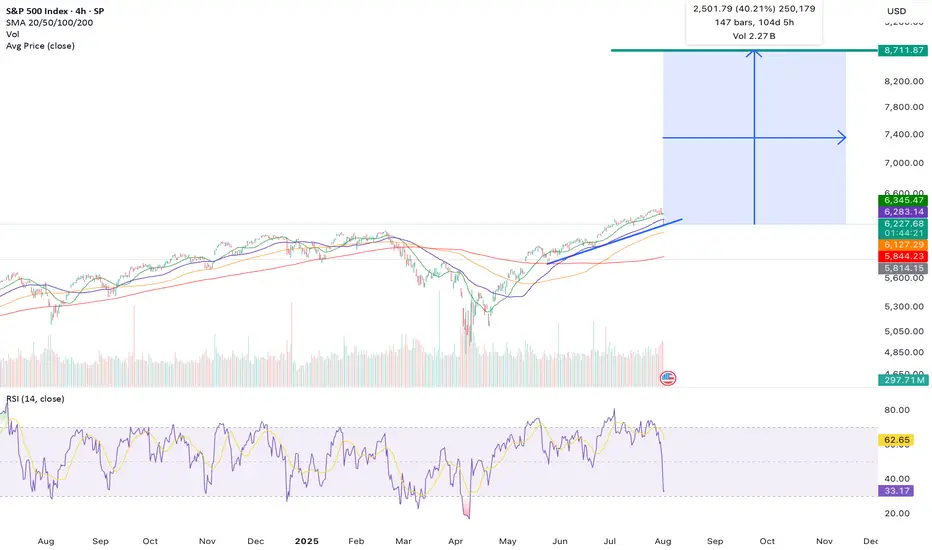
The Low Is In: Why the S&P 500 Just Confirmed a Bullish Reversal🔥 The Low Is In: Why the S&P 500 Just Confirmed a Major Bullish Reversal 🔥
The market just gave us a gift.
After weeks of drifting lower and sentiment turning cautious, the S&P 500 has touched — and bounced — off a critical rising trendline for the third time since May 2025. That third touch isn't just a technical coincidence… it's often the launchpad for a new impulsive leg higher.
📈 The Power of the 3rd Touch: Trendline Validation Complete
Look at the chart. This isn’t guesswork. Since May, the S&P 500 has been respecting a well-defined ascending trendline, one that connects multiple higher lows during this bull run.
The first touch was the May liftoff after the April consolidation.
The second came in June — a clean retest and bounce.
Now, as of early August, the third touch has held once again, exactly where the bulls needed it most.
This isn’t a random line on a chart. This is institutional flow stepping in to defend structure.
And when a rising trendline holds for a third time after a strong uptrend? That’s a classic continuation signal.
📉 RSI Washout + Structural Support = Perfect Storm for a Bottom
The RSI printed a dramatic dip to ~32, a level that screams “oversold” on the 4-hour timeframe. But notice the context — it happened right at structural support.
This is not weakness. This is accumulation.
Big players shake out weak hands on low timeframes… right before they send it.
🧠 Sentiment Is Offside… Again
Let’s not forget: this retrace came after a huge run-up since March. People expected a deeper correction. Bears started getting loud again.
That’s how bull markets trap you — by convincing you it’s over right before the next leg higher.
And with macro tailwinds (liquidity expansion, fiscal spend, tariff rollbacks), earnings season beats, and global capital rotation into U.S. equities, this setup is ripe for a violent upside squeeze.
🚀 8,700 in Sight: My End-of-Year Price Target Is Very Much in Play
Today’s close around 6,220 means the S&P 500 would need to rally ~40% to hit my target of 8,700 by year-end.
Sounds crazy? Not if you’ve seen what happens during parabolic melt-ups.
This isn’t just hope:
📊 Strong breadth under the surface
🏛️ Dovish policy pivot now expected in Q4
💸 Retail and institutional capital both re-engaging
📉 Bond yields are starting to roll over, supporting equity valuations
When bull markets enter their euphoria phase, they don’t stop at “reasonable” targets. They blast through them.
💡 The Setup Is Textbook — Now It’s About Execution
✅ Trendline defended
✅ RSI reset
✅ Sentiment shaken out
✅ Structure intact
The technicals just aligned with the macro. The low is in — and the runway to 8,700 is wide open.
Strap in. Q4 could be one for the history books.
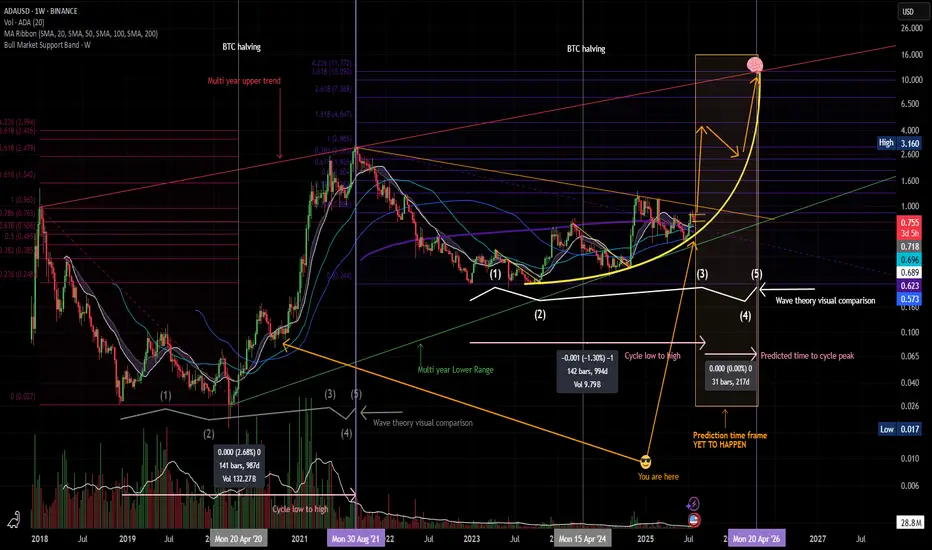
$ADA Macro ThesisGD To all
I have cleaned up and thrown a few other correlated patterns on the Chart for my Macro thesis.
You will have to watch the metrics and on chain data as well as sentiment to verify as we move fwd.
This is Pattern recognition on a Log Chart:
BINANCE:ADAUSD
I have been using this thesis since 2019 and have been able to successfully ident general buy/sell points ( weighing against real world events and on chain data )
I hope it helps you and feel free to ask questions.
Told ya I like crayons
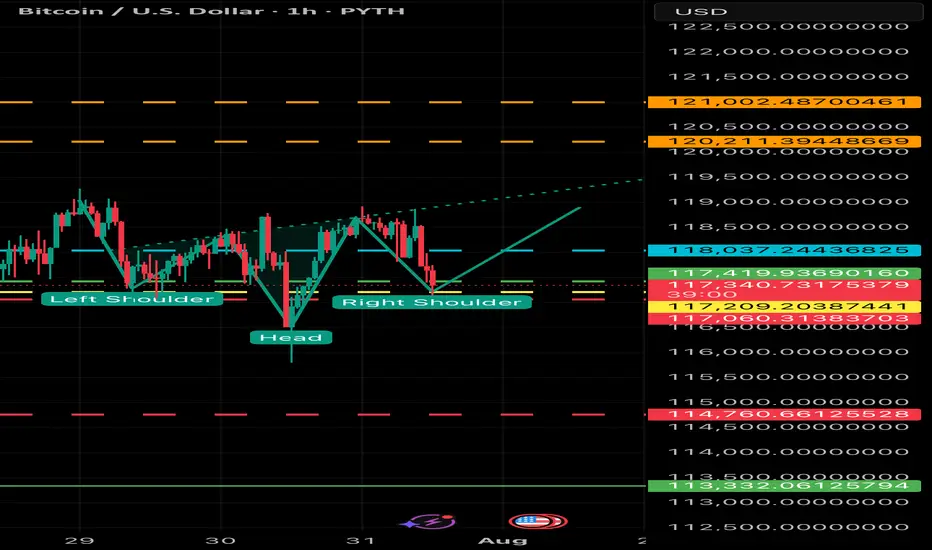
BULLISH BTC - Potential Inverted head and shoulders forming Potential breakout to $119 to $124,000 - Look for volume and support at $116 to $117,000. Breakout above $118,500 will confirm formation.
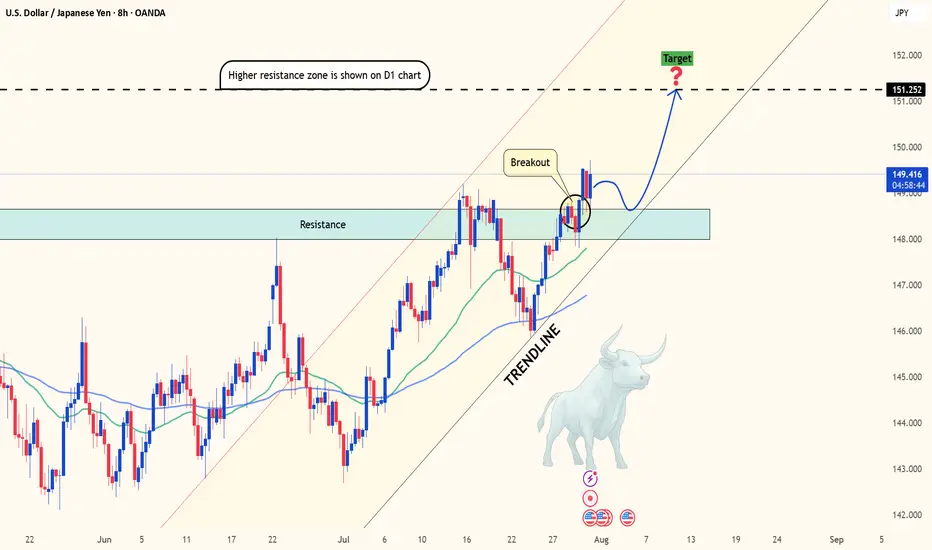
USDJPY breaks out as US data crushes forecastsHello traders! Do you think USDJPY will continue its upward momentum?
From a technical perspective, after several sessions of "building pressure," this pair has finally broken through a key resistance zone—opening the door to what could be the next bullish breakout.
Current price action suggests the uptrend remains firmly intact. The market continues to respect the rising trendline and finds strong support near the 34 & 89 EMA – a powerful technical combination that buyers often rely on. This isn’t just a typical breakout; it could be the start of a brand-new bullish cycle.
On the fundamental side, the U.S. dollar remains strong, supported by a string of solid economic data: employment, PCE, and consumer spending have all exceeded expectations. Meanwhile, the Japanese yen remains in “hibernation” as the Bank of Japan shows no sign of shifting away from its ultra-loose monetary policy. This divergence makes USDJPY one of the hottest pairs on the radar right now.
What’s next? If bullish momentum continues, the 151.25 level is likely the next short-term target. However, if the price encounters strong resistance at that level, a minor pullback could occur before the uptrend resumes.
So, what do you think? Is this the beginning of a major rally – or just a false breakout? Share your thoughts in the comments!
Wishing you successful and well-timed trades ahead!
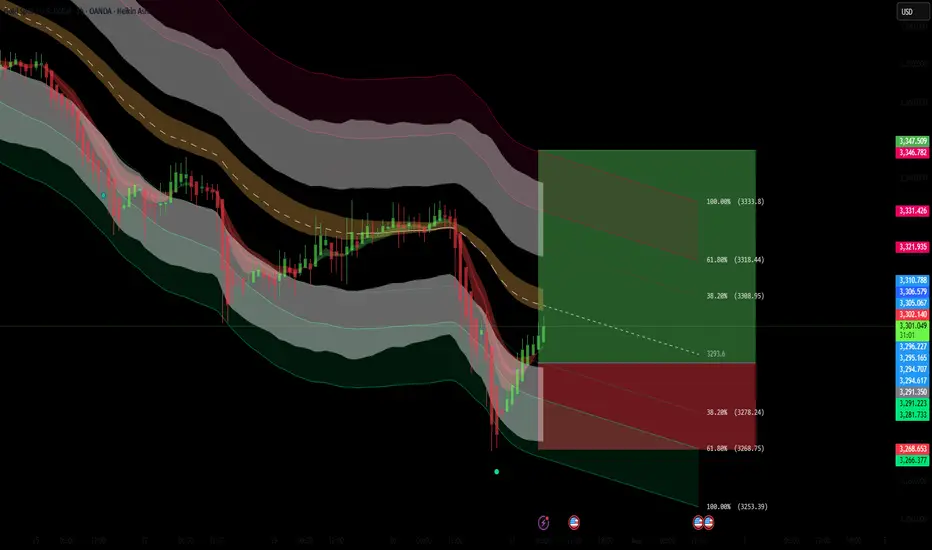
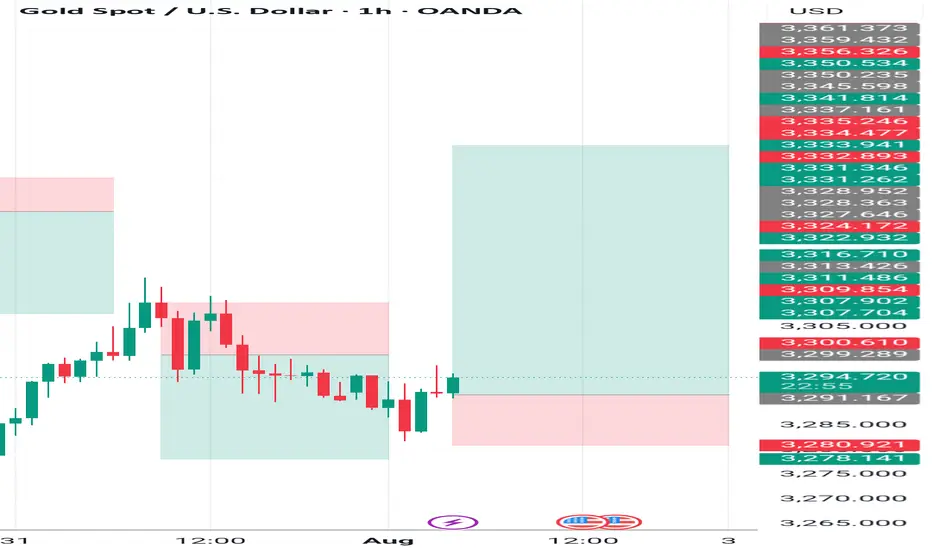
XAUUSD Long Setup – 1HGold (XAUUSD) has shown strong bullish rejection from the lower volatility band after a sharp selloff. The appearance of a Heikin Ashi reversal candle, suggests a short-term reversal is forming. Price has reclaimed key structure and is now targeting a reversion back to the mean, supported by Fibonacci retracement levels.
Entry: 3293.55
Target Zone: 3308.91 → 3333.76 (Fib 38.2% – 100%)
Stop Loss: 3253.35
Confluences:
✅ Bullish engulfing + Heikin Ashi trend shift
✅ Oversold bounce from lower channel extremity
✅ Fib retracement aligns with key structural resistance zones
✅ Custom signal confirmation (green dot)
✅ Clean R:R toward upper band and previous POI
Short-term counter-trend long targeting liquidity grab and mean reversion toward the 3308–3333 zone. Risk tightly managed with SL below local swing low.