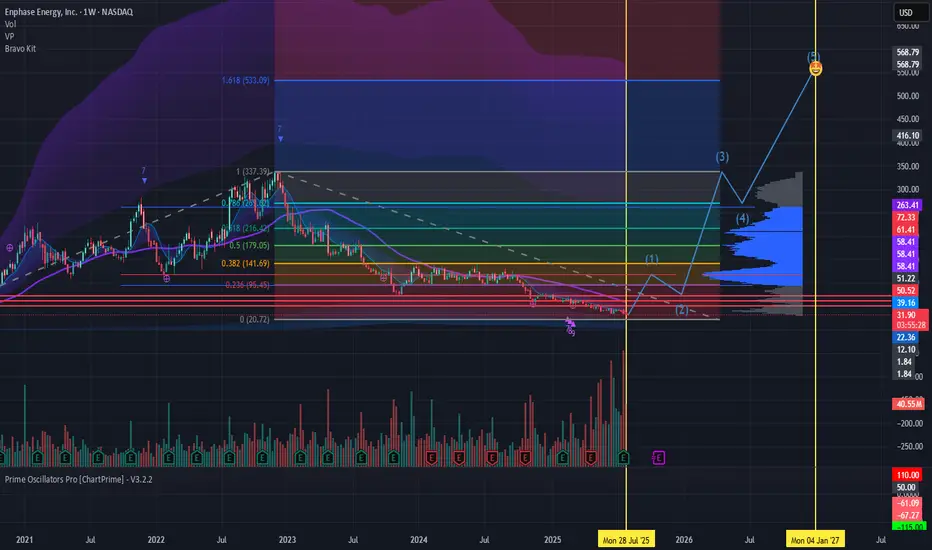
$ENPH About to make new highs Enphase trades inverse crypto and the crypto trade is coming to a quick end. Stored energy theory states during times of excess energy BTC will thrive. We are now in a new regime of AI energy cost and ENPHASE has the best batteries to scale. Minimum Target $550
Positions
1130 ENPH $50 Calls for 10/17/2025
511 ENPH $100 Calls for 01/15/2027
Chart Patterns
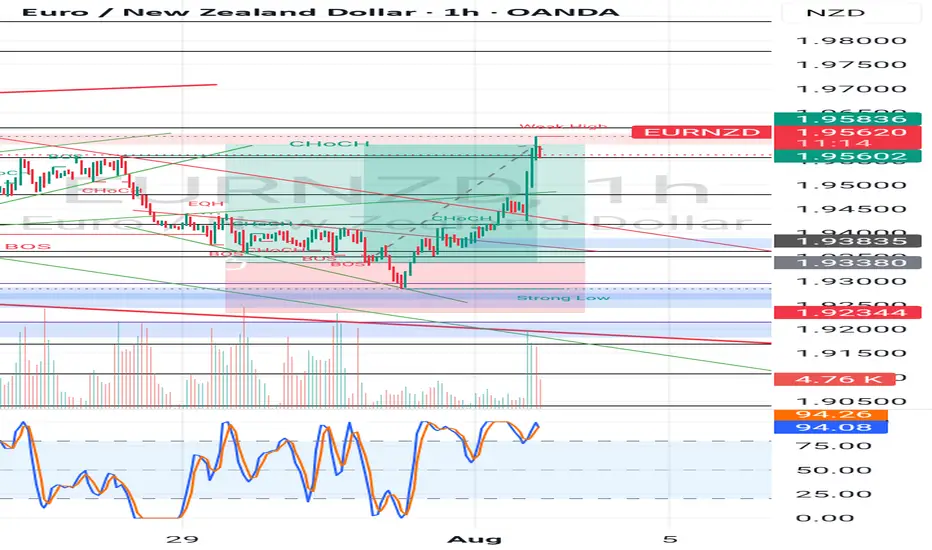
EUR NZD LONG RESULT Price moved better than anticipated, after adjusting my stop loss a little above break even, I decided to risk extended TP to the Supply zone, and the news pushed price directly in our Favor and TP Done ✅.
Not a financial advice though.
_THE_KLASSIC_TRADER_.
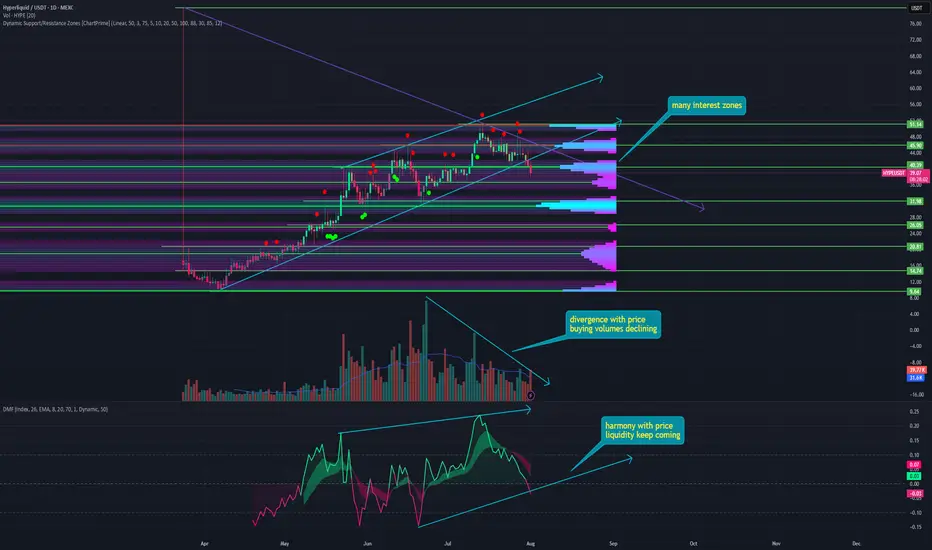
HYPE - a major correction can be expected One of the most interesting tokens of the HYPE cycle. It initially fell to zero, then rebounded and began to set new all-time highs one after another. During corrections, it even outperformed Bitcoin.
But all good things come to an end sooner or later, and for HYPE, the time has probably come to cool down, and here's why:
➡️ HYPE broke its ascending flag pattern for the first time in four months, signaling a potential trend reversal.
➡️ Throughout the last month, HYPE's growth has been accompanied by a divergence in purchase volumes, indicating declining interest from buyers.
➡️ Money Flow, although in harmony with the scene, began a major fix of positions at the last ATH of $51, and in just a couple of days, the indicator fell into negative territory. Potentially breaking through its sloping support.
➡️ The main areas of interest are at the top, apparently attracting limit orders for shorts. And the first major support level has already been broken at $40.
➡️ The next major support is at $30, where we can expect an upward rebound.
📌 Conclusion:
HYPE has been growing for a very long time, against all odds, against the entire market. And the moment had to come when profit-taking would begin. $50 is a major psychological level, and liquidity has begun to leak out noticeably.
So perhaps this stage is already upon us. But I would not rush to look for buying opportunities, even on the spot. The token is very young, and we do not yet know its real price; it has been both $50 and $9. It is worth giving it time to trade so that we can find out its fair price over time.
Good health and big profits to all! 🔥
2 Scenarios for BTCNow that the cup and handle formation has been reached and the correction finished, I think we have 1 more leg up.
It's also possible that we fall from here, but I think another fakeout upwards is likely as bearish divergence forms on the month, but isn't quite there yet (RSI needs 1 more higher high to confirm bearish divergence)
Either way, my short targets are the 0.618 fibs. I am expecting the typical -70-75% crash by 2027 before the next cycle begins

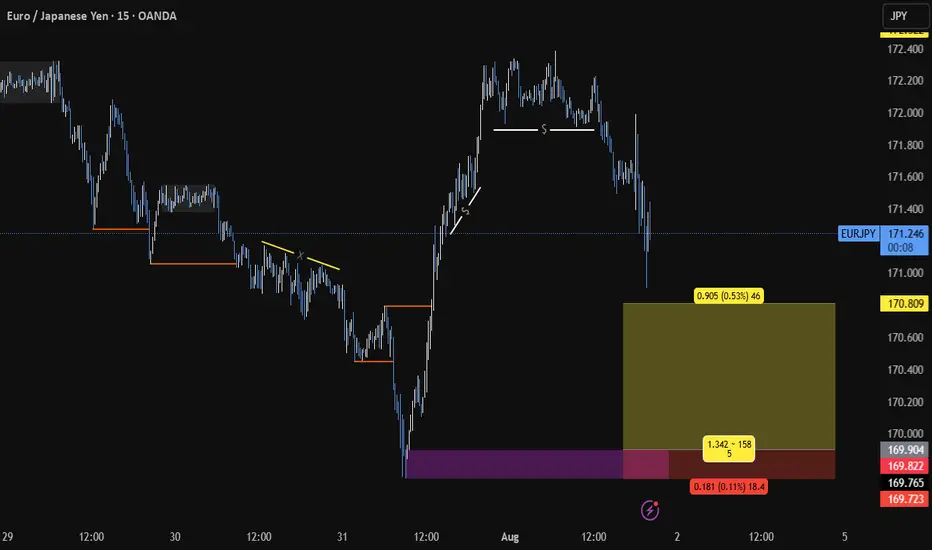
EURJPY BUYBUY @169.904
SL @169.723
TP @170.809
If it moves above and create a BOS, then close the trade....
And always risk 1%
SILVER: Local Bullish Bias! Long!
My dear friends,
Today we will analyse SILVER together☺️
The recent price action suggests a shift in mid-term momentum. A break above the current local range around 36.920 will confirm the new direction upwards with the target being the next key level of 37.150 and a reconvened placement of a stop-loss beyond the range.
❤️Sending you lots of Love and Hugs❤️

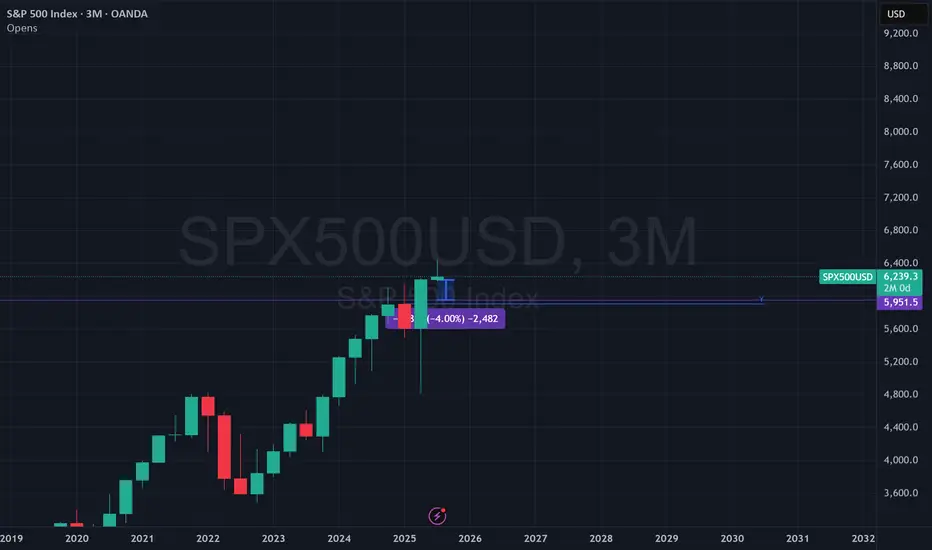
Bearish Engulfing on Risk. Average quarterly downside since 2023 open is 4.07%. Is a retest of near the yearly open on order over the month of August? Markets are no longer pricing in a Fed rate cut in September. Will that be the near term bearish fuel?
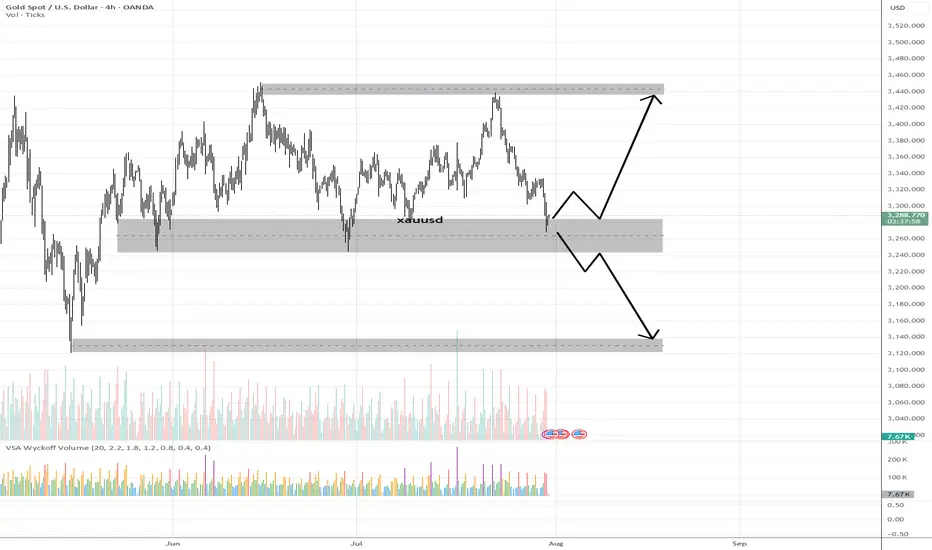
XAUUSD – Demand Zone Reaction & Potential Markup (VSA Analysis)💡 Idea:
Gold is testing a major 4H demand zone with early signs of smart money accumulation. VSA signals show supply exhaustion and potential for a bullish reversal toward upper resistance.
📍 Trade Setup:
Entry Zone: 3,265 – 3,285 (current demand zone)
Target 1: 3,380 – 3,400 (mid supply zone)
Target 2: 3,440 – 3,460 (major supply zone)
Stop Loss: Below 3,240 (to avoid false breakouts)
R:R Potential: ~3:1
📊 Technical Reasoning (VSA)
Stopping Volume Detected
On the recent drop into the demand zone, a wide spread down-bar on ultra-high volume appeared, followed by no further downside progress.
This is a classic stopping volume pattern where professional money absorbs selling pressure.
No Supply Confirmation
Subsequent candles inside the zone show narrow spreads on decreasing volume, indicating a lack of genuine selling interest.
Demand vs Supply Shift
Multiple attempts to break below 3,265 have failed, showing absorption of supply and positioning for markup.
If price rallies from here on increasing volume and wider spreads up, it would confirm demand dominance.
Structure Context
This demand zone has historically produced strong rallies.
Break above the minor resistance inside the zone could trigger a swift move toward Target 1, with momentum possibly extending to Target 2.
📌 Trading Plan:
Look for bullish confirmation bars with high volume before entry.
If price breaks below 3,240 on high volume, invalidate the long setup and watch for the next demand level around 3,140.
Partial profits can be taken at Target 1, and the remainder trailed toward Target 2.
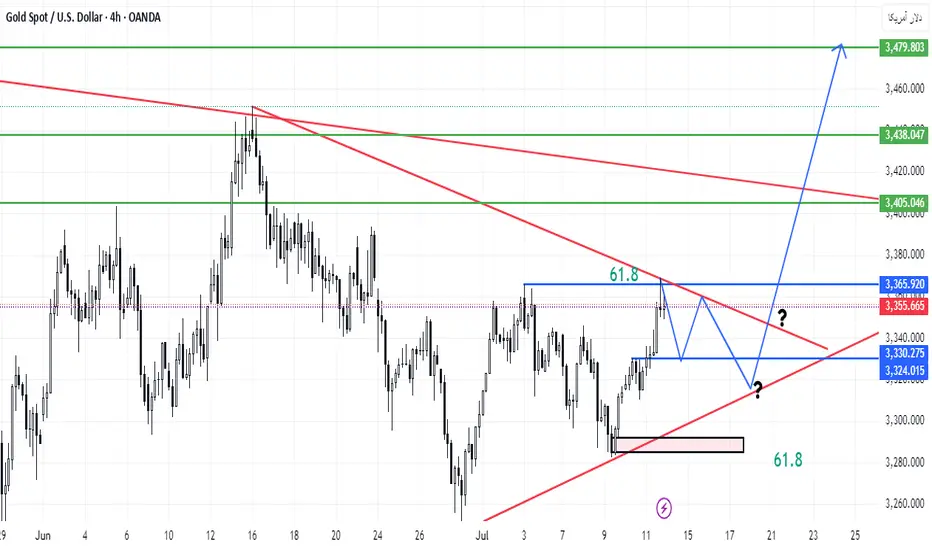
xauussWe will probably have a minor correction in this direction. We will wait for the trend line to break, if it breaks, the targets will be touched in order.
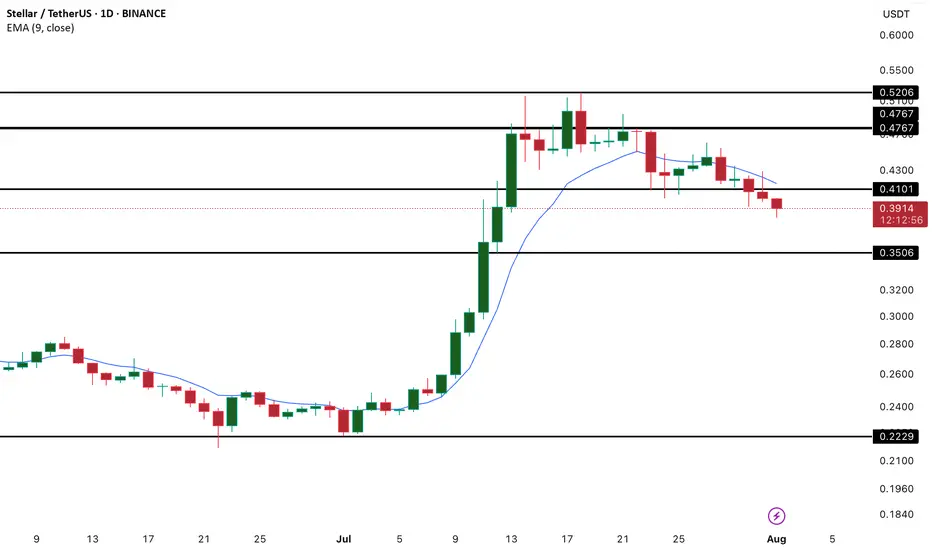
XLM/USD Analysis – Bearish Momentum Builds Below 20-Day EMA
XLM has taken a notable hit, with recent price action showing a sharp drop that has dragged the token below its 20-day Exponential Moving Average (EMA). Currently sitting at $0.40, the 20-day EMA now acts as a dynamic resistance level, capping potential upside in the short term.
This development signals a clear shift in short-term sentiment. The 20-day EMA, which reflects average pricing over the last 20 sessions with an emphasis on recent moves, typically supports bullish outlooks when the price remains above it. However, XLM's break below this level suggests growing sell-side pressure and a loss of bullish control.
With momentum weakening and bearish signals intensifying, traders may want to exercise caution, especially if the price fails to reclaim the EMA in the near term. Further downside could follow if buyers don't step in to reverse the trend.
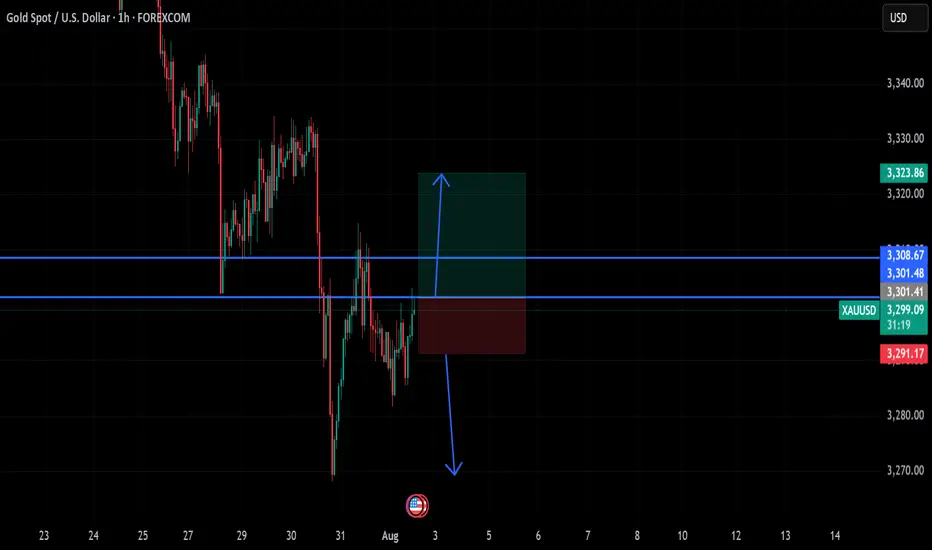
gold on third pattern breakout#XAUUSD have multiple test the third pattern, now price forming needs to breakout the 3308 before any further movement.
Buy entry 3301.4, TP 3308-3323.
Below 3291 holds a very strong bearish continuation, if breakout price will fall till 3269
XAUUSD Gold Trading Strategy August 1, 2025
Yesterday's trading session, gold prices recovered to the 3315 area and then continued to decrease to the 3281 area. Currently, gold prices are fluctuating quite unpredictably due to the impact of tariff news and investor confidence.
Basic news: The Federal Reserve FED continues to maintain the federal funds benchmark interest rate in the range of 4.25% - 4.50%, in line with policy since 2025. Chairman Powell did not give any signal about the next interest rate cut on September 16 - 17.
Technical analysis: After falling sharply to the 3269 area, gold prices are showing signs of recovery. In the current downtrend channel, there has been a higher bottom than the bottom at H1. We can see that if the bullish pattern at H1 is confirmed, combined with the reversal candlestick appearing at H4, the possibility of gold bouncing back to reach the resistance area of 3330, even 3350 is completely possible. In the weekend trading session, we will wait at the support zones to trade.
Important price zones today: 3280 - 3285 and 3269 - 3274.
Today's trading trend: BUY.
Recommended orders:
Plan 1: BUY XAUUSD zone 3283 - 3285
SL 3280
TP 3288 - 3300 - 3310 - 3330.
Plan 2: BUY XAUSD zone 3269 - 3271
SL 3266
TP 3274 - 3284 - 3300 - 3320.
Wish you a safe, favorable and profitable trading day.🥰🥰🥰🥰🥰

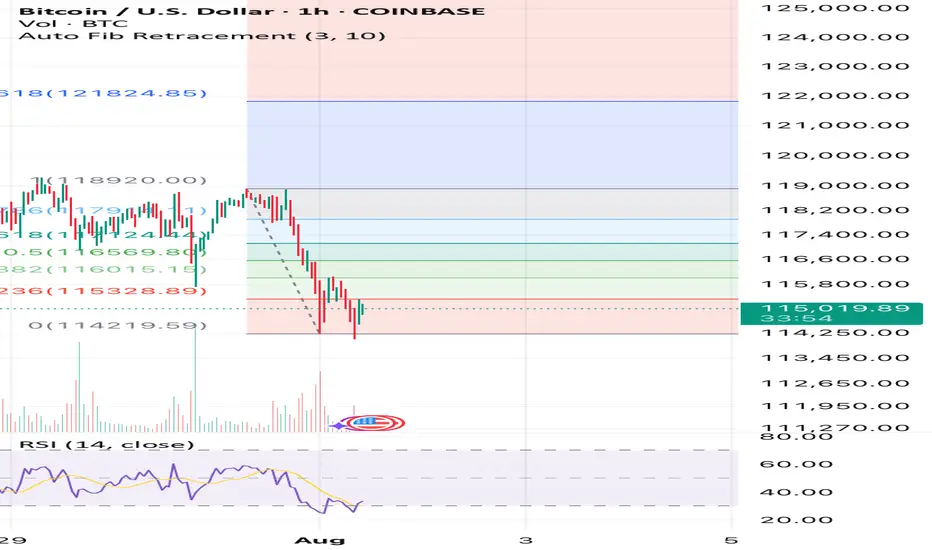
Bitcoin willIt hold if we stay above $115k ?? Fixing up last post I’ve deleted now as image was not good. Anyway simple RSI and Auto Fib Retrace with only general CRYPTOCAP:BTC market understanding backing this. This isn’t finacial advice at all. It’s pure speculation this post and anything related to it. I’m
Not a finacial advisor and I will not be held accountable for anyone’s actions that I didn’t do.
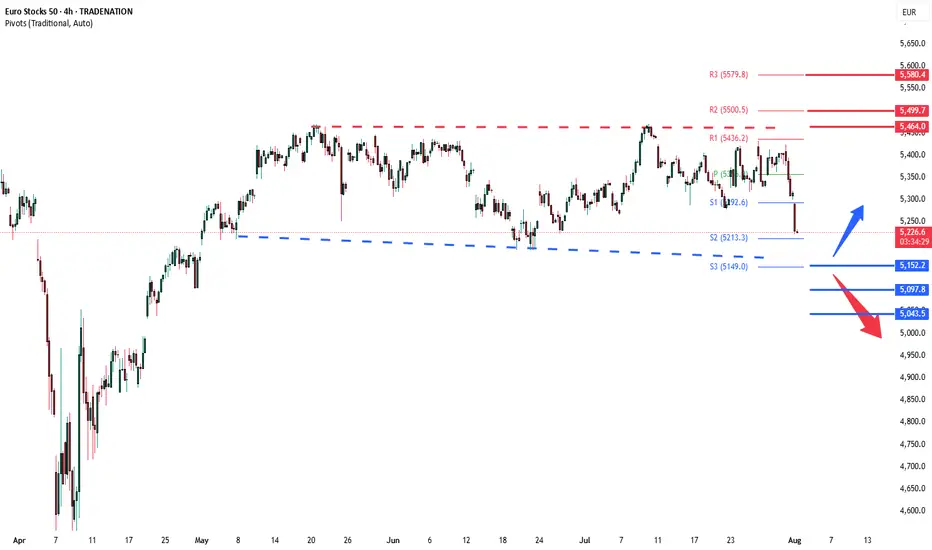
Stoxx sideways consolidation Key Support and Resistance Levels
Resistance Level 1: 5464
Resistance Level 2: 5500
Resistance Level 3: 5580
Support Level 1: 5152
Support Level 2: 5097
Support Level 3: 5044
This communication is for informational purposes only and should not be viewed as any form of recommendation as to a particular course of action or as investment advice. It is not intended as an offer or solicitation for the purchase or sale of any financial instrument or as an official confirmation of any transaction. Opinions, estimates and assumptions expressed herein are made as of the date of this communication and are subject to change without notice. This communication has been prepared based upon information, including market prices, data and other information, believed to be reliable; however, Trade Nation does not warrant its completeness or accuracy. All market prices and market data contained in or attached to this communication are indicative and subject to change without notice.
Classic Liquidity Trap on TRX -TRXUSDT-4HPrice hunted buy-side liquidity with a sharp fakeout move, trapping breakout traders.
After breaking structure (BOS) and forming internal liquidity, the short setup was confirmed.
Entry placed on the mitigation of the order block with clear risk defined above the fakeout.
Targeting sell-side liquidity for maximum R:R. Clean and calculated.

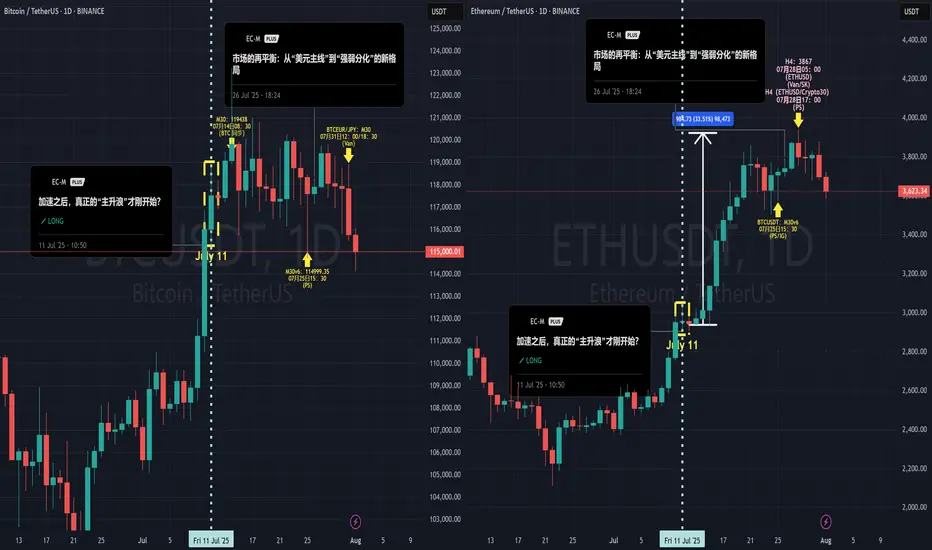
The Curtain Falls on the Script: Why I Believe It's Time to StopHello everyone, this is EC.
From late June through July, we experienced a full-fledged primary uptrend in crypto, driven by a weakening U.S. Dollar. From the script preview to the execution of the plan, every step has been clearly documented.
However, today, I want to share a different, more cautious perspective: I believe this script may be nearing its end.
I. Reviewing the Script and the "Bubble's" Manifestation
After our call on July 4th that the "main bull wave" was starting, the market perfectly delivered on our expectations. What was more interesting was the clear internal divergence we saw, which precisely confirms our thesis about the "bubble phase" from my June 20th article, "The Restlessness Before the Storm."
When the market's sentiment "balloon" is inflated to its limit, capital flows from the leader (BTC) to assets with higher elasticity (ETH).
The data shows that from July 11th until now, ETH took the baton and rallied approximately 35%, while BTC gained only around 6% in the same period. When BTC is already showing signs of fatigue while ETH is still in a solo rally, that in itself is a major signal that the bubble is nearing its end.
II. A Shift in the Winds: The Hand Inflating the Balloon is Loosening
I've chosen to end this script at this moment based on signal changes on two levels:
The "External Factor" Shift: The Potential Strengthening of the USD
As I pointed out in my July 28th analysis, "The Market's Rebalancing," the market has entered a phase of "strength-weakness divergence." This trend is now becoming more evident: the U.S. Dollar, cushioned by the extreme weakness of currencies like the Japanese Yen, has begun to show signs of a broad strengthening. Concurrently, U.S. and European stock markets are pulling back in sync, and global risk appetite is cooling.
The external environment that fueled the bubble (a weak USD) is beginning to falter.
The "Internal Factor" Signal: The Needle Point Inside the Balloon
The crypto market itself is also showing warning signs of resistance (see attached ETH daily chart). When the leading asset, ETH, begins to show signs of stagnation and distribution at its highs, it's like the balloon meeting the needle point. The exhaustion of internal momentum is a more direct warning than changes in the external environment.
III. Conclusion: Don't Be Greedy for the Last Dessert
When the core logic driving the rally (a weak USD) begins to waver, and the market simultaneously shows internal signs of exhaustion, my choice is to end this script and take profits off the table.
This doesn't mean I think crypto will crash immediately. But "no longer suitable to hold" implies that, in my view, the risk/reward ratio at the current level is no longer attractive. A grand feast is coming to an end, and being greedy for the last dessert is not a wise move. Shifting from "buying the dip" to "cautious observation" is the rational choice.
Thank you for your attention and for following along this past month.
#Crypto #BTC #ETH #TradingView #MarketAnalysis #RiskManagement
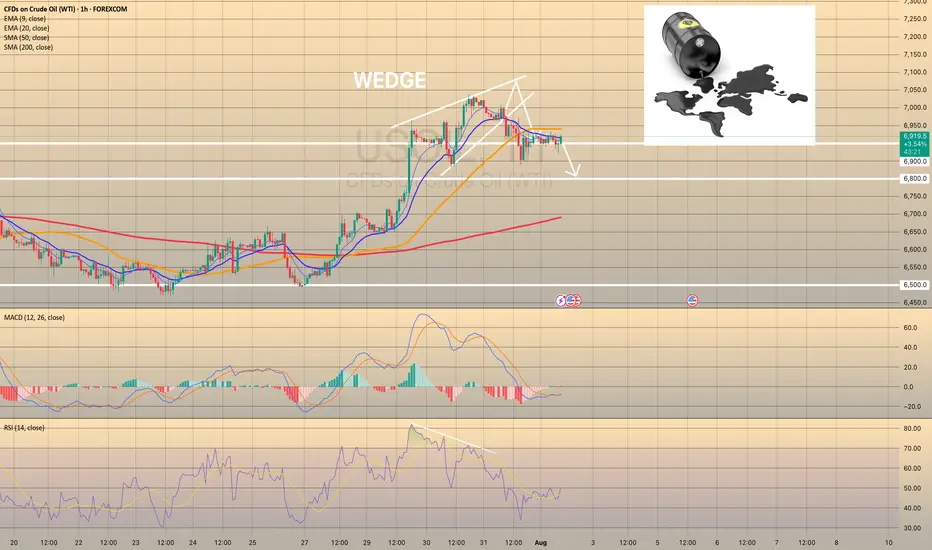
USOIL REACHED THE 6,900.00 SUPPORT LEVEL. WHAT'S NEXT?USOIL REACHED THE 6,900.00 SUPPORT LEVEL. WHAT'S NEXT?
As we told July 31, the price got reversed towards first support level of 6,900.00. Market participants are waiting for the OPEC+ meeting this week, expecting a significant output hike. Currently, the price sits slightly above the support level. Although, the asset trades above this level, considering the current weakness of the asset, further decline is expected. The 6,800.00 support level is the next target here.
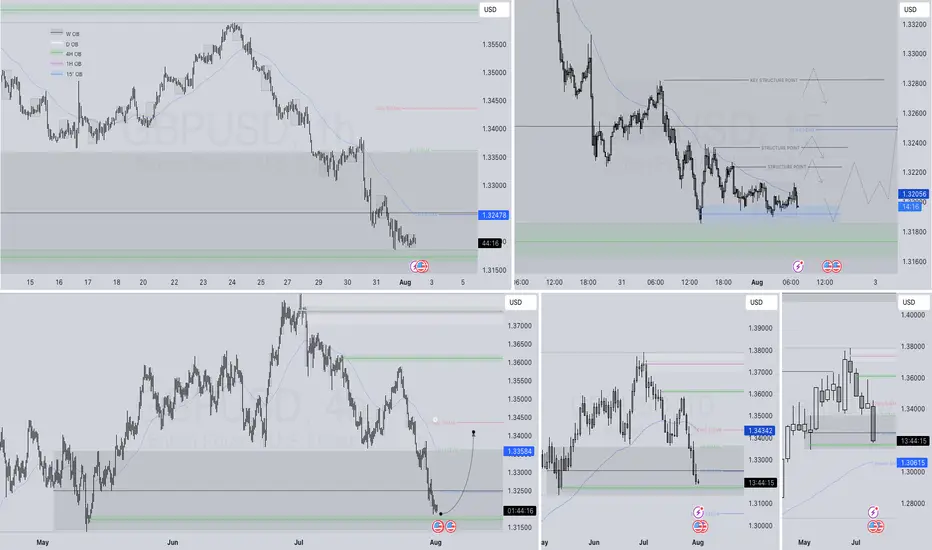
GBPUSD – DAILY FORECAST Q3 | W31 | D1 | Y25📊 GBPUSD – DAILY FORECAST
Q3 | W31 | D1 | Y25
Daily Forecast 🔍📅
Here’s a short diagnosis of the current chart setup 🧠📈
Higher time frame order blocks have been identified — these are our patient points of interest 🎯🧭.
It’s crucial to wait for a confirmed break of structure 🧱✅ before forming a directional bias.
This keeps us disciplined and aligned with what price action is truly telling us.
📈 Risk Management Protocols
🔑 Core principles:
Max 1% risk per trade
Only execute at pre-identified levels
Use alerts, not emotion
Stick to your RR plan — minimum 1:2
🧠 You’re not paid for how many trades you take, you’re paid for how well you manage risk.
🧠 Weekly FRGNT Insight
"Trade what the market gives, not what your ego wants."
Stay mechanical. Stay focused. Let the probabilities work.
FX:GBPUSD
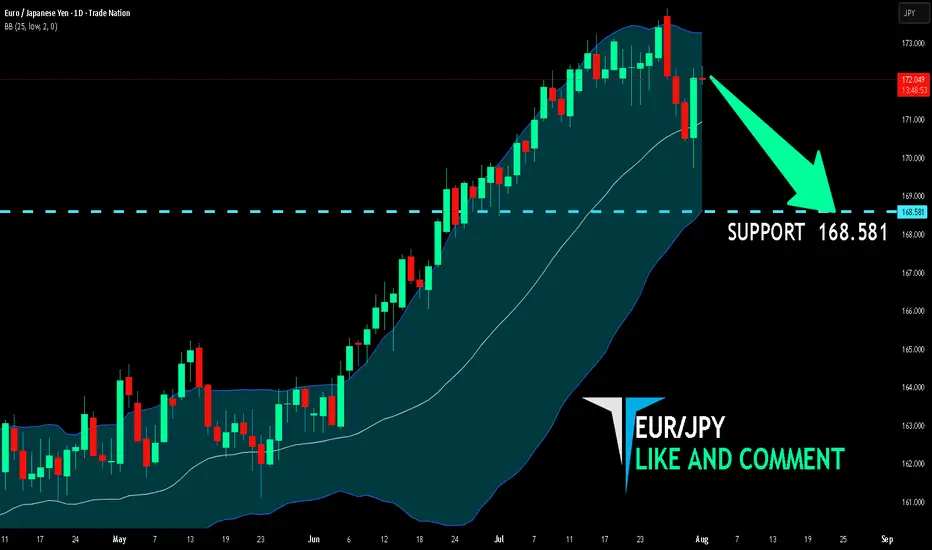
EUR/JPY BEARISH BIAS RIGHT NOW| SHORT
Hello, Friends!
We are now examining the EUR/JPY pair and we can see that the pair is going up locally while also being in a uptrend on the 1W TF. But there is also a powerful signal from the BB upper band being nearby, indicating that the pair is overbought so we can go short from the resistance line above and a target at 168.581 level.
Disclosure: I am part of Trade Nation's Influencer program and receive a monthly fee for using their TradingView charts in my analysis.
✅LIKE AND COMMENT MY IDEAS✅
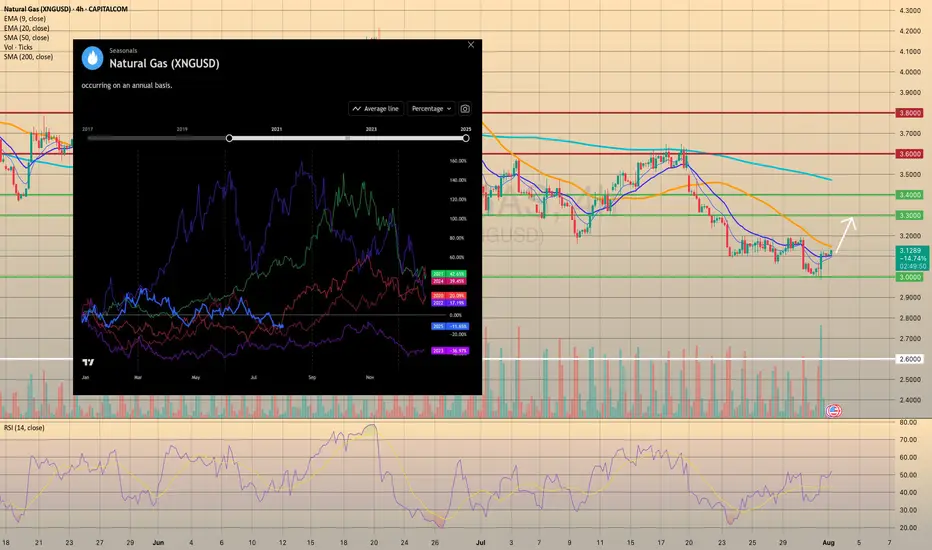
U.S. NATURAL GAS SUCCESSFULLY REBOUNDED FROM FIRM SUPPORT.U.S. NATURAL GAS SUCCESSFULLY REBOUNDED FROM FIRM SUPPORT.
Yesterday the natural gas storage report came out higher than expected. U.S. natural gas inventories increased by 48 billion cubic feet last week to 3,123 Bcf, increasing the surplus over the five-year average to 195 Bcf from 171 Bcf the week before, the EIA reports. The storage increase was bigger than the 24 Bcf average for the week, and above the 36 Bcf estimate. However, the price rised on 2.35% afterwards, supported by increased volume, which indicates the strength of the level. The upward movement towards the 3.3000 level is highly expected.
Additionally, seasonals suggest us that current prices may become the lowest till the end of the year. Historically, since August the natural gas prices increase in anticipation of a new heating season and higher energy demand (pic2).
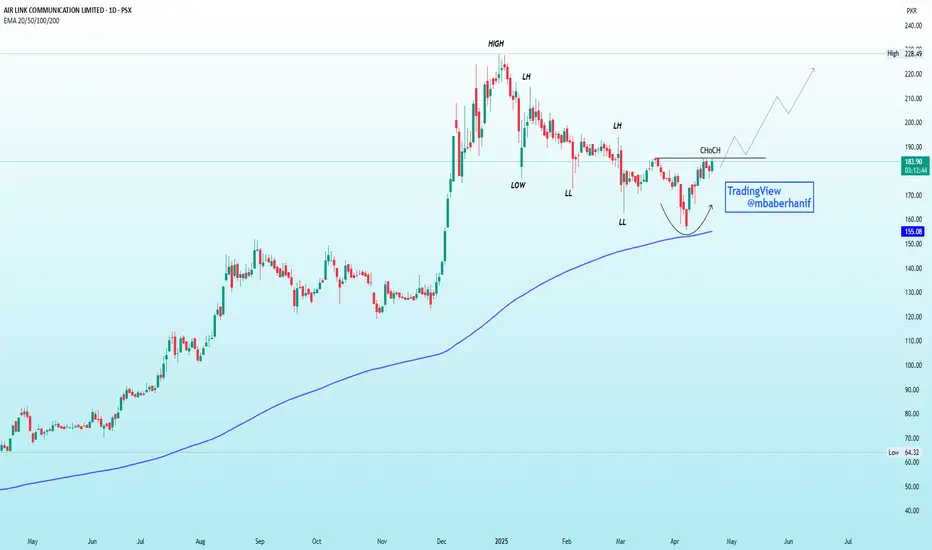
AIRLINK | An Imminent Reversal!!!Previous Trend: Bearish, confirmed by Lower Highs (LH) and Lower Lows (LL).
CHoCH (Change of Character): Bullish signal—price broke previous LH.
Pattern: Rounded bottom forming near the 200 EMA (~155), acting as strong support.
Volume: Slight pickup near bottom—early sign of accumulation.
Outlook: Bullish reversal likely. Break above CHoCH with volume confirms uptrend.
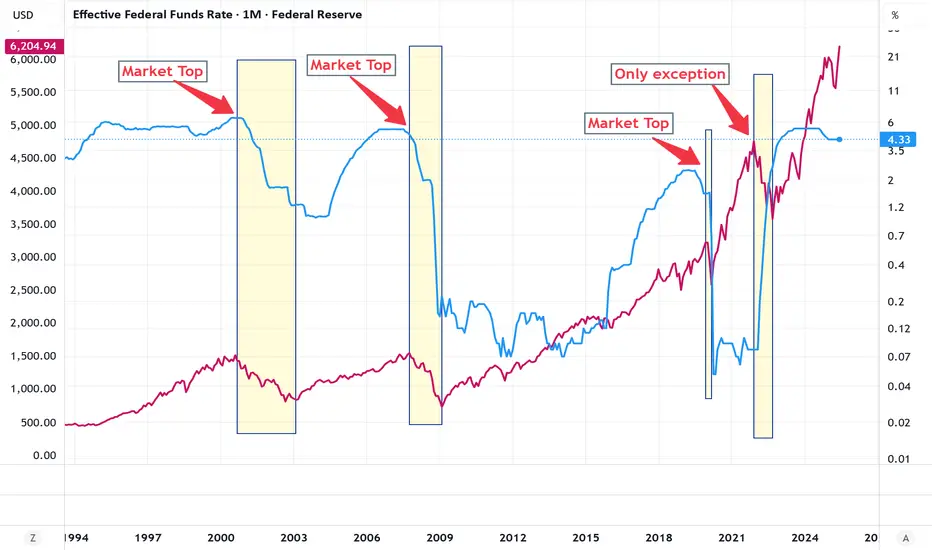
When the Fed cuts rates, it's bad news for Markets SPXIn 2000, 2007 and 2020, the markets crashed when the Fed started cutting rates or 1-2 months after.
Sell your stocks and crypto close to the time the Fed starts cutting rates.
History will repeat.
ATAI Bulls break to weekly higher highsNASDAQ:ATAI Bulls break to weekly higher highs, making 3.06 Monday's low now THE most important support level going forward.
Support: 4.04, 3.66, 3.61
Resistance: 4.29, 4.52
