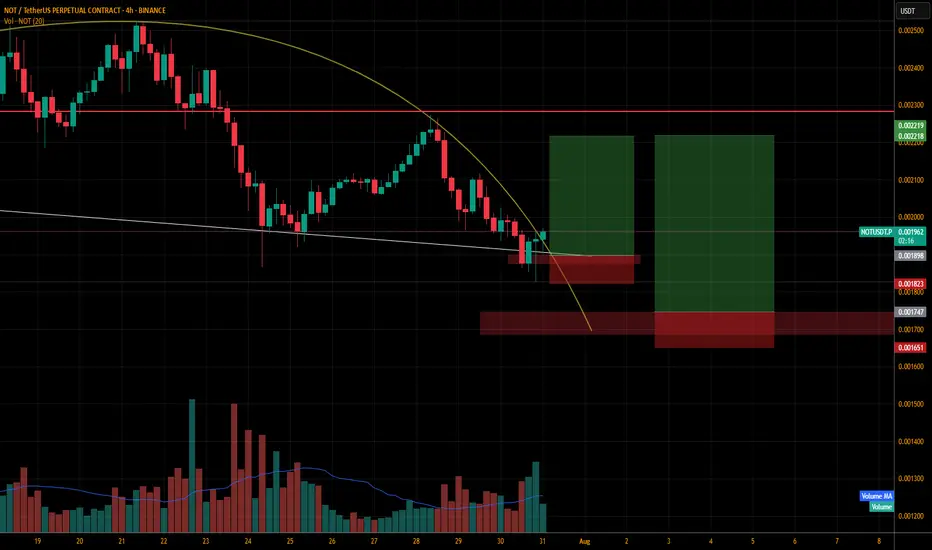
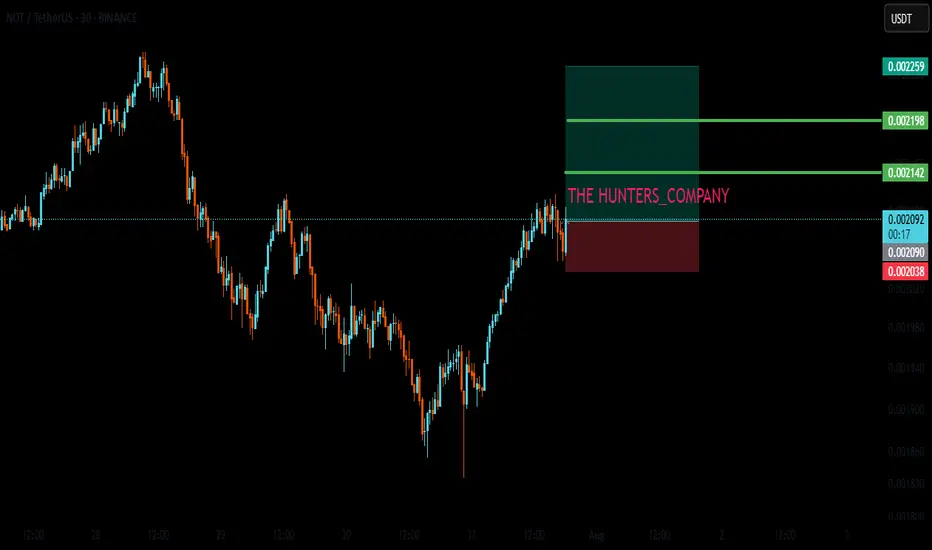
NOTUSDT.P LONGThe price is breaking the curve line and most of the time when we break the curve with bullish candles we get the demand sooner and without retesting.
Lets see how it plays. I dont think so the market will go till my second entry point lets wait and watch what price do and how the 4hr candle closes.
Follow me and support me please.
Chart Patterns
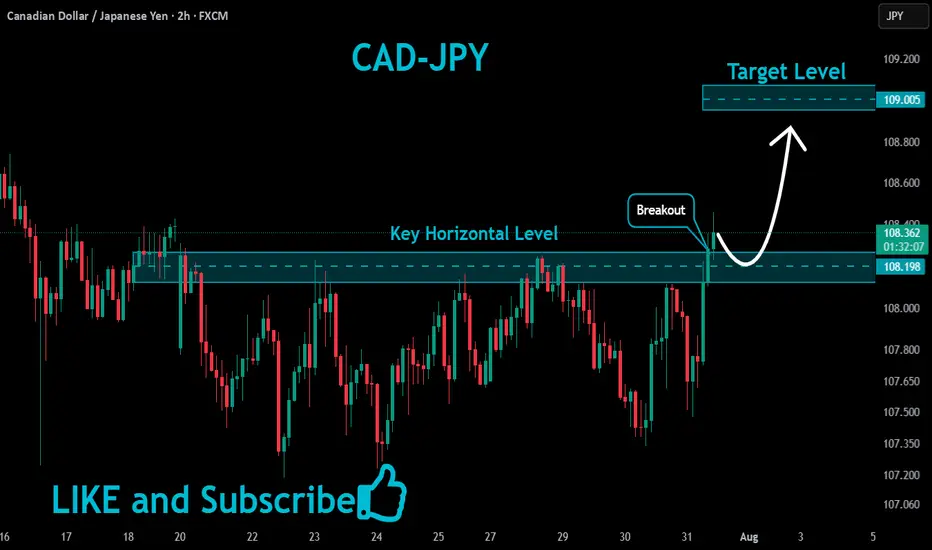
CADJPY Will Keep Growing!
HI,Traders !
#CADJPY keep growing and
The pair made a bullish breakout
Of the key horizontal level
Of 108.198 and the pair is
Already retesting the new
Support and we will be
Expecting a further
Bullish move uP !
Comment and subscribe to help us grow !
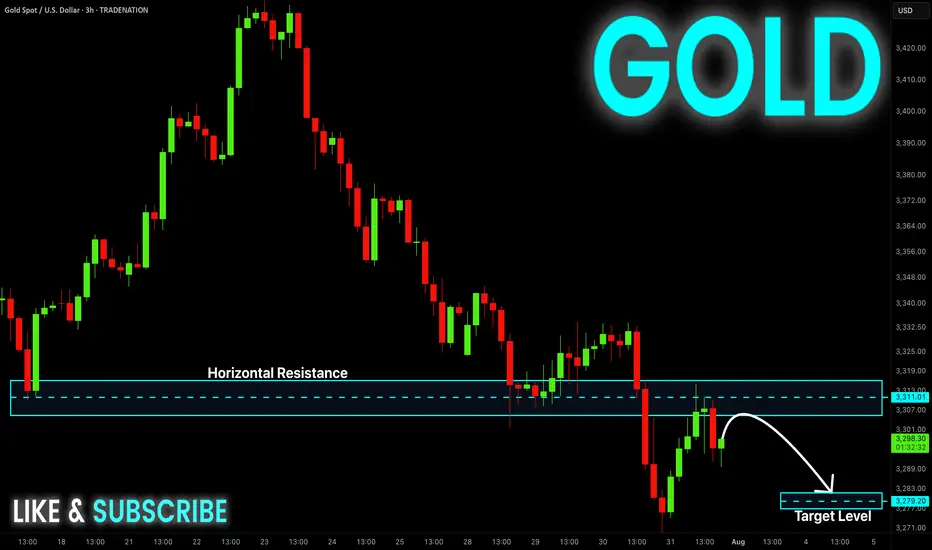
GOLD Local Short! Sell!
Hello,Traders!
GOLD made a retest
Of the horizontal resistance
Of 3313$ and we are already
Seeing a bearish reaction and
We will be expecting a further
Bearish move down
Sell!
Comment and subscribe to help us grow!
Check out other forecasts below too!
Disclosure: I am part of Trade Nation's Influencer program and receive a monthly fee for using their TradingView charts in my analysis.
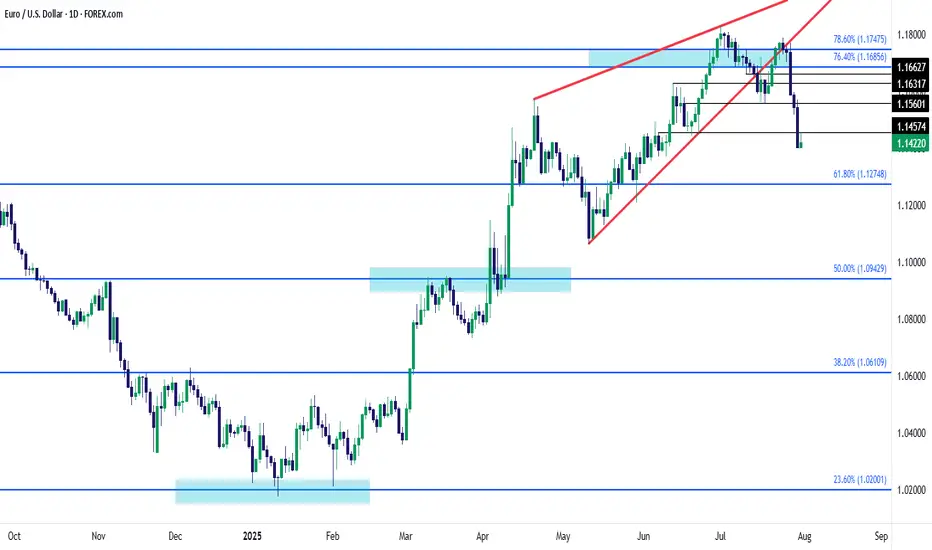
EUR/USD Rising Wedge Break Now Oversold on H4Markets have moved quickly this week and it's been a very bearish outlay for EUR/USD since last Thursday's ECB rate decision. The pair set a lower-high around that announcement and then the day after saw bears make another push, with a key hold at a Fibonacci level plotted at 1.1748. I've been highlighting that level since before the Q3 open and so far, that's the spot that bulls have failed to leave behind.
The quandary now is just how quickly this move has come on. The USD is working on its strongest month since April of 2022 and that prior instance was driven by the Fed starting a rate hike cycle, which clearly isn't happening here. Also complicating the matter is the fact that RSI on the four-hour chart has already pushed into oversold territory, making the prospect of chasing-lower a daunting item.
We've already seen an instance of prior support coming in as resistance with the hold of the daily high at 1.1457. With NFP tomorrow, perhaps the more attractive scenario would be a larger pullback which could then highlight resistance potential at either 1.1500 or 1.1560. - js
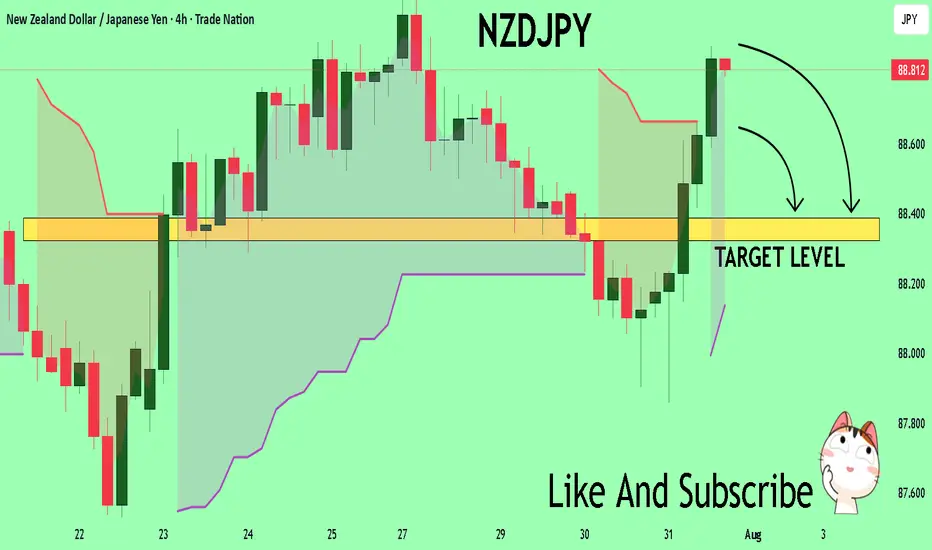
NZDJPY The Target Is DOWN! SELL!
My dear friends,
Please, find my technical outlook for NZDJPY below:
The price is coiling around a solid key level - 88.806
Bias - Bearish
Technical Indicators: Pivot Points Low anticipates a potential price reversal.
Super trend shows a clear sell, giving a perfect indicators' convergence.
Goal - 88.388
About Used Indicators:
The pivot point itself is simply the average of the high, low and closing prices from the previous trading day.
Disclosure: I am part of Trade Nation's Influencer program and receive a monthly fee for using their TradingView charts in my analysis.
———————————
WISH YOU ALL LUCK
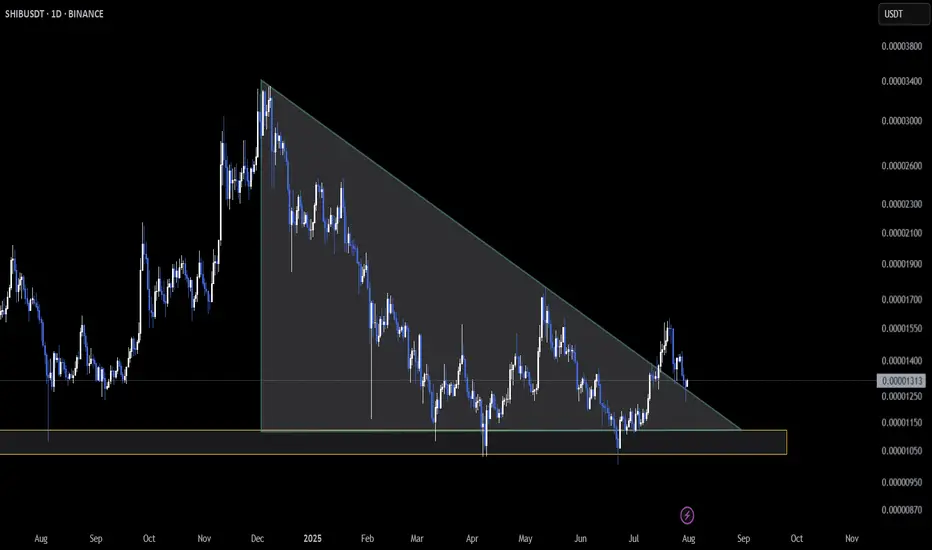
SHIB Retests Triangle Support as Pressure Mounts🔥 CRYPTOCAP:SHIB is locked into a key zone on the daily chart — price is retesting the base of a descending triangle structure 🛡️
So far, support is holding, but the range is tightening. A strong bounce here could kick off a recovery move 📈
⚠️ On the flip side, a breakdown would confirm bearish continuation and shift momentum to the downside.
👀 This is a must-watch level — clean structure, high stakes.
Do you see SHIB bouncing from here or breaking below?
Not financial advice.
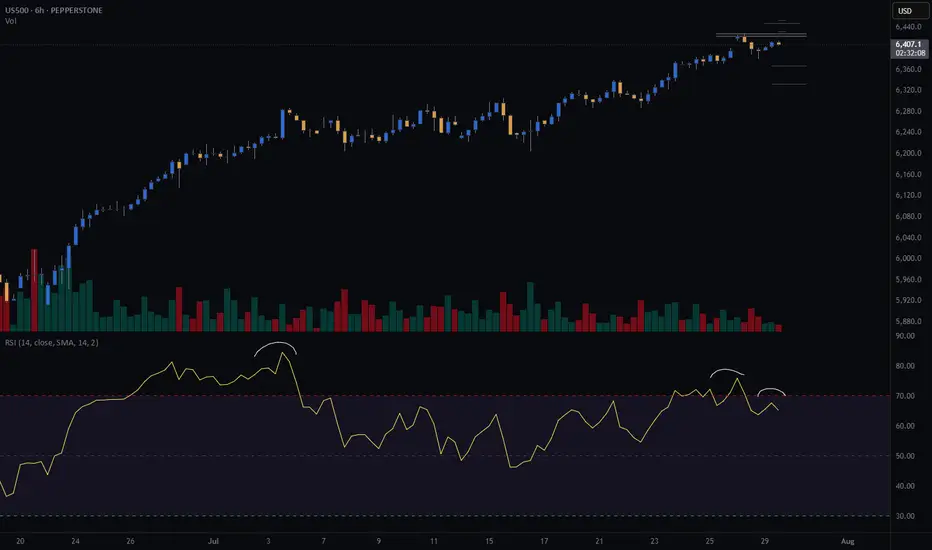
S&P500 (CASH500) SHORT - Double top H6Risk/reward = 3.7
Entry price = 6432.6
Stop loss price = 6 454.1
Take profit level 1 (50%) = 6367.7
Take profit level 2 (50%) = 6332.6
Still need confirmation from some variables before entering the trade
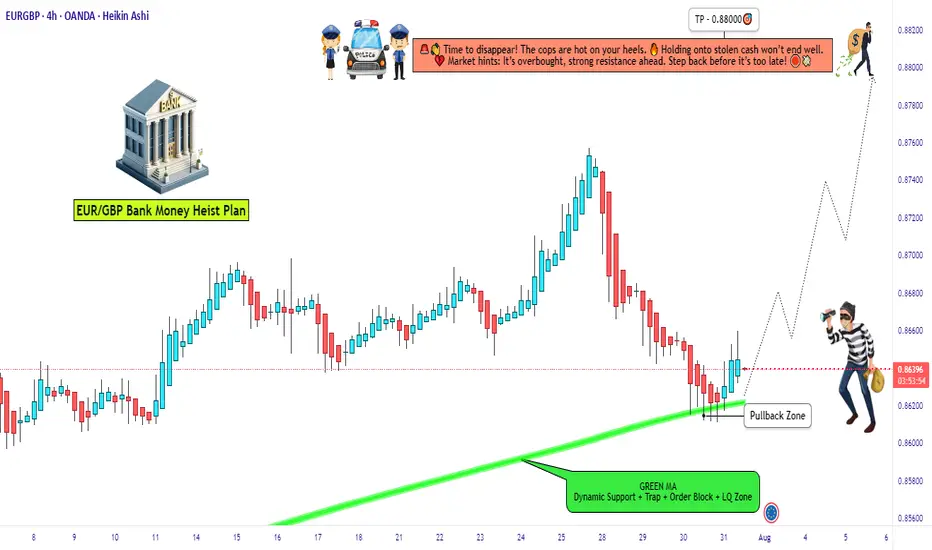
EUR/GBP Thief Trade: Swipe Profits Before Overbought Trap!🦹♂️ EUR/GBP "THE CHUNNEL HEIST" – BULLISH LOOT IN PROGRESS! 🚨💰
(Thief Trading Strategy – Escape Before the Cops Arrive!)
🎯 DEAR MARKET PIRATES & PROFIT SNATCHERS,
Based on our 🔥Thief Trading Style Analysis🔥, we’re executing a bullish heist on EUR/GBP ("The Chunnel"). The vault is wide open—time to swipe the loot before the high-risk resistance police barricade (aka overbought trap) shuts us down!
📜 THE MASTER PLAN:
✔ Entry (📈): "The Bullish Vault is Unlocked!"
Buy Limit Orders (15-30min TF) near recent swing lows/highs.
Thief’s DCA Trick: Layer entries like a pro robber—multiple limit orders for max loot.
✔ Stop Loss (🛑): "Hide Your Stash Wisely!"
SL at nearest 4H candle wick (0.86000)—adjust based on your risk appetite & lot size.
Remember: A good thief always has an escape route!
✔ Target (🎯): 0.88000 (or escape earlier if the cops get suspicious!)
🔎 SCALPERS & SWING BANDITS – LISTEN UP!
Scalpers: Stick to LONG-ONLY heists! Use trailing SL to protect profits.
Swing Thieves: If you’re low on cash, join the slow robbery—DCA & hold!
📡 WHY THIS HEIST IS HOT:
Bullish momentum in play (but BEWARE of overbought traps!).
Fundamental Drivers: Check COT Reports, Macro Data, & Sentiment.
🚨 TRADING ALERT: NEWS = POLICE RAID RISK!
Avoid new trades during high-impact news.
Trailing SL = Your Getaway Car! Lock profits before volatility strikes.
💥 BOOST THIS HEIST – STRENGTHEN THE GANG!
👉 Smash the LIKE & BOOST button to fuel our next market robbery!
👉 Follow for more heists—profit awaits! 🚀💰
🦹♂️ Stay Sharp, Stay Ruthless… See You on the Next Heist!
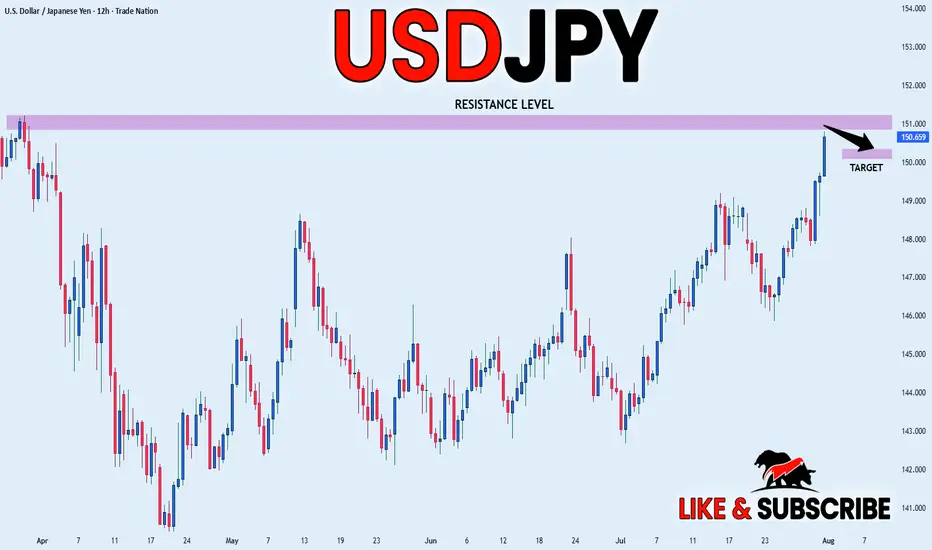
USD_JPY RESISTANCE AHEAD|SHORT|
✅USD_JPY is going up now
But a strong resistance level is ahead at 151.232
Thus I am expecting a pullback
And a move down towards the target of 150.368
SHORT🔥
✅Like and subscribe to never miss a new idea!✅
Disclosure: I am part of Trade Nation's Influencer program and receive a monthly fee for using their TradingView charts in my analysis.
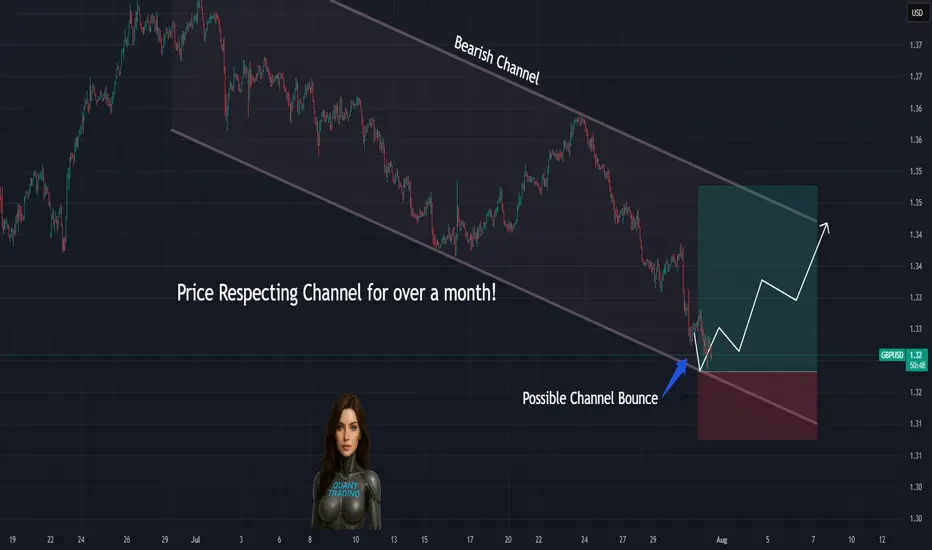
Price Doing Exactly What We Predicted… so farGBPUSD tapped the exact bottom of our marked channel and bounced — just as forecasted.
📌 Price respected structure to the pip
📌 Stoch RSI curling up right as expected
📌 Channel still in play, eyes on midline next
⏱️ Timeframe: 1H
#gbpusd #forex #chartprediction #backtest #channeltrading #technicalanalysis #tradingview
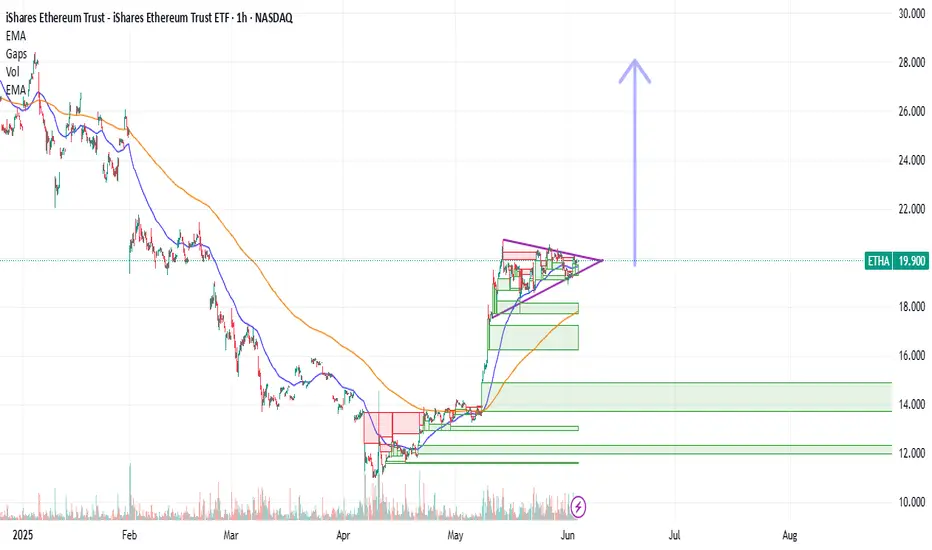
Ethereum Rally (?) : Strong Infusion with Volume RequiredEthereum can make a very strong rally of at least 35-40 percent.
And so the same goes for the Ishares Ethereum Trust ETF. (ETHA ETF)
But it needs to break the pennant.
And we need to observe strong volume.
Also, if we stay above the 50 and 200 period moving averages while this is happening, good things can happen.
Still, I am neutral until we break the pennant.
$90 in next 6-12 months?I am buying this dip and expected it to hit 90 in 6-12 months based on tech analysis. All the best. Not a financial advise.

GBPUSD slipping fast – Is 1.30 the next magnet?Hey traders, what’s your take on GBPUSD today?
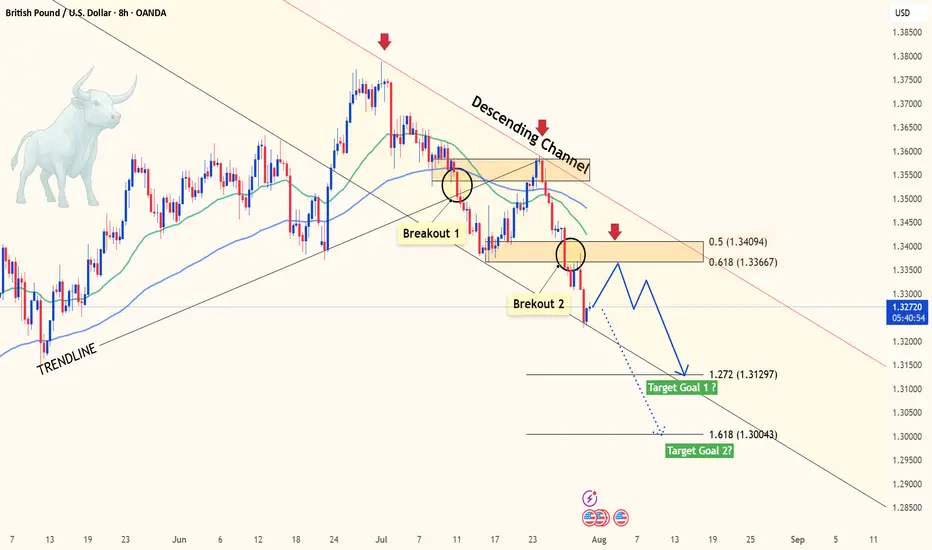
Overall, the pair is deepening its bearish trend after losing the key 1.3400 level. At the time of writing, GBPUSD is hovering around 1.3272 with no signs of a short-term bottom in sight.
The main catalyst for this drop is the strong bullish momentum of the U.S. dollar. A series of upbeat U.S. economic data – including jobs reports, personal consumption expenditures (PCE), and consumer confidence – all exceeded expectations, fueling USD strength. Meanwhile, the Bank of England (BoE) remains cautious amid slowing growth and cooling inflation, offering little support for the pound.
From a technical perspective, momentum has clearly shifted in favor of the bears. Price remains pressured below both the 34 and 89 EMAs, confirming strong downside momentum. The previous break below the rising trendline and failure to hold above the prior support zone – around the 0.5–0.618 Fibonacci retracement – further supports the ongoing bearish bias.
Looking ahead, if the selling pressure continues and the current support gives way, GBPUSD could fall toward the 1.272 Fibonacci extension at 1.3129. If that level fails to hold, 1.3004 (Fibo 1.618) becomes the next key downside target. These are crucial zones to monitor for potential price reactions in the coming sessions.
In short, the probability of further downside is higher than a meaningful recovery. With both technical and macro forces favoring the bears, GBPUSD may remain under pressure in the days ahead – unless a strong catalyst from the UK emerges to shift sentiment. What’s your outlook on this scenario? Let’s discuss in the comments below!
EURGBP Steps Into A Correction Within Ongoing RecoveryEURGBP is sharply down after reaching April highs for wave »v« of an impulse into wave A. As expected, the pair is now unfolding a three-wave abc corrective setback within higher-degree wave B. Currently, EURGBP is breaking below the channel support line in a sharp and impulsive projected wave »a«. A corrective recovery in wave »b« may follow, considering that RSI is already at the lower side of its range. Overall, we are still tracking this correction toward the 0.85x support area, which could act as a base before a potential bullish continuation higher into wave C.

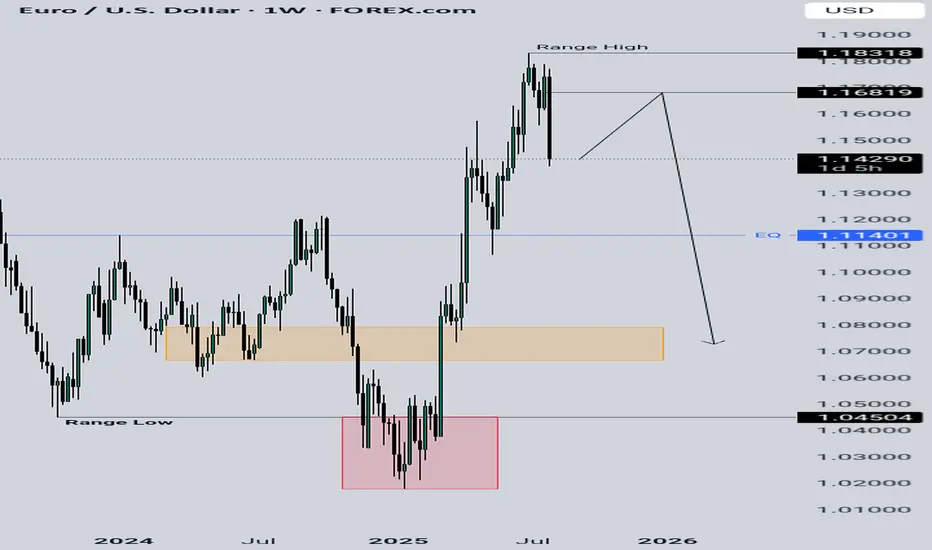
Bears on EURO My tools are suggesting a Bearish tone on the EURO in the coming weeks although we have to have a slight retracement higher into the outlined level then head on lower
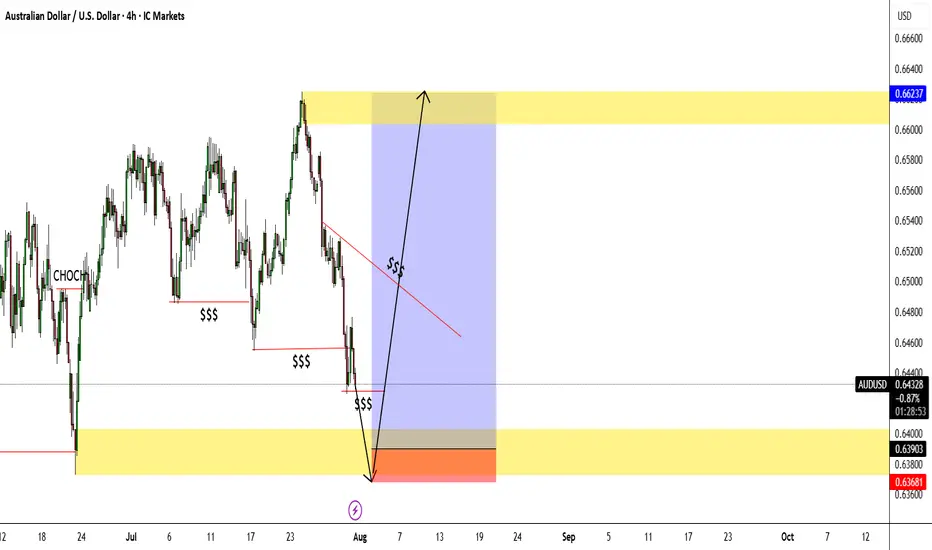
AUDUSD longs!!!Hello everyone
My bias towards AUDUSD is looking bullish and these are my reasons on why.
1. Price started to consolidate between 14/05/25 to 23/06/25 which caused price to take out EQL'S and create a CHOCH to the upside.
2. Price has than created many more consolidation patterns followed by EQL's raids as well.
3. I am hoping price will return back to my 4hr demand zone to go long again.
Looking for either market entry or buy limit not sure yet will find out as time goes by.
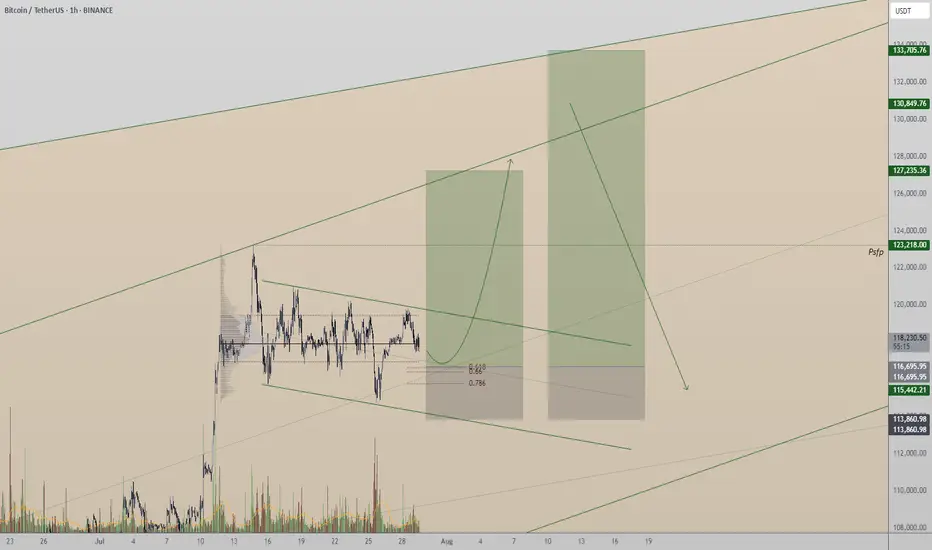
Bitcoin:Can Support at Point of Control Fuel a Move to New High?Bitcoin is currently consolidating at its local point of control, facing immediate resistance from a Fibonacci-aligned value area low. A critical reversal from here could pave the way to new all-time highs.
Bitcoin has entered a pivotal phase, trading at a key technical region that could determine its short-term direction. Over the past week, price action has hovered around the local point of control, showing signs of absorption and consolidation. With immediate resistance looming at a major confluence level, the next few daily candles may set the stage for either a breakout or a deeper retracement.
Key Technical Points:
- Local Point of Control: Bitcoin is ranging around this level, showing indecision
- Value Area Low + 0.618 Fib: Immediate resistance forms strong technical confluence
- Swing Low Critical: A break below the last swing low would invalidate bullish structure
Bitcoin’s current position around the local point of control reflects a phase of market equilibrium. This level represents the area of highest traded volume over the recent range, acting as both support and resistance at different times. The fact that price has revisited and hovered here for multiple days suggests active positioning from both bulls and bears.
Just above lies the value area low, which is in direct confluence with the 0.618 Fibonacci retracement from the recent swing high to swing low. This dual-layered resistance is significant — if Bitcoin is able to break above and reclaim this zone, it could unlock the next leg higher.
However, traders must remain cautious. The most recent swing low, formed during the last pullback, now acts as the final line of defense for bulls. A loss of this low would shift market structure to bearish and potentially initiate a correction deeper into the prior range.
So far, the lack of high-volume breakdowns suggests sellers have not yet gained control. But without a decisive bounce and follow-through above resistance, the risk of a failed reversal increases.
What to Expect in the Coming Price Action:
If Bitcoin holds above the point of control and mounts a successful challenge of the value area low, a rotation toward a new all-time high becomes increasingly likely. However, failure to defend the swing low would invalidate the setup and favor further downside. All eyes remain on the current consolidation for clues on the next major move.
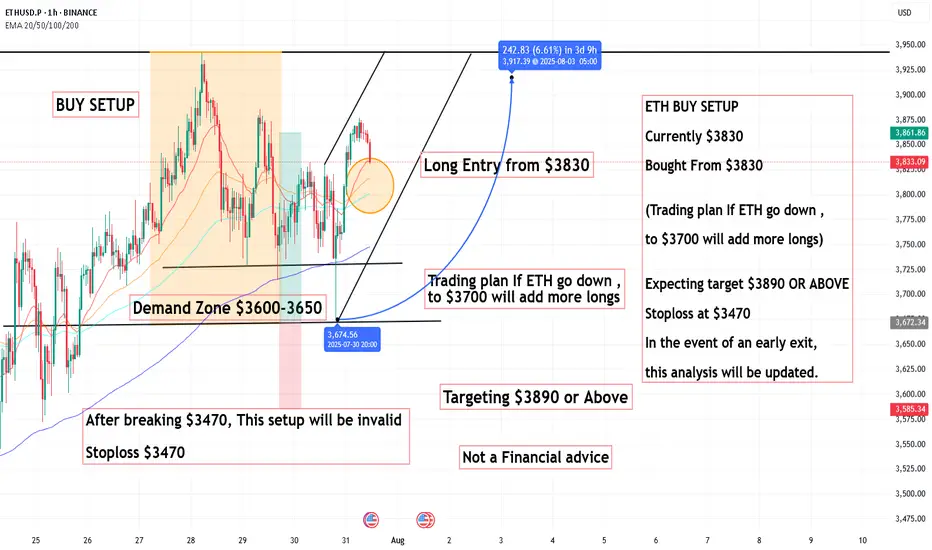
ETH BUY SETUP ,Bought From $3830ETH BUY SETUP
Currently $3830
Bought From $3830
(Trading plan If ETH go down ,
to $3700 will add more longs)
Expecting target $3890 OR ABOVE
Stoploss at $3470
In the event of an early exit,
this analysis will be updated.
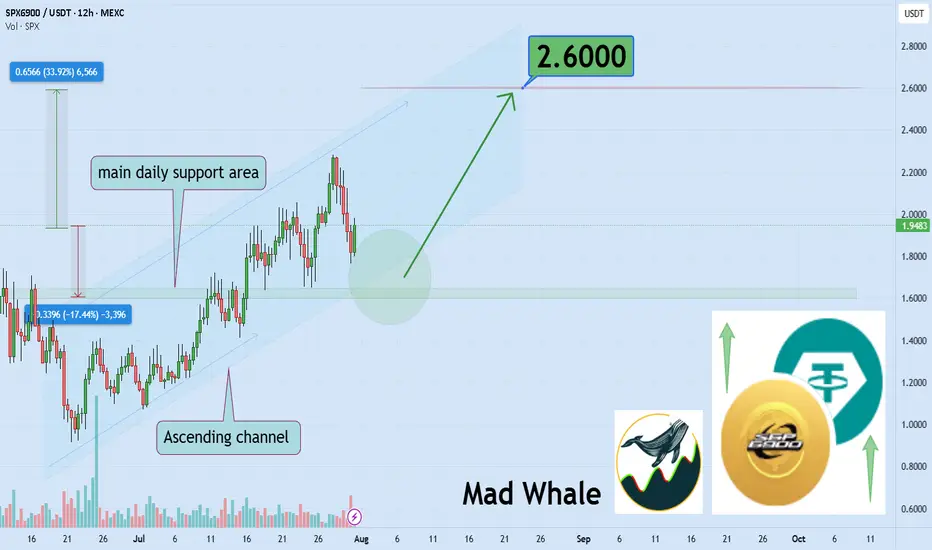
SPX6900 Bulls Eyeing 33% Surge Toward Explosive $2.60 TargetHello✌
Let’s analyze SPX6900’s upcoming price potential 📈.
MEXC:SPXUSDT has maintained strong bullish momentum in recent weeks, supported by a stream of positive fundamentals 📈. The price is currently holding within an ascending channel and resting near daily support. If this level holds, a 33% upside toward the $2.60 target could follow 🚀
✨We put love into every post!
Your support inspires us 💛 Drop a comment we’d love to hear from you! Thanks , Mad Whale
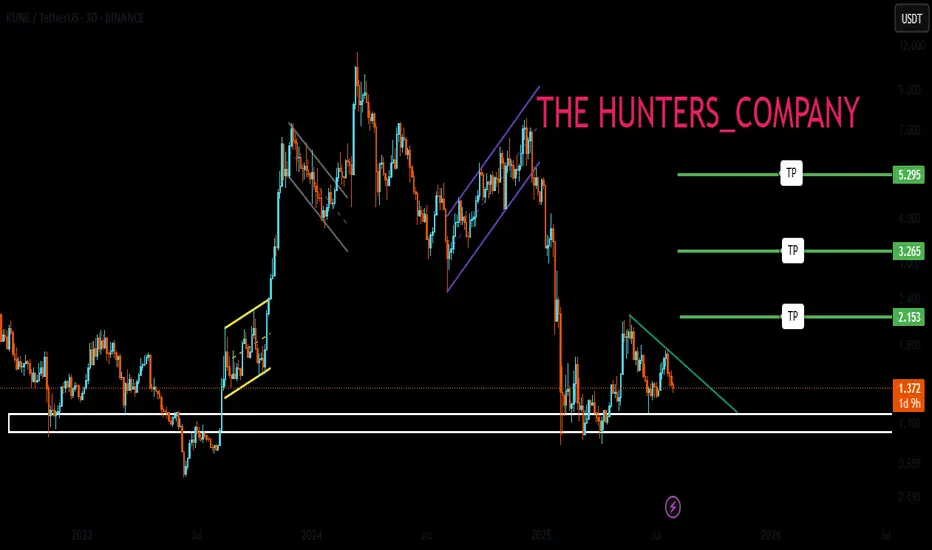
RUNE : Ready to pump?Hello friends🙌
👀According to the price drop, you can see that the price has reached an important area, which, according to the pattern formed, if the specified resistance is broken, we can enter with risk and capital management and move to the specified targets.
🔥Follow us for more signals🔥
*Trade safely with us*
Decentraland: Where Are the Bulls?Decentraland’s MANA has recently struggled to sustain the upward momentum of wave iii in orange. Nonetheless, our primary scenario remains that this move should eventually push the altcoin above the $0.40 resistance level. Overall, we anticipate the full five-wave orange sequence could extend beyond the next key threshold at $0.85 before the larger blue wave (i) reaches its peak. Conversely, our 25% likely alternative scenario still allows for a new wave corrective low below the $0.19 support.
📈 Over 190 precise analyses, clear entry points, and defined Target Zones - that's what we do (for more: look to the right).

LIVE TRADEHello friends🙌
Given the good trend we had, now that we have had a price correction, we can enter the trade with risk and capital management and move towards the specified goals.
🔥Follow us for more signals🔥
*Trade safely with us*
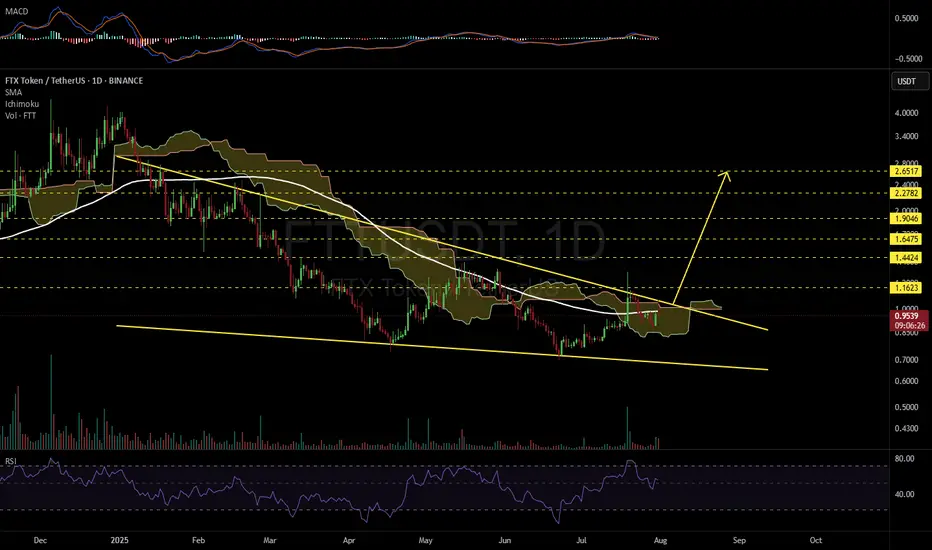
FTTUSDT 1D#FTT has formed a falling wedge pattern on the daily chart.
For a bullish scenario to play out, it must break above the resistance cluster, which includes the wedge resistance, the Ichimoku Cloud, and the daily SMA100, with strong volume.
If that happens, the potential targets are:
🎯 $1.1623
🎯 $1.4424
🎯 $1.6475
🎯 $1.9046
🎯 $2.2782
🎯 $2.6517
⚠️ As always, use a tight stop-loss and apply proper risk management.