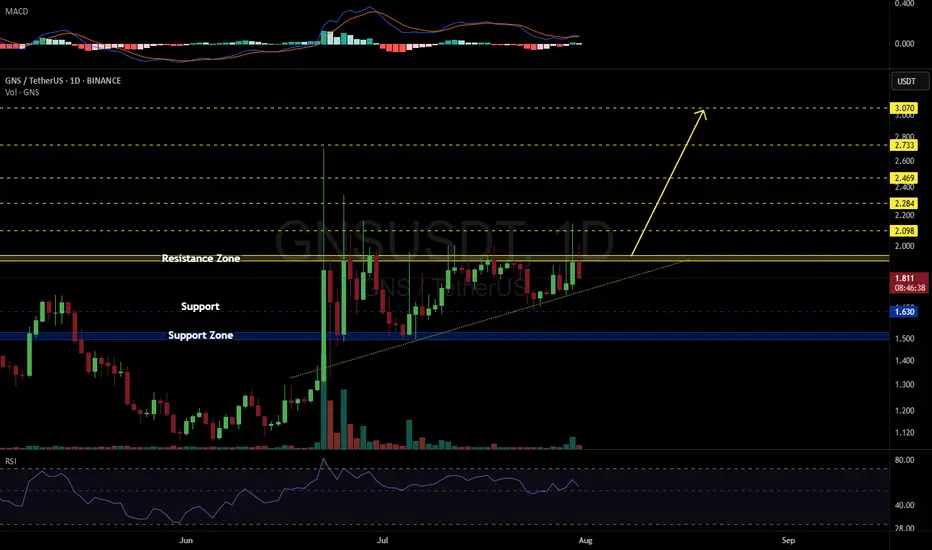
GNSUSDT 1D#GNS is consolidating just below a key resistance zone on the daily chart and has formed an ascending triangle pattern.
We plan to buy at the current level and again near the $1.630 support level or the support zone in case of a breakdown below the triangle.
If a breakout occurs above the resistance zone, the potential upside targets are:
🎯 $2.098
🎯 $2.284
🎯 $2.469
🎯 $2.733
🎯 $3.070
⚠️ As always, use a tight stop-loss and apply proper risk management.
Chart Patterns
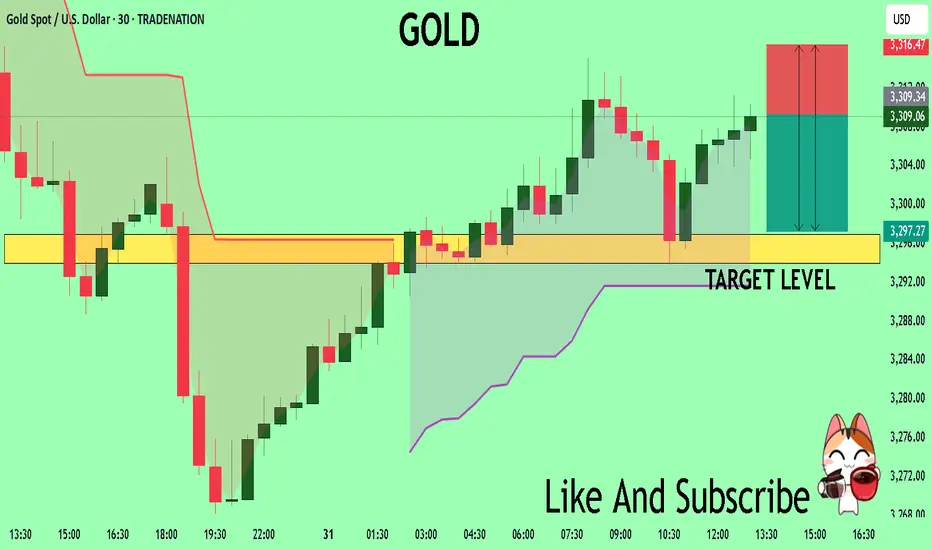
GOLD Buyers In Panic! SELL!
My dear friends,
Please, find my technical outlook for GOLD below:
The instrument tests an important psychological level 3309.2
Technical Indicators: Supper Trend gives a precise Bearish signal, while Pivot Point HL predicts price changes and potential reversals in the market.
Target - 3296.9
Recommended Stop Loss - 3316.4
About Used Indicators:
Super-trend indicator is more useful in trending markets where there are clear uptrends and downtrends in price.
Disclosure: I am part of Trade Nation's Influencer program and receive a monthly fee for using their TradingView charts in my analysis.
———————————
WISH YOU ALL LUCK
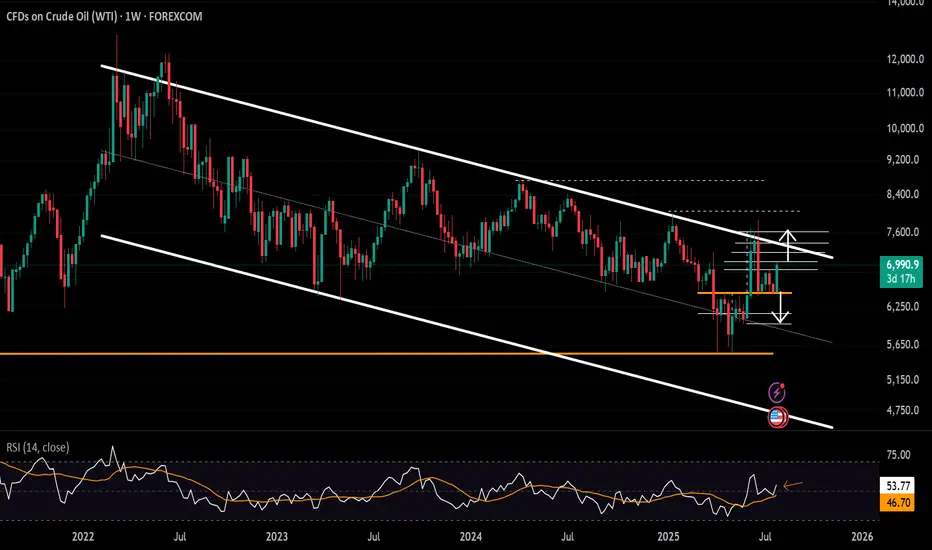
Crude Oil’s $70 Surge Still Faces 3-Year Channel ResistanceAlthough news points to a crude oil price surge, technical analysis indicates price cap risks remain within the borders of a 3-year descending channel.
Should a clear hold emerge above the $70 barrier, the bullish rebound in price action from the $64.40 zone, in line with the weekly RSI’s rebound off the neutral 50 zone, may extend toward the channel’s upper boundary at $72.40, $74.40, and $77 in more extreme scenarios.
A confirmed hold above the $77–78 zone may shift the primary trend away from bearish dominance and pave the way for longer-term bullish forecasts.
On the downside, if a price drop results in a clean break below the $64 barrier, downside risks may extend toward the mid-zone of the long-standing channel, with potential support levels at $63.20, $61.80, and $59.70, respectively.
Written by Razan Hilal, CMT
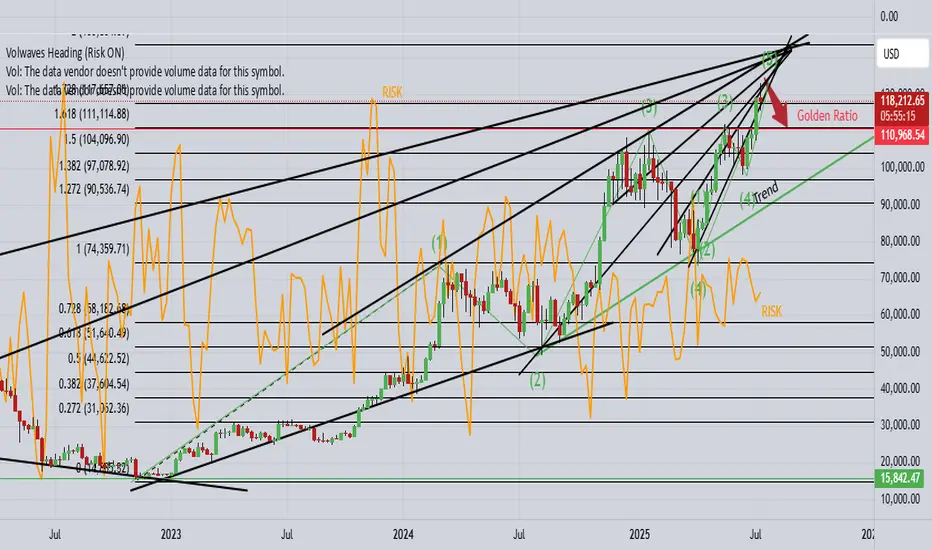
BTCUSD looking for corrective drop towards $111K!1). "Indecisive" weekly Doji retail candle! 2). Price rejection off higher times! 3). Risk indicator is heading south! 4). Trump said "BUY!" 5). There appears to be a cluster of "BUY" orders around $114$K as typically, price drops to trigger those orders!
Ethereum's futile attempt to go up.Ethereum’s pointless push and unnecessary insistence on going up — if it really wants to hit a new ATH, it needs to drop first, both to take a breather and to let buyers with lower buy orders get into the game.
Nasdaq Short: multiple reasonsOver here, I present to you the Nasdaq short idea again. For my previous idea, it was stopped out at 23500. This time, I changed the wave counts again, mainly merging the previous wave 5 into wave 3, allowing for the new high to be a wave 5.
On top of that, here are the few other reasons for the short:
1. Fibonacci extension levels: Wave 5 is slightly more than Wave 1.
2. RSI overbought for the 3rd time on the hourly timeframe.
3. Rising wedge false breakout.
4. Head-and-shoulders on the 1-min timeframe.
As usual, the stop for this idea is slightly above the recent high, around 23700.
Thank you.

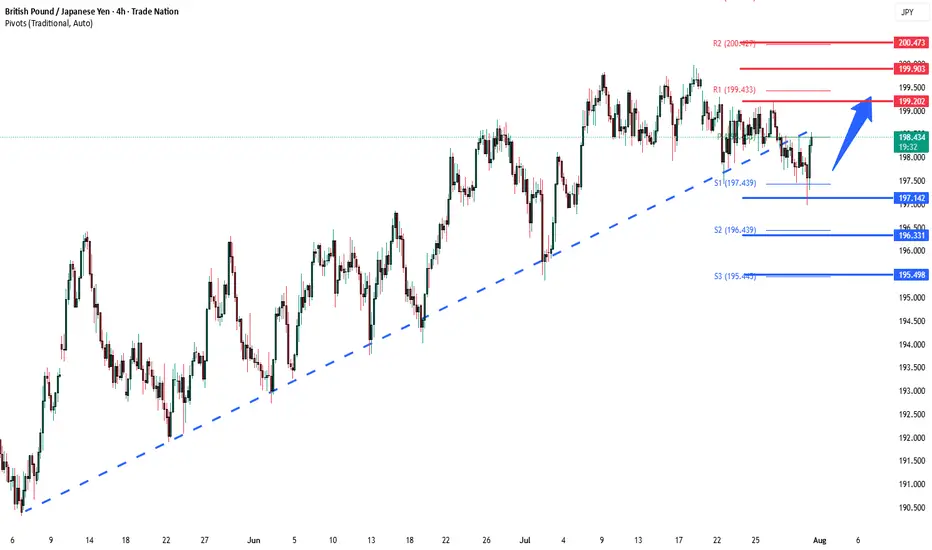
GBPJPY key support at 197.75Key Support: 196.75
This level marks the prior consolidation zone and serves as a critical pivot. A corrective pullback toward 196.75 followed by a bullish reversal would validate the uptrend, with upside targets at:
199.20 – Initial resistance and short-term target
199.70 – Minor resistance zone
200.40 – Longer-term breakout objective
However, a daily close below 196.75 would invalidate the bullish scenario, potentially triggering a deeper retracement toward:
195.80 – Near-term support
194.80 – Key downside level in a bearish reversal
Conclusion:
As long as 196.75 holds, the bias remains bullish, favoring continuation toward the 199–200 zone. A confirmed break below this support would shift momentum, opening the door for a broader corrective decline.
This communication is for informational purposes only and should not be viewed as any form of recommendation as to a particular course of action or as investment advice. It is not intended as an offer or solicitation for the purchase or sale of any financial instrument or as an official confirmation of any transaction. Opinions, estimates and assumptions expressed herein are made as of the date of this communication and are subject to change without notice. This communication has been prepared based upon information, including market prices, data and other information, believed to be reliable; however, Trade Nation does not warrant its completeness or accuracy. All market prices and market data contained in or attached to this communication are indicative and subject to change without notice.
Trailing Stops:Let trades developTrailing stops are one of the most underused tools in a trader’s playbook. Most traders spend hours obsessing over entries, but then wing the exit or bail too early the moment a red candle appears. That’s where trailing stops come in. They give your trades room to breathe, while gradually reducing risk as price moves in your favour.
If you’ve ever caught a good move and felt unsure about how long to hold it, this one’s for you.
Here are three practical ways to trail your stop, stay in the trade, and help manage profitable trades objectively.
1. Trail Behind Structure
This is the simplest and most intuitive method. As the trade moves in your favour, you move your stop just behind the most recent swing high or low. In a long trade, that means raising your stop to sit just below the latest higher low. In a short, you drop it just above the most recent lower high.
This approach works best in clean, trending conditions. It gives the trade room to develop naturally without forcing you to guess the top. You won’t capture the absolute high, but you’ll often stay in the move longer than most.
It also keeps you in rhythm with the market. If the structure is broken, it’s a pretty good sign that the trend is changing or stalling and that’s a logical place to step aside.
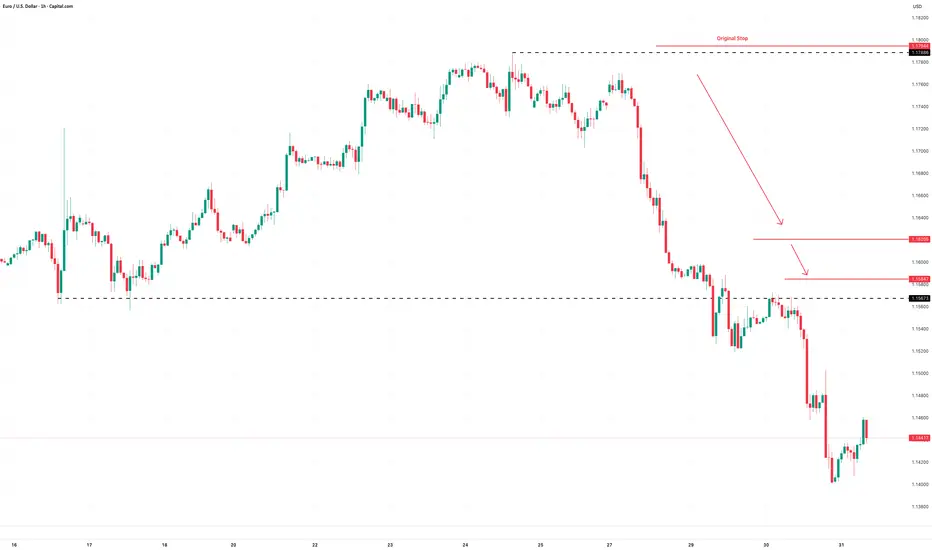
Example:
Here’s a clean example of using structure to trail stops on a momentum trade. The entry came on a break and retest of resistance, with the initial stop placed just below the retest level. As the trade moved higher, a series of higher swing lows developed, providing clear reference points to adjust the stop.
It’s not designed to catch the exact top and that’s fine. The goal is to follow price action with minimal lag, using objective structure rather than guesswork.
EUR/USD Hourly Candle Chart
Past performance is not a reliable indicator of future results
2. Use Moving Averages
Trailing stops don’t have to follow every single swing. Sometimes, a smoother option is better, especially if you want to stay in a move that’s trending hard. That’s where moving averages come in.
A short-term exponential moving average like the 9 or 21 EMA can act as a dynamic trailing stop. As long as price remains above the average, the trend is intact and you stay in. If price closes below the EMA in a long trade, or you get a crossover in the opposite direction, that can signal an exit or at least a scale-down.
This method works best in fast, directional markets. It won’t suit every condition, but when the move is strong, letting a trade run along the moving average keeps things simple and stress-free.
Example:
In this short-term 5-minute chart example, the 21 EMA acts as a dynamic trailing stop. There are two common approaches. You can wait for a candle to close below the 21 EMA, or use a crossover trigger where the 9 EMA crosses under the 21 EMA. The choice depends on how tightly you want to manage the trade and how much room you are willing to give it.
S&P 500 5min Candle Chart
Past performance is not a reliable indicator of future results
3. Volatility-Based Stops (ATR)
When the market gets fast and messy, a fixed stop can either get hit too easily or feel too far away. That’s where volatility-based stops come in. The most common tool for this is the Average True Range (ATR).
Instead of using swing points, you trail your stop a set number of ATRs behind the current price. If ATR is rising, your stop gives the trade more room. If volatility shrinks, the stop tightens naturally. It’s an adaptive approach that works well in conditions where price is expanding or moving fast.
A popular setting is to use two times the current ATR value, but you can adjust it to suit your timeframe or risk tolerance.
Example:
This is a classic wedge breakout setup in gold. A trailing stop set at two times the ATR helps manage risk while giving the trade enough room to breathe. As price moves in your favour, the stop tightens automatically based on volatility. It’s worth remembering that trailing stops are only adjusted in one direction. Once set, they follow the move but are never loosened, which means the stop will eventually take you out as momentum fades or the market turns.
Gold Daily Candle Chart
Past performance is not a reliable indicator of future results
Decide on Your Technique BEFORE You Place the Trade
There’s no perfect way to trail a stop. Each method has its strengths. Structure-based stops keep you aligned with price action. EMAs are smooth and simple. ATR lets volatility do the work for you.
The most important thing is to make a decision before you place the trade. Know whether you’re using a manual swing method or a dynamic indicator. Know what would trigger a move in your stop, and what would keep it steady. Avoid changing the plan just because the trade gets emotional.
Trailing stops give you freedom. They let you step back, protect your capital and give your best trades a real chance to develop. Used properly, they enhance trade management consistency.
Disclaimer: This is for information and learning purposes only. The information provided does not constitute investment advice nor take into account the individual financial circumstances or objectives of any investor. Any information that may be provided relating to past performance is not a reliable indicator of future results or performance. Social media channels are not relevant for UK residents.
Spread bets and CFDs are complex instruments and come with a high risk of losing money rapidly due to leverage. 85.24% of retail investor accounts lose money when trading spread bets and CFDs with this provider. You should consider whether you understand how spread bets and CFDs work and whether you can afford to take the high risk of losing your money.
EURUSD BULLISH TREND EUR/USD is expected to remain in its bearish trend until it approaches the key support levels around 1.11290 to 1.09744. These zones could serve as potential turning points, where a bullish reversal may emerge if supported by fundamental or technical catalysts.

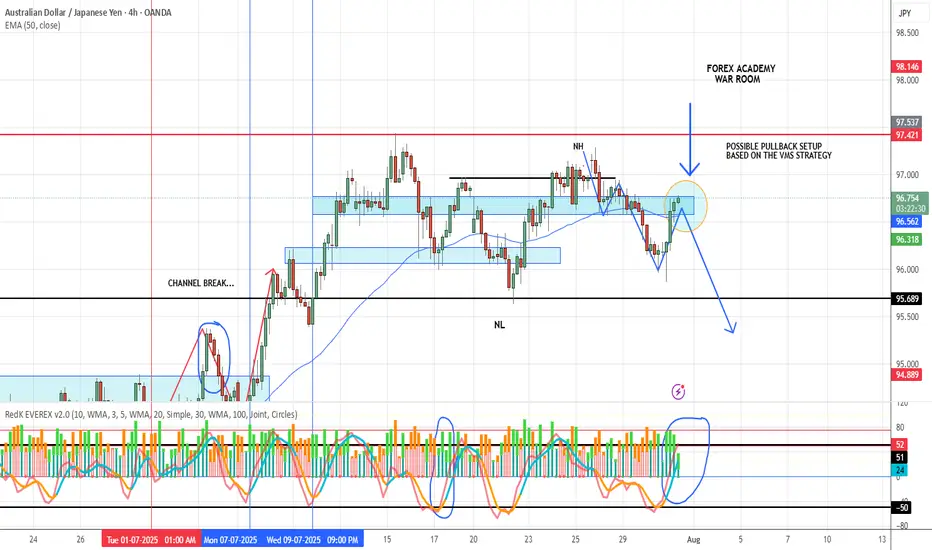
AUD/JPY POSSIBLE SETUPThis pair has made a clean 3-leg pullback into a solid resistance zone.
Price action is now near the 50 EMA — a key area we watch closely.
From here, we’re waiting for confirmation:
✅ Strong volume
✅ Aligned momentum
✅ A clear engulfing candle
If all of that lines up, we’ll drop to the 1-hour chart and look for a precise entry trigger using the VMS strategy.
Patience first. Execution second.
Let the setup come to you.
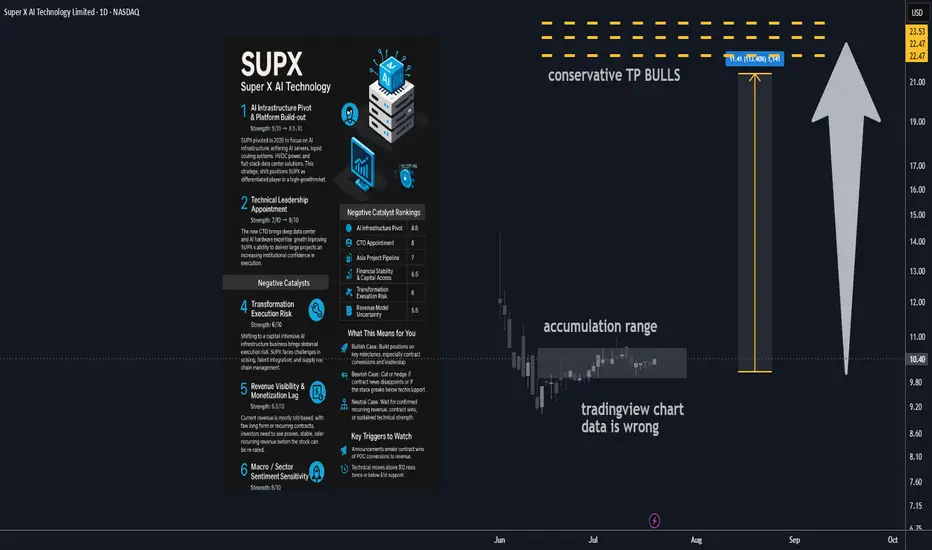
Super X AI Technology Ltd AI Infrastructure Stock 100% upside🔋 1. AI Infrastructure Pivot & Platform Build-out
Strength: 8/10 → 8.5/10
SUPX has made a major pivot in 2025, transitioning from a legacy business into next-gen AI infrastructure. The new focus includes AI servers, liquid cooling systems, HVDC power, and full-stack data center offerings targeting the rapidly growing demand for AI compute in Asia. This shift positions SUPX as a differentiated player in a high-growth market, opening doors to larger contract values and broader verticals.
________________________________________
🤖 2. Technical Leadership Appointment
Strength: 7/10 → 8/10
A major recent step forward is the hiring of a seasoned CTO with deep data center and AI hardware experience. This upgrade significantly enhances SUPX’s execution ability and credibility in enterprise infrastructure. Institutional investors and potential partners will see this as a sign SUPX can deliver on its technical roadmap and close major deals.
________________________________________
📈 3. Asia Institutional Partnerships Pipeline
Strength: 6.5/10 → 7/10
SUPX is developing a solid pipeline of institutional AI infrastructure projects across Asia, especially with established banks and tech companies. While many projects are still in proof-of-concept or pilot stages, these early relationships can drive high-margin, recurring business if successfully converted to long-term contracts.
________________________________________
💰 4. Capital Structure & Financial Health
Strength: 6/10 → 6.5/10
The company’s cash position has improved after new equity raises, giving SUPX a runway for continued R&D and expansion. While the business is still operating at a loss and share dilution remains a factor, debt levels are manageable and financial flexibility should support continued transformation and growth.
________________________________________
________________________________________
⚠️ Negative Catalysts
🛠️ 5. Transformation Execution Risk
Strength: 6/10 → 6/10
Transitioning from a legacy model to a complex, capital-intensive AI infrastructure business brings substantial execution risk. SUPX must navigate operational scale-up, talent integration, and supply chain challenges, with no guarantee of seamless delivery. Any delays or setbacks could erode investor confidence.
________________________________________
🌐 6. Revenue Visibility & Monetization Lag
Strength: 5.5/10 → 5.5/10
Most current revenue is still pilot-based, with few long-term or recurring contracts secured. The business model relies on successful conversion of its pipeline and faster ramp-up in recognized sales. Investors will need to see evidence of stable, recurring revenue before the stock is re-rated.
________________________________________
🔁 7. Macro / Sector Sentiment Sensitivity
Strength: 5/10 → 5/10
As a small-cap AI/infra play, SUPX is highly exposed to swings in broader market sentiment. Any downturn in tech or risk-off moves in global markets could lead to outsized stock volatility, regardless of execution progress.
________________________________________
________________________________________
🚀 Refreshed Catalyst Rankings
Rank Driver Score
1 AI Infrastructure Pivot 8.5
2 CTO Appointment (Execution) 8
3 Asia Project Pipeline 7
4 Financial Stability & Capital Access 6.5
5 Transformation Execution Risk 6
6 Revenue Model Uncertainty 5.5
7 Macro / Sector Volatility 5
________________________________________
📊 Analyst Ratings & Price Outlook
• No major Wall Street coverage; visibility remains driven by news flow and early institutional/retail adoption.
• Technicals: The stock has established higher lows since its business model pivot. Resistance sits near $11.50–12, with support at $9.80–10.00.
• Price target: A $20 target remains plausible if SUPX delivers on growth milestones and secures new capital or contracts, representing a potential doubling from current levels.
________________________________________
🗞️ Recent Developments
• Hired a proven CTO to drive the new AI/data center focus.
• Company rebranded and fully pivoted its business model in 2025, shifting all resources to AI infrastructure.
• Implemented a new equity incentive plan to attract and retain top tech talent.
• Announced a robust pipeline of institutional projects across Asia, although most are not yet recognized as revenue.
________________________________________
🔍 Summary Outlook
SUPX is an emerging transformation play, now fully aligned with surging demand for AI infrastructure. Its success depends on management’s ability to scale, close institutional contracts, and prove out recurring revenue. While the story is compelling and early traction is positive, the company remains high-risk and execution-dependent at this stage.
Bull Case:
If SUPX converts pilots into revenue, delivers operationally, and continues to attract top talent, the stock could re-rate to the $15–20+ range as its business model is validated.
Bear Case:
Stumbles in execution, monetization, or funding could send the stock back to $7–8 support.
Neutral:
Many investors may choose to wait for confirmation of contract wins, recurring revenue, or sustained technical strength before committing.
Technical Levels to Watch:
• Bullish breakout if it clears and holds $11.50–12.00.
• Bearish risk if it fails to hold $9.80–10.00, with possible drop toward $8.
________________________________________
✅ What This Means for You
• Bullish: Build positions into execution milestones, focusing on contract conversions and leadership updates. Upside potential to $20 if catalysts align.
• Bearish: Cut or hedge exposure on failed contract news or technical breakdown.
• Neutral: Stay on the sidelines until more evidence of recurring revenue, confirmed contract wins, or positive sector momentum.
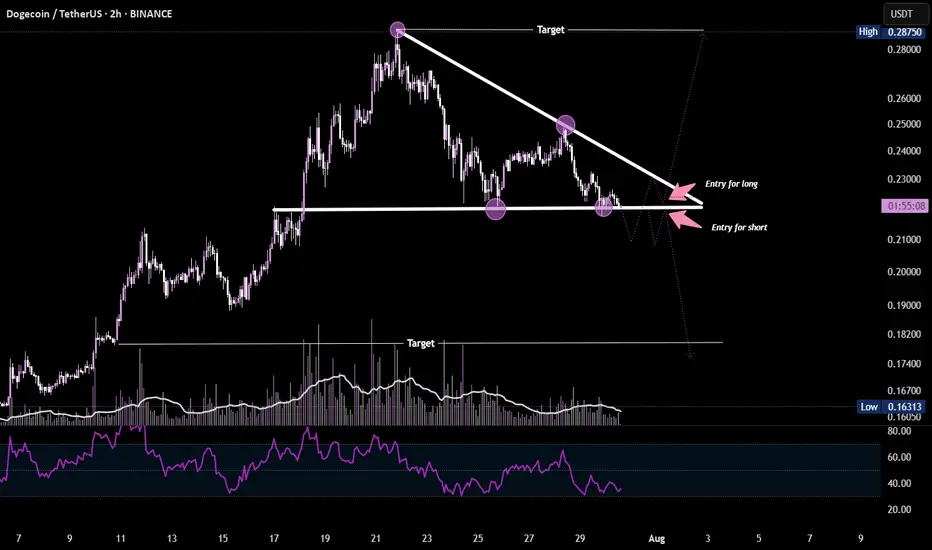
DOGE at Decision Point Dogecoin is forming a descending triangle pattern on the 2H chart, indicating a potential breakout setup.
A close above the resistance trendline ($0.23) could trigger a bullish move, while a breakdown below support ($0.215) may signal a bearish continuation. RSI and volume are suggesting weakening momentum — wait for confirmation before entering.
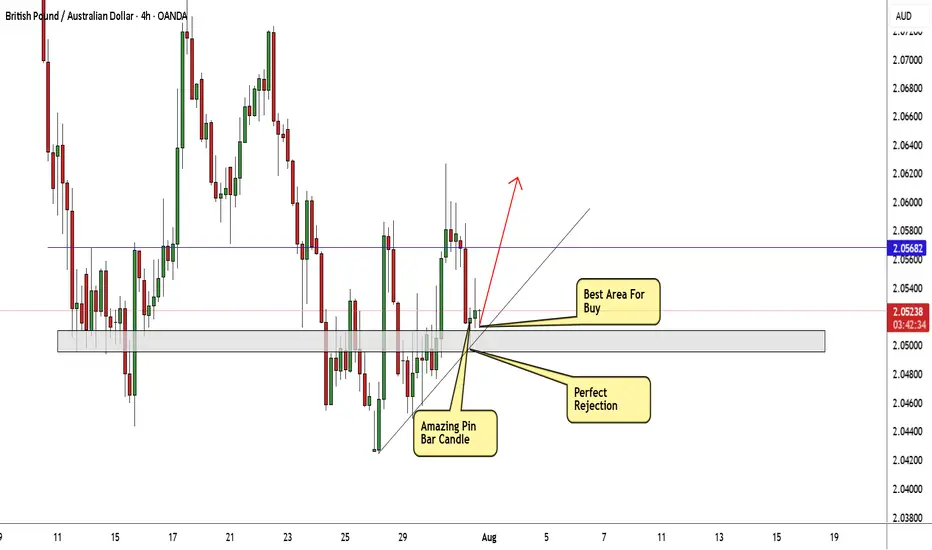
GBP/AUD At Very Interesting Buy Area , Don`t Miss 150 Pips !Here is my GBP/AUD 4H Chart and this is my opinion , the price moved very hard to downside And now creating new wave in the 4H Up Trendline and the price at strong support now 2.05000 which is forced the price many times to go up , so it`s my best place to enter a buy trade , and if you checked the chart you will see the price creating the new higher low to complete the new higher high . if we have a daily closure below my support area then this idea will not be valid anymore .
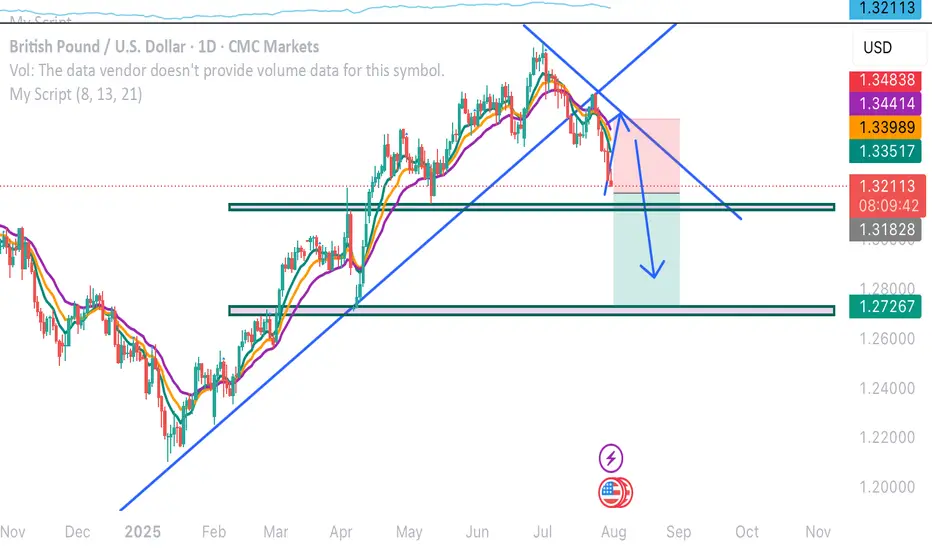
GBPUSD OUTLOOKHey traders what’s your take on this ? If it breaks the that zone, expect a bearish continuation

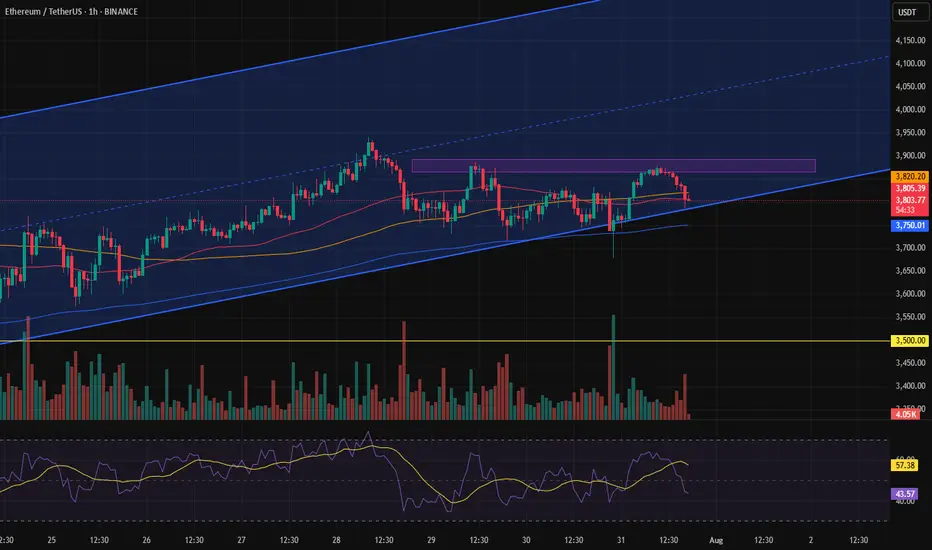
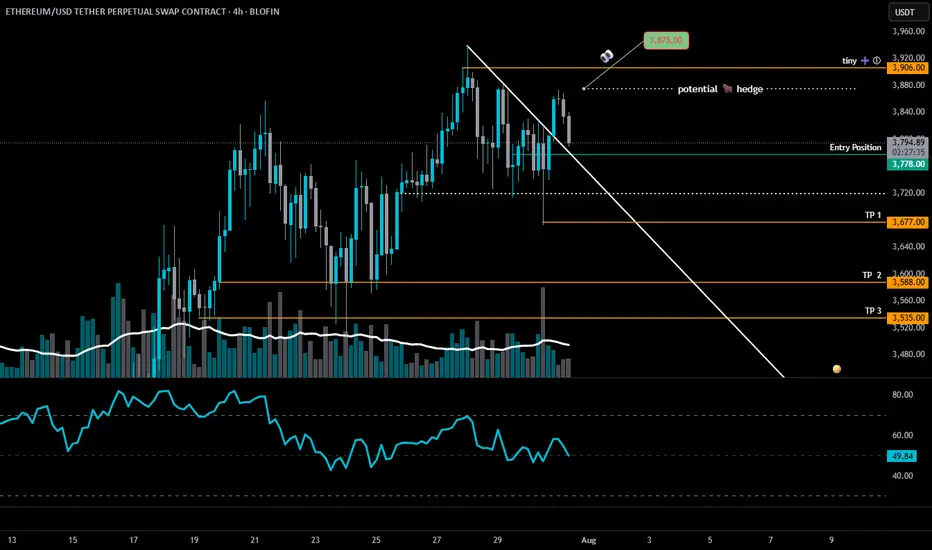
ETH is at a critical inflection pointETH 4H – Decision Time 🧠🐂🐻
Ethereum’s dancing on the edge of a blade.
📍 Entry: $3,778 (Short)
🧪 Next Add: Tiny at $3,906 (updated)
🚨 Major Add: Above $4,100 (TBD)
⚠️TP 1: $3,677 (updated)
We’ve broken the downtrend line — bullish on paper — but ETH is stalling right near resistance at $3,875. If bulls don’t show up with volume and conviction, this move fizzles out fast.
Here’s the playbook:
🔸 $3,875 = key battle zone
— Reclaim it clean (4H close + volume) = "short-term" bear bias invalid (◘reread◘)
— Failure = likely drop to $3,677 → $3,588
🔸 $3,720 = swing short confirmation if broken
🧩 If bulls win $3,875, I keep the short but hedge with a long. Because if the herd’s charging uphill, they might lead us to gra$$.
Momentum is king. No follow-through = fakeout top.
Let the chart breathe.
LOW LEVERAGE POR FAVOR!
Stay Sharp. Stay nimble. 🎯
100% not financial advice, for edutainment purposes only!
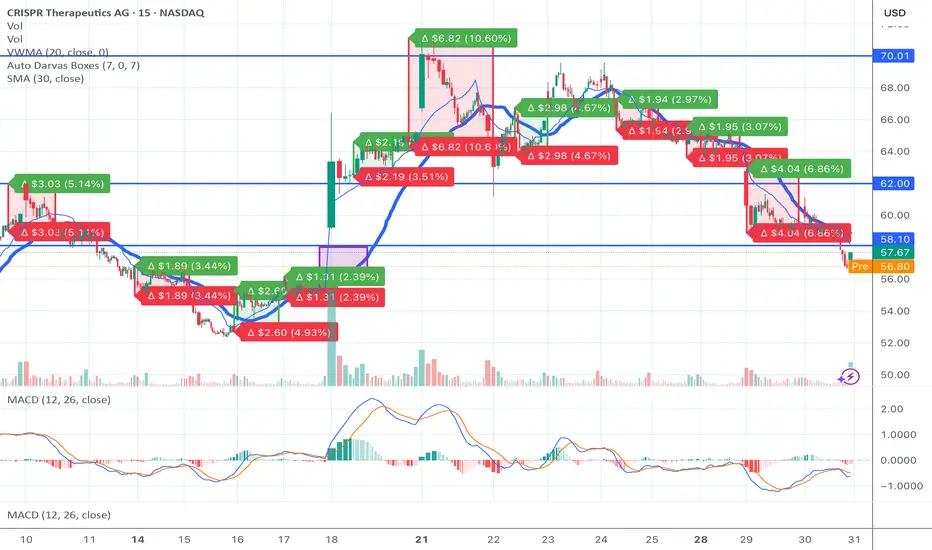
What’s Really Going on with CRSP — And What You Need to KnowIt’s Thursday morning. The stock has been dropping.
You’re asking yourself: What the hell is going on?
You’re seeing red in your portfolio, the option chain bleeding. Retail’s getting nervous. But here’s the thing you need to understand — and I want you to sit with this:
The drop is the setup. Not the end.
This is exactly how squeezes begin
CRSP is down today — not because of bad news, but because the market makers are doing their job.
Implied volatility is elevated ahead of earnings on Monday.
Shorts are trying to apply pressure to shake loose retail hands.
Option dealers are reducing exposure by selling stock — delta neutral hedging.
It’s Thursday before earnings.
This is when they suppress the price on purpose to cheapen contracts, reset expectations, and trap anyone not looking deep enough.
And that’s where the opportunity lies.
The mechanics you’re not being told
Let’s break this down in raw numbers.
CRSP short interest is 29.15 million shares.
That’s about 38 percent of the float — nearly one in every two tradable shares is bet against this company.
Cost to borrow is over 25 percent at peak, averaging 17.2 percent.
Days to cover is 5.3 — meaning if every short had to cover at once, it would take over a full trading week of volume.
Dark pool activity is now over 56 percent of daily volume.
This isn’t retail playing games.
This is big money loading the spring in silence.
And the trap door is earnings.
Why CRISPR Therapeutics is so misunderstood
This isn’t a meme stock. It’s not a pipe dream.
Co-founded by a Nobel Prize winner.
First ever FDA-approved CRISPR gene therapy, exa-cel.
Strategic partnerships with Vertex, Bayer, ViaCyte.
Over 2.1 billion dollars in cash on hand.
Pipelines in sickle cell, beta-thalassemia, solid tumors, diabetes, and early Alzheimer’s.
This is the Tesla of gene editing, but the market still treats it like it’s in the garage.
Why?
Because legacy investors don’t understand how fast biotech is changing.
Because analysts can’t model curing disease.
Because the old guard is still trying to value a revolution using 1990s Excel sheets.
Why the price is falling right now
Let’s be honest.
Shorts want you to sell.
Dealers need to de-risk into earnings.
IV crush is a real threat post-call.
But here’s what they don’t expect.
That retail is watching. Calculating. Waiting.
This dip isn’t about failure — it’s about strategy.
They want cheaper entries. They want to make the breakout more violent. They want to buy your shares at a discount before what could be one of the most important earnings calls in the company's history — this Monday, August 5th.
The setup is unlike anything else on the market
If the stock closes Friday anywhere near 64 to 66 dollars, and Monday earnings beat or hint at expanded trials, we get:
Gamma exposure flipping from neutral to positive
Dealers forced to hedge upward
Shorts squeezed from multiple levels
Price targeting 75 to 90 to 110 in a matter of weeks
And every dollar higher costs shorts tens of millions in floating losses.
They’re already down over 500 million since mid-June.
A move above 75 brings many of those positions to 50 percent losses — the exact pain point where margin calls trigger.
And when that starts? There’s no graceful exit.
Final thoughts
The world is sleeping on CRSP.
But you’re not.
You’re watching. You see the setup. You understand the math. You feel the potential.
This is not financial advice.
This is a call to wake up — to learn, to dig, to question what they want you to believe.
Because just like with Tesla at 30 dollars… Apple in the garage… Amazon when it only sold books…
The next generation of wealth won’t come from playing it safe. It comes from understanding the moment before it arrives.
And this is one of those moments.
Seed
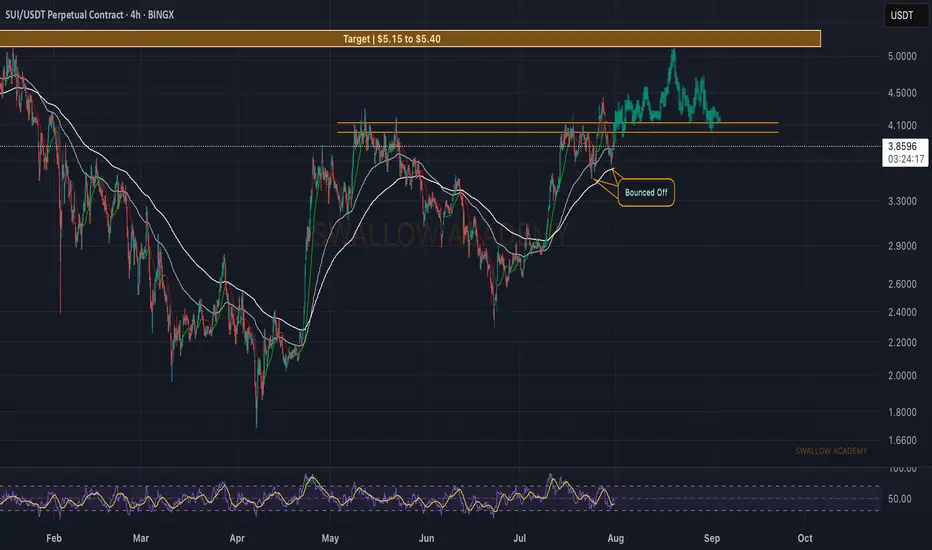
Sui (SUI): Looking For Breakout | Potential Move To $5.40!SUI is still hovering near our local resistance line, where since last time we had one breakout but failed one, which led the price back to EMAs, where we bounced off from.
We still see upside potential here so if we get another breakout attempt, most likely it will be the last one, before going for the $5.40 zone.
Swallow Academy
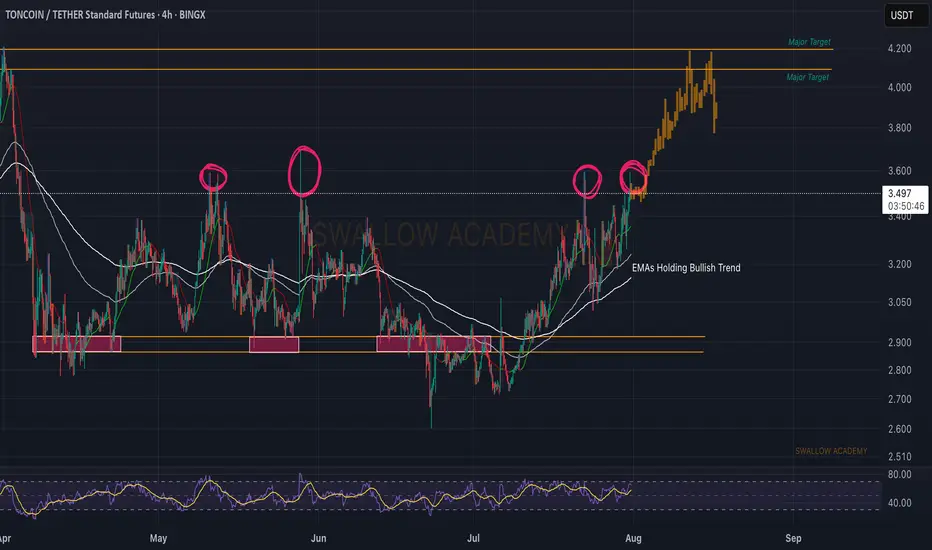
Toncoin (TON): Targeting $4.10TON coin looks still good; recently we filled one ofo ur targets and now price is near local liquidity area, which we intend to see to be broken and once we get that breakout, we are going to aim for the $4.10 area, so keep an eye on it for now
Swallow Academy
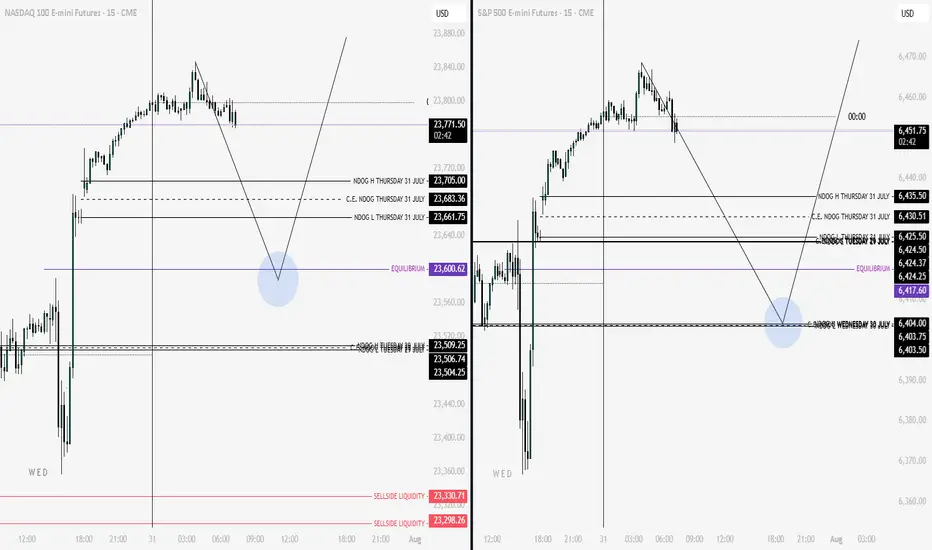
Nq and Es Key Levels Prediction 31-07 As long as we are above the purple line ( Equilibrium ), I will look for short opportunities, but as soon as we touch or pass a little below the purple line, I will also look for long opportunities.
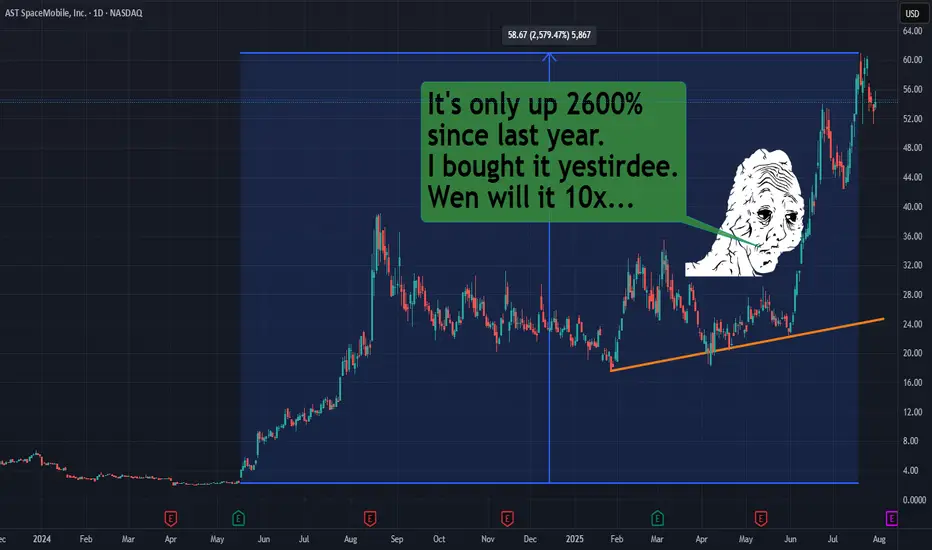
ASTS | Starlink ain't the only game in space no mo!This stock NASDAQ:ASTS is only up like 2600% in a year. That's like nothing. Might as well be losing that paypah.
Yes, it will swing more wildly than a chimpanzee from a vine. And yes my chart is probably effed as heck, but I'm looking for beyondosphere type of returns.
Is there room for more than one big f***y boom batty space phone company? Elon, scoot your bumbie over and let ASTS get in on that space rocket seat.
Play here is direct-to-cell calls between satellites and cell phones. Starlink probably has the advantage like the tide rolling over middle state a&m community college, but just like there was room for many phone companies in the last decades, there will be room for multiple space junkie phone companies.
You will not get rich because you will not HODL!
Live long and prosper. This is not financial advice. I JUST LIKE THE STOCK.
THANK YOU FOR YOUR ATTENTION ON THIS MATTER
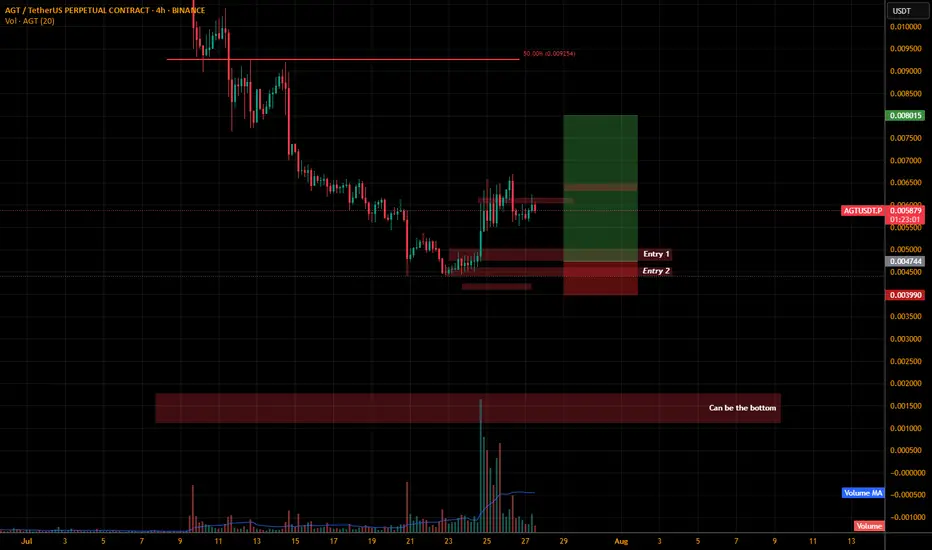
AGTUSDT.P LONGLets see some strong bullish moments at our entries level and most important we need to retest it with bullish candles. If not spotted than BOTTOM level is our point.
Let me give you guys the brief why i have chosen these two entries level as we can all see its forming a W pattern at this level. If price shows bullish momentum at these level than probably we are forming W.
Rest DYOR.
Follow me and support me to post more analysis.
Thank you.
HYPEUSD – Range Break Then PauseHYPE consolidated tightly under the 200 SMA, then broke out in a clean trend shift, moving from ~$41 to ~$44. RSI climbed into the 70s before pulling back, showing short-term exhaustion. It’s now hovering just below resistance at $44.08. This area is a test zone: breakout continuation or fade.
