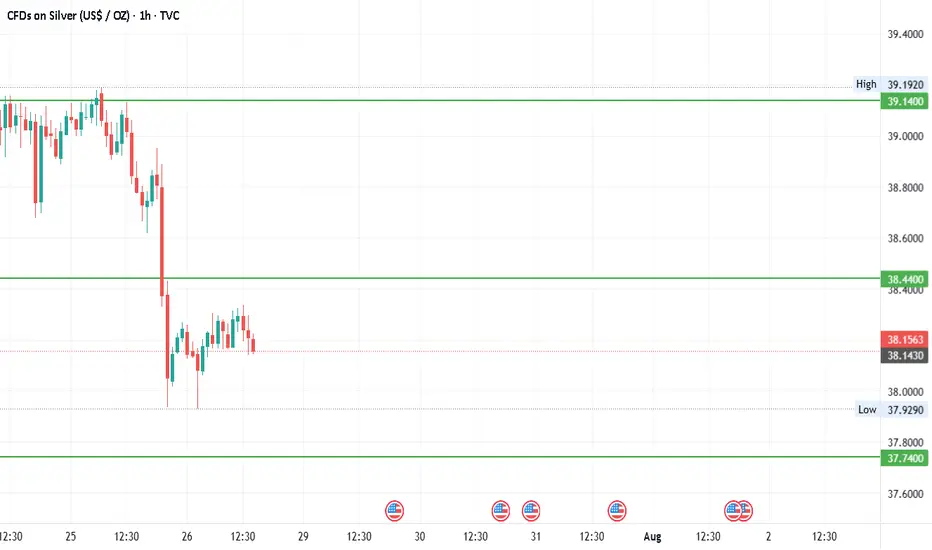
#SILVER - $3 Swing? 42 or 34.87?Date: 28-07-2205
#silver
Current Price: 38.15
Pivot Point: 38.440 Support: 37.740 Resistance: 39.145
Upside Targets:
Target 1: 39.812
Target 2: 40.480
Target 3: 41.245
Target 4: 42.010
Downside Targets:
Target 1: 37.070
Target 2: 36.400
Target 3: 35.635
Target 4: 34.870
#TradingView #Stocks #Equities #StockMarket #Investing #Trading #silver
#TechnicalAnalysis #StockCharts #Finance
#Gold #Bitcoin #Silver #TradingView #PivotPoints #SupportResistance
Chart Patterns
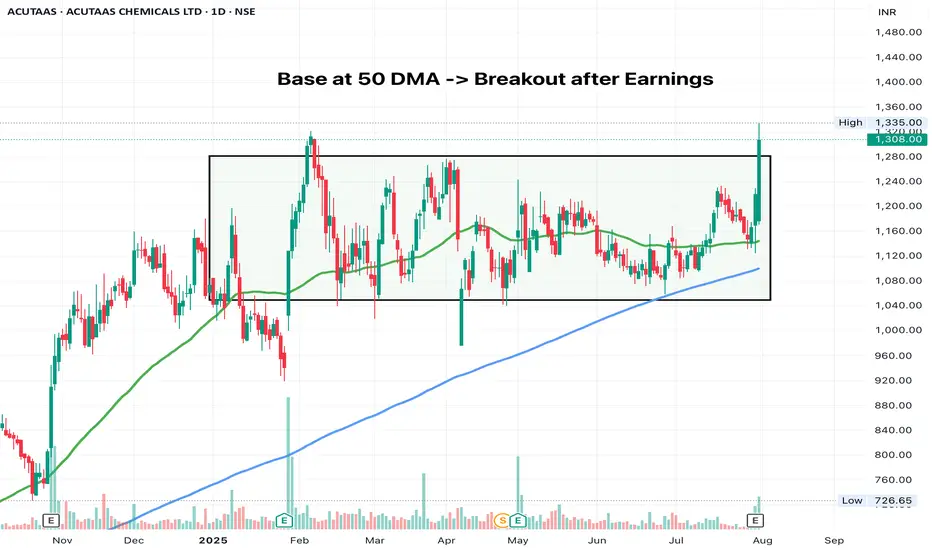
ACUTAASWait for a follow through day to enter, seeing the momentum fade out in this stock after earnings. Although the candle this time is strong.
Platinum Breakout Stalk: Thief Entry Only After Confirmed🧠 Thief's Heist Plan Activated!
Asset: XTI/USD (PLATINUM) 💎
Strategy: Bullish Pullback + Breakout Play 💥
🔍 We stalking platinum's neutral zone… waiting for that clean breakout!
No early entries, no premature SLs. Discipline = Profits. 🎯
🎯 Entry: After breakout confirmed. Use multiple DCA limit orders to layer in like a ghost.
🔐 Stop Loss: ONLY after breakout – Place at 1280.00 🛡️
💎 Target: 1560.00 – Vault unlock point! 💰
📵 DO NOT place SL or orders before breakout – patience is the thief’s edge. 🧘♂️
This isn’t gambling... this is precision trading. Breakout = green light 🚦
Get ready to raid the platinum vault!
#ThiefTrader #BreakoutStrategy #PlatinumHeist #XTIUSD #BullishSetup #SmartMoneyMoves

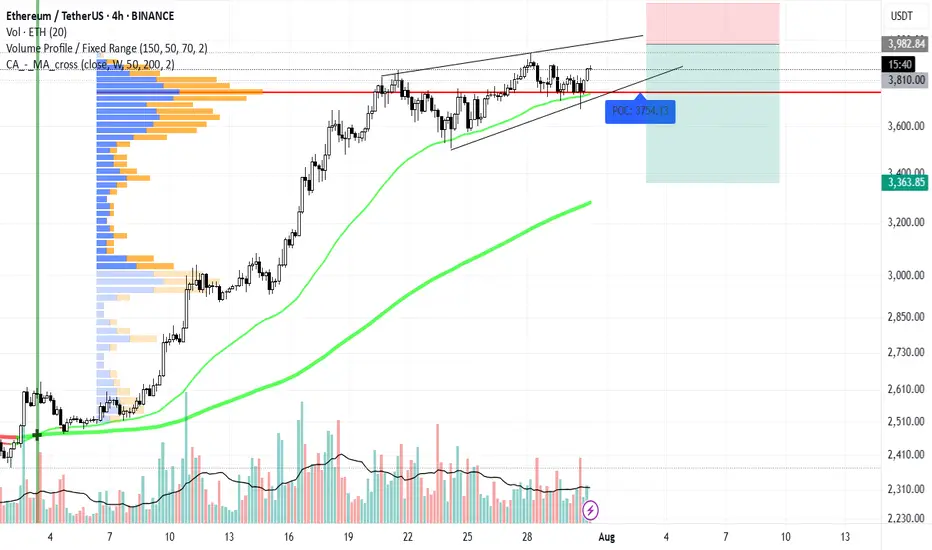
ETH ready for a Pullback.... As we can see, BINANCE:ETHUSD is forming a wedge pattern and may drop to $3,300. We're in a bullish trend, so shorting ETH could be risky—please be cautious !
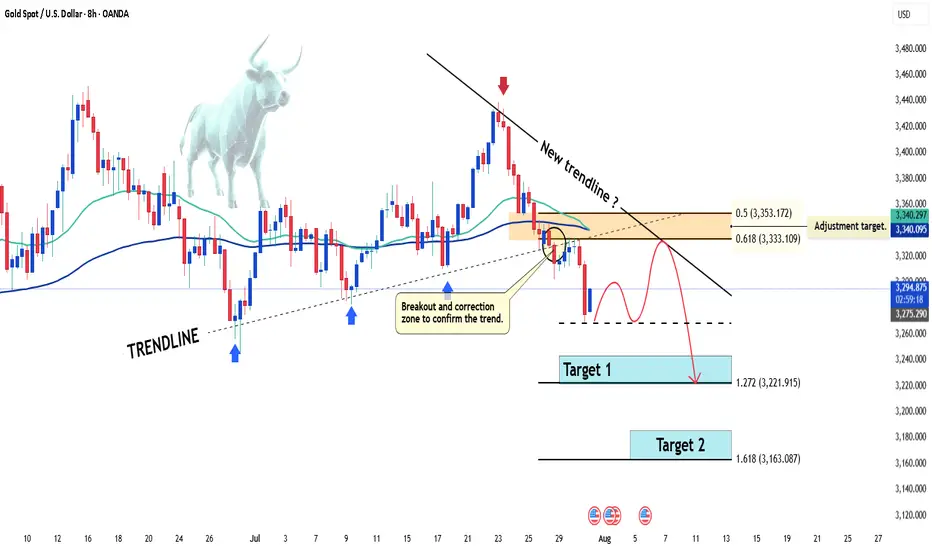
Gold price continues sharp declineHello everyone! Do you think gold will rise or fall? Let’s dive into the latest movements of this precious metal.
Just as we anticipated in yesterday’s strategy , gold has extended its downward move, with the bears firmly in control. The precious metal is currently trading around 3,290 USD, clearly signaling a short-term downtrend after breaking the ascending trendline that started in early July. Although there was a slight bounce, price remains capped below the key resistance zone of 3,333 – 3,350 USD, which coincides with the confluence of the 0.618 – 0.5 Fibonacci retracement and the EMA 34/89 — adding even more downside pressure.
The main reason behind this recent drop lies in the easing of trade tensions following the US-EU tariff agreement, which has significantly weakened gold’s safe-haven appeal. At the same time, the FOMC meeting yesterday failed to provide any bullish catalyst for gold. Even though the Fed is expected to keep rates unchanged, a single hawkish remark from Chair Powell was enough to intensify short-term selling pressure.
From a technical perspective, gold attempted to retest the broken trendline but failed, confirming the bearish structure. A new wave of correction could emerge soon, but the overall outlook remains tilted toward further downside.
My personal view:
Target 1 is at the 1.272 Fibonacci extension.
Target 2 lies at the 1.618 Fibonacci level — which could be the next destination.
And you — what do you think about this trendline break? Let’s discuss in the comments!
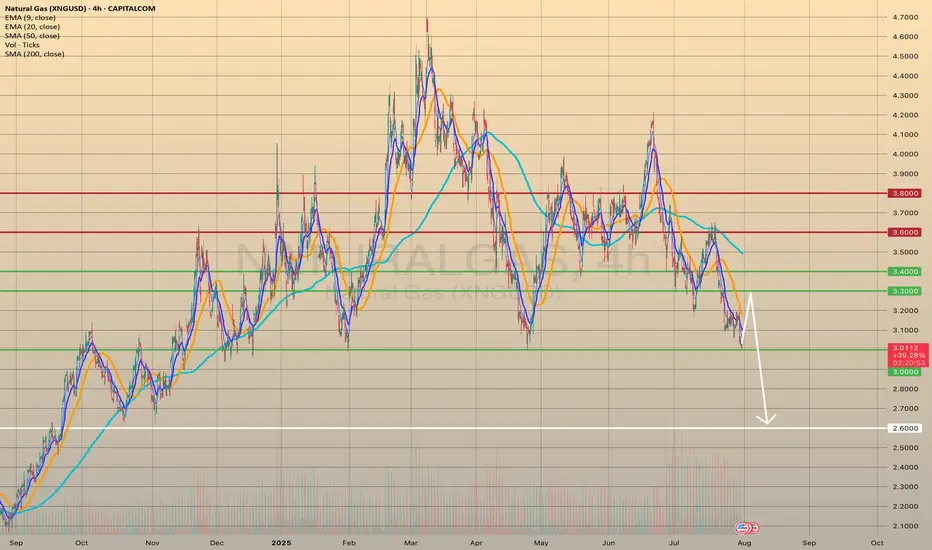
NATURAL GAS REACHED THE KEY SUPPORT LEVEL. WHERE TO GO NEXT?NATURAL GAS REACHED THE KEY SUPPORT LEVEL. WHERE TO GO NEXT?
XNGUSD has come to a crucial support level of 3.0000. Although the sentiment here stays as quite bearish (seasonally, August is not the perfect month for natgas buyers), we expect the price to rebound from the level of 3.0000 towards 3.3000 first. Afterwards, the continuation of bearish trend is expected with final target of 2.6000 before cold season beginning.
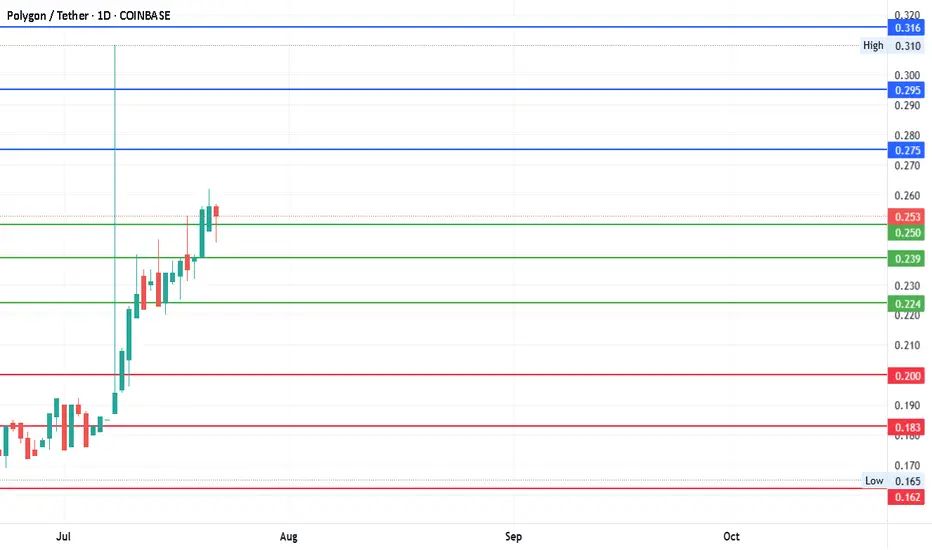
#MATICUSDT - Pivot is $0.239Date: 22-07-2025
#MATICUSDT Current Price: $0.253
Pivot Point: $0.239 Support: $0.224 Resistance: $0.254
Upside Targets:
Target 1: $0.275
Target 2: $0.295
Target 3: $0.316
Target 4: $0.337
Downside Targets:
Target 1: $0.203
Target 2: $0.183
Target 3: $0.162
Target 4: $0.141
#TradingView #Crypto #Bitcoin #BTC #CryptoTA #TradingView #PivotPoints #SupportResistance
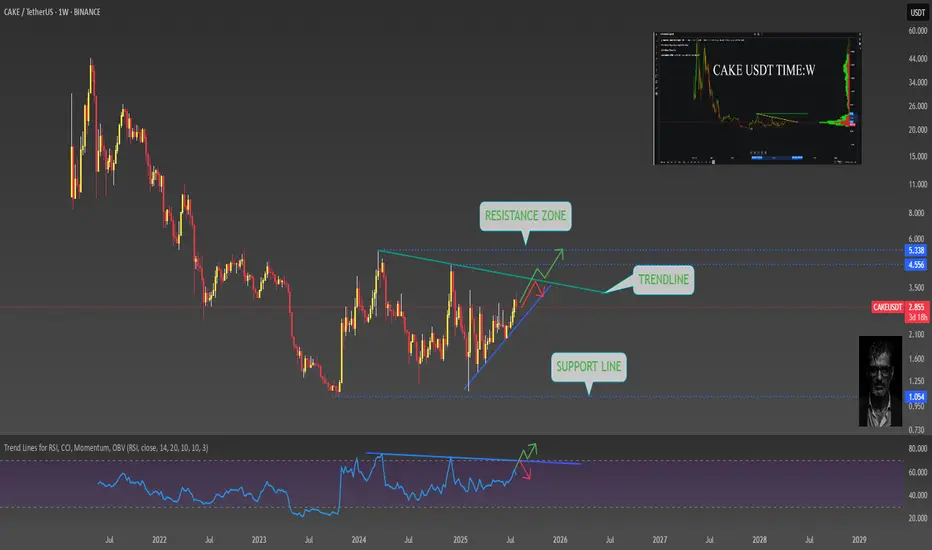
CAKE USDT :WThe CAKEUSDT currency is in a good position on the weekly timeframe near long-term dynamic resistance. Considering the RSI and trading volume, the probability of breaking this resistance is high.
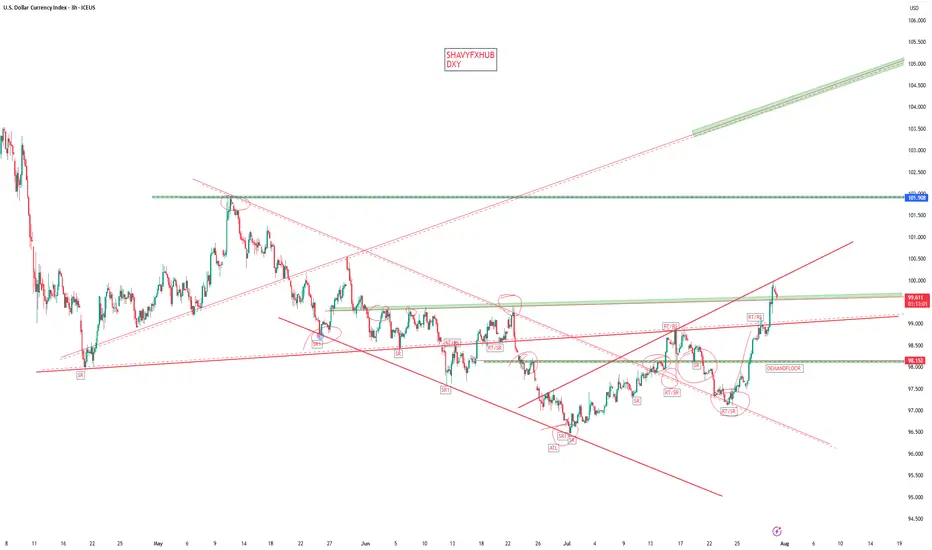
DXYThe Federal Open Market Committee (FOMC) announced on July 30, 2025, that it will maintain the federal funds rate at the current target range of 4.25% to 4.50%. This keeps the rate unchanged from previous meetings, continuing a "wait-and-see" approach amid mixed economic signals. The decision was supported by a 9-2 vote. The committee highlighted that recent data suggests economic activity growth has moderated in the first half of the year, with low unemployment and somewhat elevated inflation. The FOMC indicated it would carefully assess incoming data, the evolving economic outlook, and the balance of risks before making further adjustments. There is no rate cut at this meeting, but the Fed remains attentive to risks on both sides of its dual mandate of maximizing employment and achieving inflation around 2%.
Federal Reserve Chair Jerome Powell emphasized the need for additional data, particularly regarding the impact of tariffs on inflation and economic conditions, before changing policy. The economy showed stronger-than-expected second-quarter growth, but inflation remains above the Fed's 2% target, contributing to the decision to hold rates steady. The committee's stance reflects caution despite pressure from political sources to cut rates.
The next FOMC meeting after this one will be in September 2025, and some economists predict a possible rate cut then depending on economic developments. Powell's press conference and the FOMC statement will be closely analyzed for any subtle shifts in policy tone or outlook.
In summary:
Federal funds rate maintained at 4.25% - 4.50%
Economic growth moderated but remains solid
Low unemployment, inflation somewhat elevated
Fed is data-dependent and cautious
No rate cut for now but possible in September
This is consistent with the ongoing approach since late 2024 of holding rates steady to balance inflation control and support for the labor market.
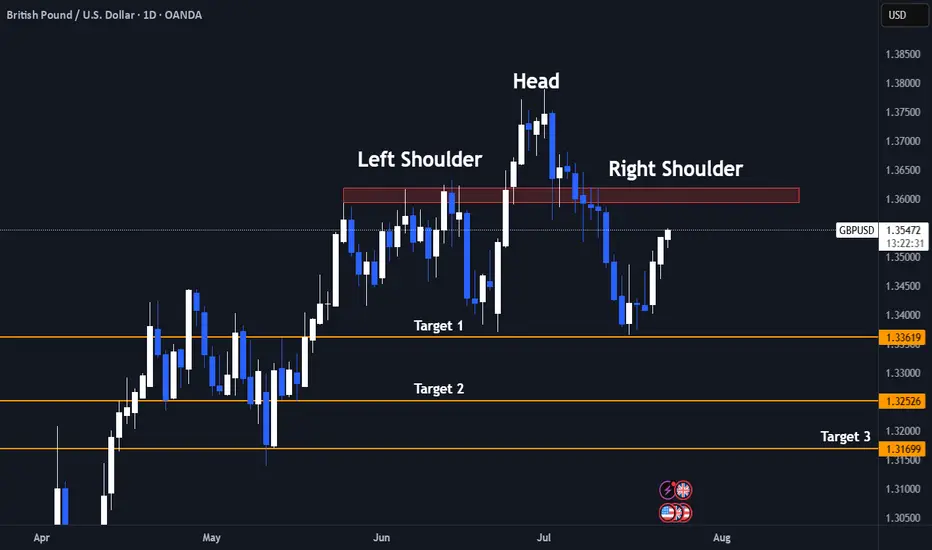
Bull Trap Confirmed: GBPUSD's 8% Rally Faces ExhaustionLets Face it we had a great 6 months already clocking 60%+ Returns already.
And after sitting ducks for almost 2 months now we finally have a trade.
- Its a very self explanatory chart
- Trading at resistance
- Head & Shoulder pattern
And the best part the right shoulder is still yet to be formed! My favourite type of entry.
1.It gives a better risk reward ratio (1:7 expected)
2.Better Entry (No long red candles)
3. And even if the pattern fails it we may still reach the neck line which is target 1.
Entry Criteria
- A Red candle at the entry Line Marked
- Stoploss Above the Entry Candle
Target 1- 1.3361
Target 2- 1.3252
Target 3- 1.3169
Keep Your Risk Reward Intact! Not An investment Advice
Gold OutlookI think Gold is about to do a minor recovery Pump , after days of Red, maybe we are about to see some relief green, this is my very first long trade
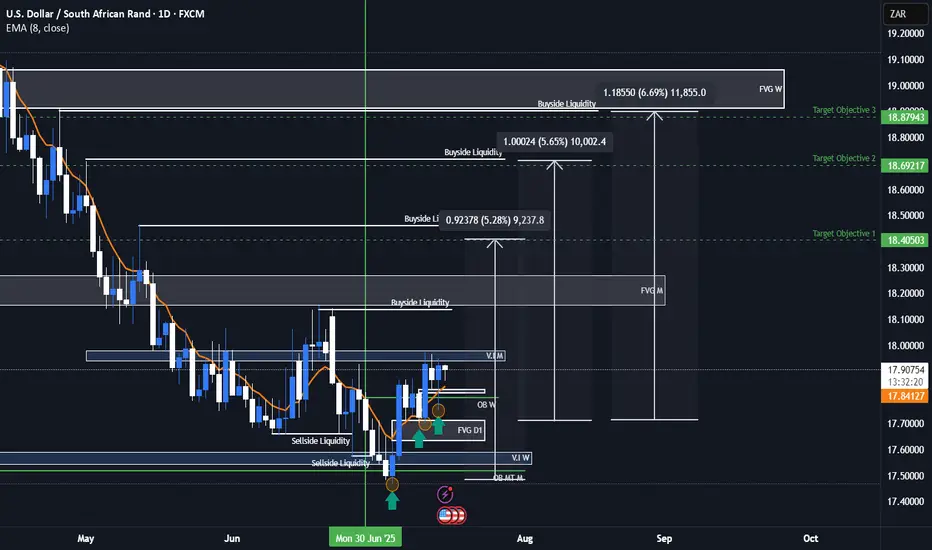
USDZAR Bullish ideaAs we can see this is our USDZAR quarterly shift idea were we are anticipating price to rally to the upside toward our draw on liquidity objectives. We had a weekly volume imbalance and monthly mean threshold order block show us support after we took out major liquidity points. We also showed more support on our daily FVG and a market shift taking place after a displacement. We are anticipating a rally for USDZAR and will be looking to see how price plays out.
USDZAR is an exotic pair that is part of the emerging markets and emerging markets/exotic pairs can usually lead ahead of major forex pair or lag between major forex pairs so this can also help us with our intermarket analysis of forex pairs when determining our dollar strength against other basket currencies.
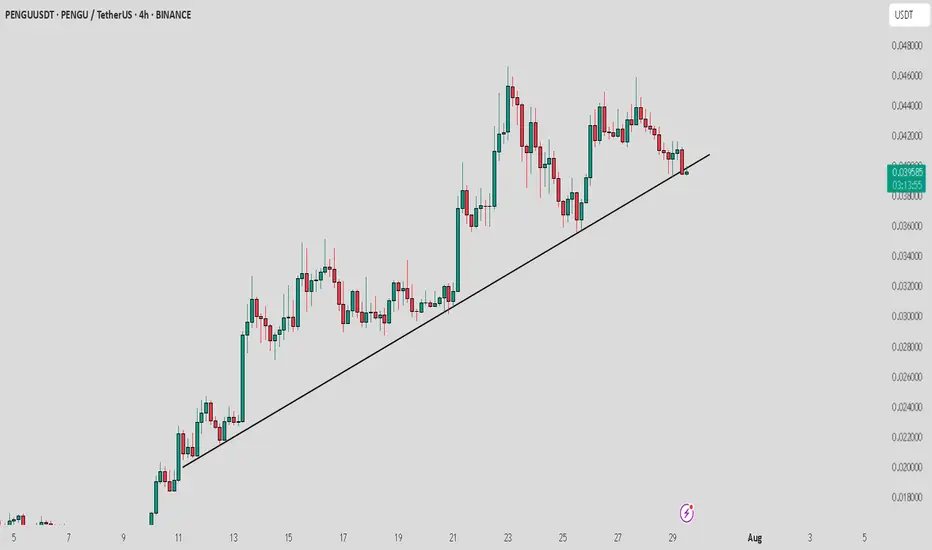
PENGU / USDT : Breaking down from Trendline supportPENGU/USDT is breaking down from the trend line support, but the retest is still in progress. Watch for rejection at key levels.
Pro Tip: Wait for confirmation of rejection before entering the trade and always apply proper risk management to safeguard your position.
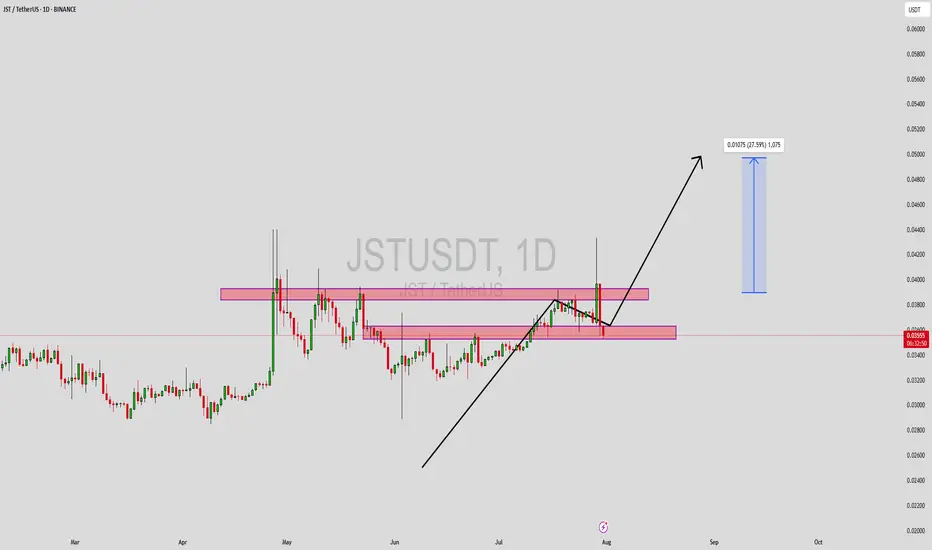
JSTUSDT Forming Bullish MomentumJSTUSDT has recently gained attention among traders as it moves closer to a key breakout level. The chart shows a series of higher lows, indicating underlying bullish momentum despite short-term rejections near resistance zones. The price action reflects a coiling structure with tightening price ranges, hinting at an imminent breakout. Volume has remained consistent, which is often an early sign of accumulation and growing investor interest.
As JSTUSDT continues to test its resistance zone, a successful breakout could lead to a sharp upside move. The projected gain of 20% to 25%+ aligns with the measured move from recent consolidation zones. This movement is supported by market interest in JST, which is a core part of the TRON ecosystem, providing decentralized finance capabilities like stablecoin lending and borrowing. The project’s integration and use within the TRON network continue to attract both retail and institutional investors.
Technically, the price is respecting key support and resistance levels, with clear zones marked out on the chart. The support zone has held strong on multiple tests, making it a potential launchpad for the next leg up. With volume backing the setup, and favorable sentiment across broader market conditions, JST is well-positioned for a breakout rally.
Short-term traders and mid-term investors should keep JSTUSDT on their watchlist, especially as momentum builds near the upper resistance area. If the breakout confirms with a daily close above resistance backed by volume, it may trigger rapid price movement.
✅ Show your support by hitting the like button and
✅ Leaving a comment below! (What is You opinion about this Coin)
Your feedback and engagement keep me inspired to share more insightful market analysis with you!
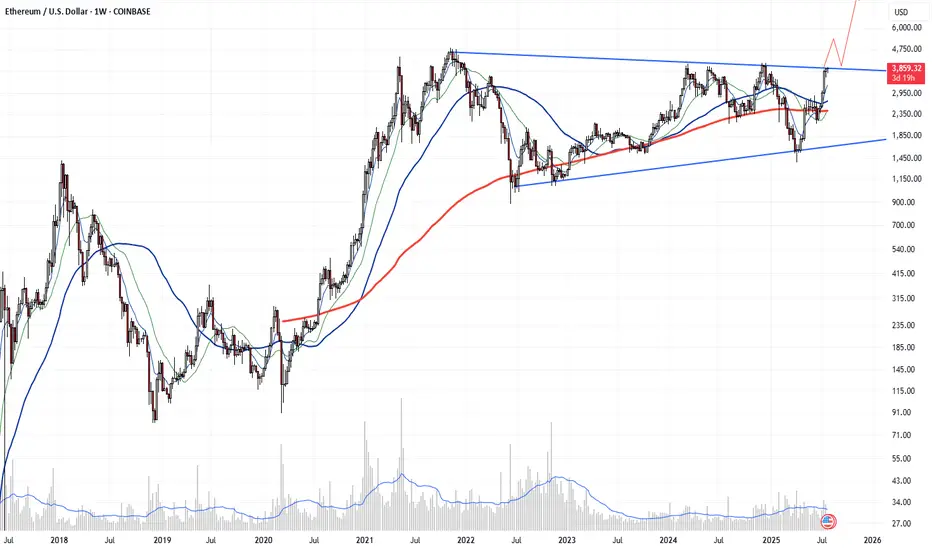
ALT season is here - this is huge, hugeETH is in an enormous symmetrical triangle on the weekly chart and its crossing upper line.
If the week finishes above 4000, nobody can stop this. Running to 6000 without stopping is almost certain.
After it needs to relax and the alt season will explode. This seems to be just a new life opportunity.
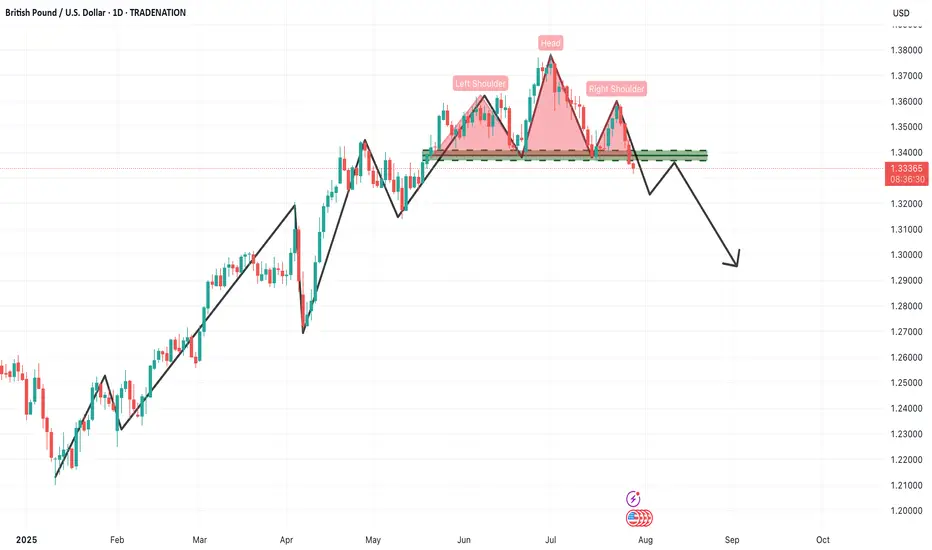
GBPUSD – Daily Timeframe Analysis: Head & Shoulders PatternThe GBPUSD daily chart is currently presenting a textbook Head & Shoulders reversal pattern, a powerful bearish signal that often marks the end of an uptrend and the beginning of a new downward cycle. This setup demands attention from swing and positional traders alike, especially considering the size and clarity of the structure.
🔍 Pattern Breakdown
Left Shoulder: Formed in late May, establishing a significant high before a corrective move.
Head: A higher peak was made in early June, which now stands as the pattern's highest point.
Right Shoulder: A lower high formed in mid-July, indicating weakening bullish momentum.
Neckline: The crucial horizontal support zone around 1.3330–1.3340 was tested multiple times and has now been decisively broken, triggering a confirmed bearish setup.
📊 Technical Significance
This Head & Shoulders pattern becomes especially meaningful due to:
Multiple rejections at the neckline, confirming its strength as support-turned-resistance.
Bearish volume expansion on the breakdown, adding weight to the selling pressure.
Formation on a daily timeframe, suggesting a long-term trend reversal rather than a short-term pullback.
📌 Trading Strategy for Traders
✅ Sell Setup (Short Position)
Entry: Around the neckline zone on retest (1.3320–1.3340)
Stop Loss: Above the right shoulder (~1.3550)
Targets:
🎯 Target 1: 1.3100 (psychological and horizontal support)
🎯 Target 2: 1.2900 (measured move from head to neckline)
🎯 Target 3: 1.2650–1.2600 (extended downside zone based on structure)
⚠️ Risk Management Tips:
Don’t chase the breakdown — wait for a pullback/retest of the neckline to get a better risk/reward entry.
Ensure position sizing is appropriate based on the stop loss distance.
If price reclaims the neckline with strong bullish momentum and closes above 1.3350, exit short and reevaluate.
🧠 What Traders Should Keep in Mind
Macro Fundamentals: Watch upcoming economic events like BoE rate decisions, US NFP, and inflation data, which can cause volatility and impact the technical scenario.
Dollar Index (DXY) trend should also be monitored closely. If DXY rallies, GBPUSD breakdown can accelerate.
Trendline Confirmation: Align this with any break of rising trendlines drawn from previous lows.
📌 Final Thought
This pattern marks a crucial turning point in GBPUSD. The momentum has clearly shifted from buyers to sellers, and the breakdown opens up significant downside room. As a swing or position trader, this is a high-probability setup with a clear invalidation point (above the right shoulder) and a favorable risk-reward ratio.
📉 Patience and precision are key here. Let price come to you at the neckline, confirm rejection, and then take the trade with confidence.
=================================================================
Disclosure: I am part of Trade Nation's Influencer program and receive a monthly fee for using their TradingView charts in my analysis.
=================================================================
Gold Crashes $100 After Hitting Monthly High | What’s Next?In this video, I break down everything that moved the price of gold last week, from the early-week rally toward $3,430 to the sharp midweek drop toward $3,325. We go beyond the surface, diving into what caused the reversal, and how I'm approaching next week’s market using a simple ascending channel on the 4-hour chart.
With major events like the FOMC rate decision, U.S. GDP, PCE inflation, NFP and the August 1 tariff deadline all on the radar, this analysis will help you stay grounded and prepare for volatility.
👉 If you find this content valuable, don’t forget to Boost, Comment, and Subscribe for weekly market breakdowns.
Disclaimer:
Based on experience and what I see on the charts, this is my take. It’s not financial advice—always do your research and consult a licensed advisor before trading.
#goldanalysis, #goldforecast, #xauusd, #goldpriceprediction, #technicalanalysis, #fundamentalanalysis, #tradingstrategy, #forextrader, #priceaction, #fomc, #usgdp, #pceinflation, #goldtrading, #forexeducation, #dollarvsgold, #tariffnews, #chartanalysis, #forexmentorship, #rebuildingthetraderwithin

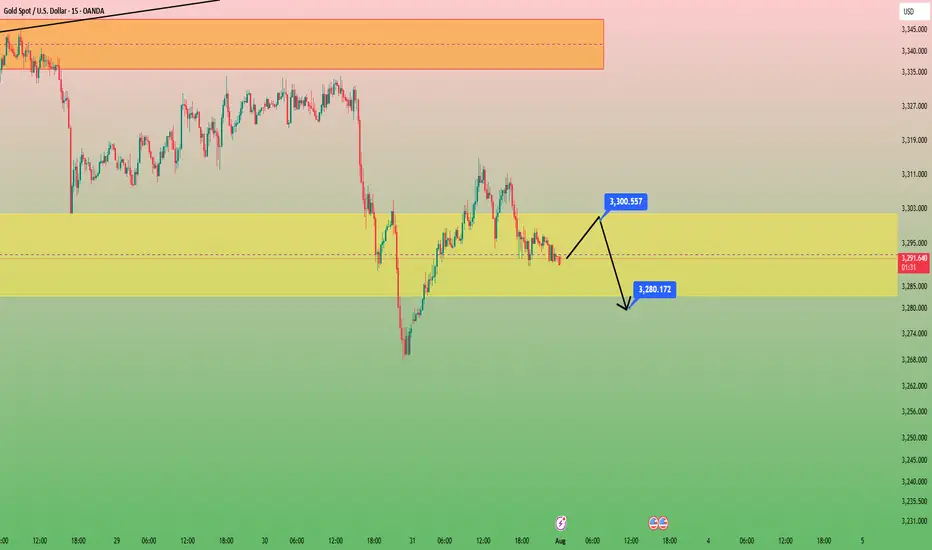
GOLD in 15minHello to all traders. 😎😎
I hope all your deals will hit their targets. 🎉🎉
After yesterday's heavy drop on the last day of July. We had a weak growth.
I think the price will retest $3300 and we will have another drop to the $3280 area. Look for short positions in the $3300 area.
Remember that this is an analysis and be sure to do money management when trading.
What Do You Think?
Which scenario do you think is happen? **Share your thoughts!** ⬇️
Don't forget that this is just an analysis to give you an idea and trade with your own strategy. And don't forget the stop loss🛑🛑🛑
❤️❤️❤️The only friend you have in financial markets is your stop loss❤️❤️❤️
Please support me with your ✅' like'✅ and comments to motivate me to share more analysis with you and share your opinion about the possible trend of this chart with me 🙏😊
Be Happy , Ali Jamali
XAUUSD Intraday Technical Analysis – Bullish Breakout SetupGold (XAUUSD) is showing signs of bullish recovery after a sharp sell-off, with current price action around 3305.86 USD hinting at a potential breakout on the 1-hour timeframe.
- Technical Overview
Price structure: After a steep decline, gold formed a base near the 3284–3299 zone and is now climbing back, with a potential inverse head-and-shoulders formation taking shape.
EMA cluster: Price is approaching the confluence of the EMA 50, EMA 100, and EMA 200, currently acting as dynamic resistance around 3309–3323. A break above these levels may confirm bullish strength.
Fibonacci retracement: The bounce appears from the 0.874 extension, indicating the end of the previous bearish leg.
Volume analysis: Increasing bullish volume supports the idea of a potential breakout.
- Key Levels to Watch
Zone Type
Price Level (USD)
Remarks
Immediate Resistance: 3,309 – 3,323 - Major test zone; overlaps with EMA 50/100
Major Resistance : 3,337 – 3,340 - Previous high; if broken confirms bullish continuation
Support Zone: 3,299 – 3,302 - Intraday support turned demand zone
Critical Support: 3,284 – 3,285 - Recent swing low; invalidates bullish view if broken
- Intraday Strategy Suggestion
Scenario 1 – Bullish Breakout
Entry: Buy on breakout and retest of 3,309–3,323
SL: Below 3,299
TP1: 3,337
TP2: 3,355
- Confirmation by strong bullish candle closing above EMA cluster and above resistance zone.
Scenario 2 – Buy on Pullback
Entry: Buy limit at 3,300–3,302
SL: Below 3,284
TP1: 3,323
TP2: 3,337
- Look for RSI divergence or bullish engulfing candle at support for higher conviction.
- Final Note
The bulls are attempting to reclaim momentum after a major correction. If gold can sustain above the 3,309 resistance and hold the 3,300 base, a short-term bullish reversal could materialize.

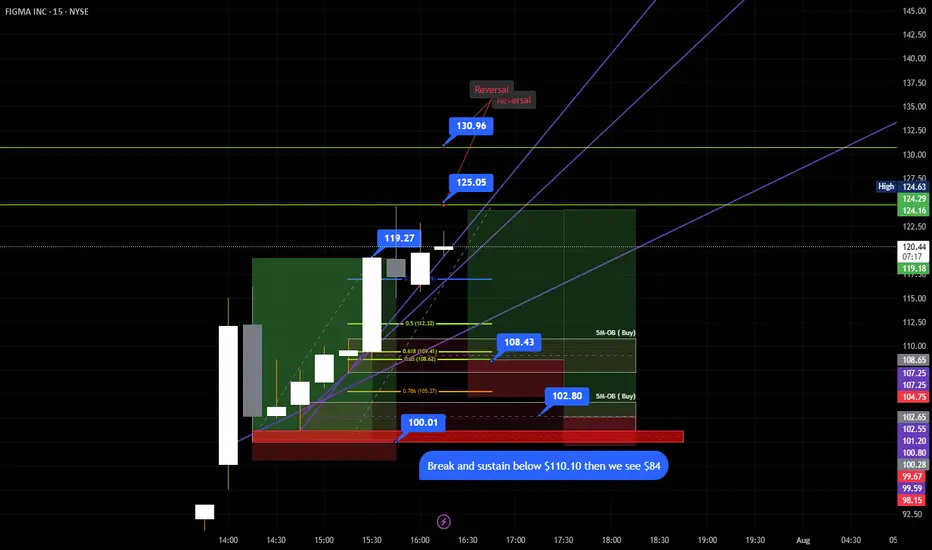
$FIGMA ANALYSIS FOR 08/01/2025Chart says it all. Text me if you have questions.
If the price breaks and sustain $110.10 then we will see $84 or below for sure.
LtcLtc lproject looks promising
Solid owners who define the true value of crypto
I don’t see any reason this turns bearish anytime soon

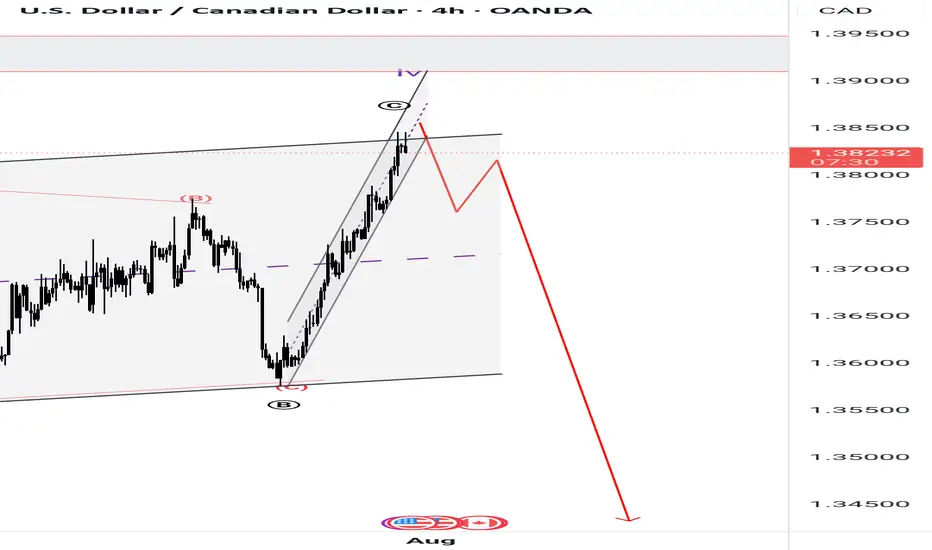
Potential BEARSAfter a prolonged and a complex correction, it looks out to be a FLAT CORRECTION with wave B producing a flat correction as well in a lower degree hence making it all complex. But at the moment we have a perfect channel AB=CD correction which prompts a continuation to the south. Fingers crossed 🤞 as the market rejects a resistance of the channel.
Will BTC ever reach 130k?Yes in your dreams, I am joking, it can but not now, blue shows what fall can trigger when massive selloff happens, and here it looks the smaller momentum to happen soon!
