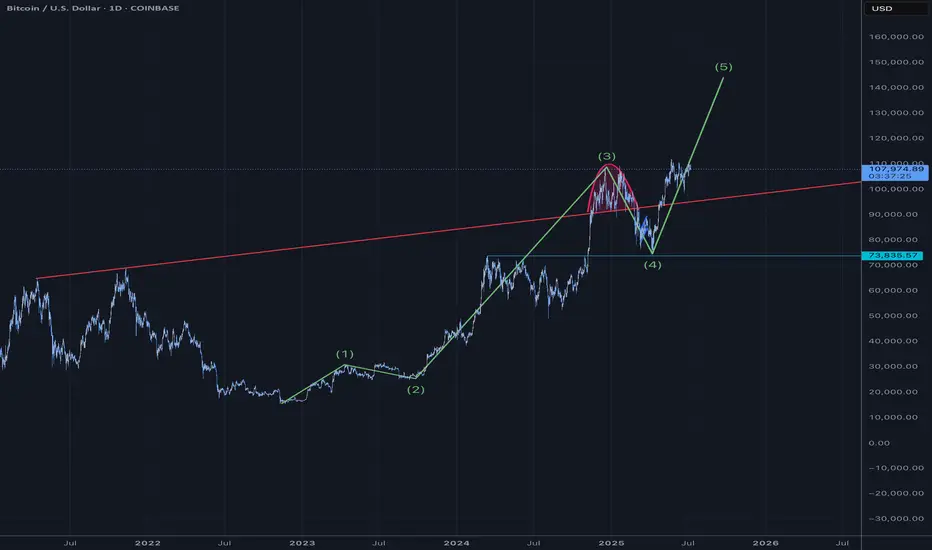
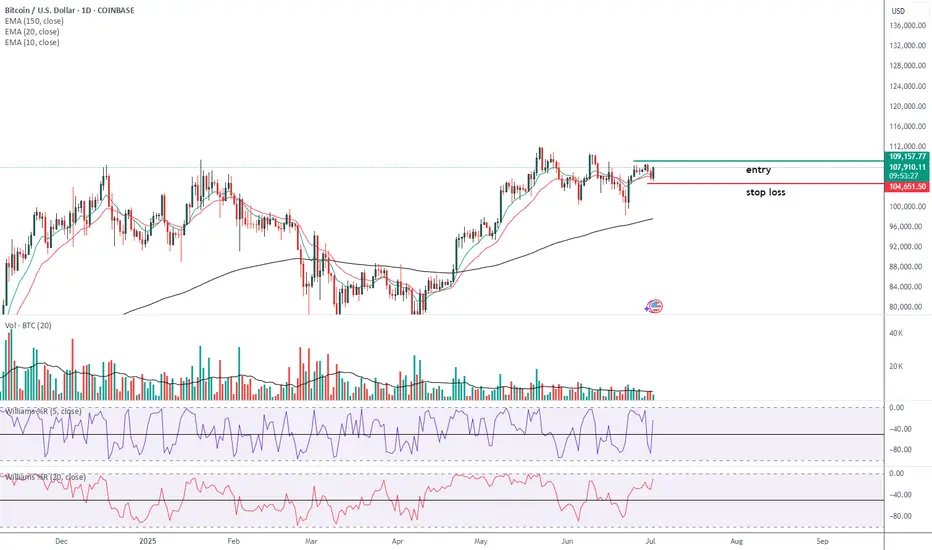
Bitcoin Elliot Wave CountBullish for the next 90 days
Blow off top thesis
Pump into rate cuts and Big Beautiful Bill.
Chart Patterns
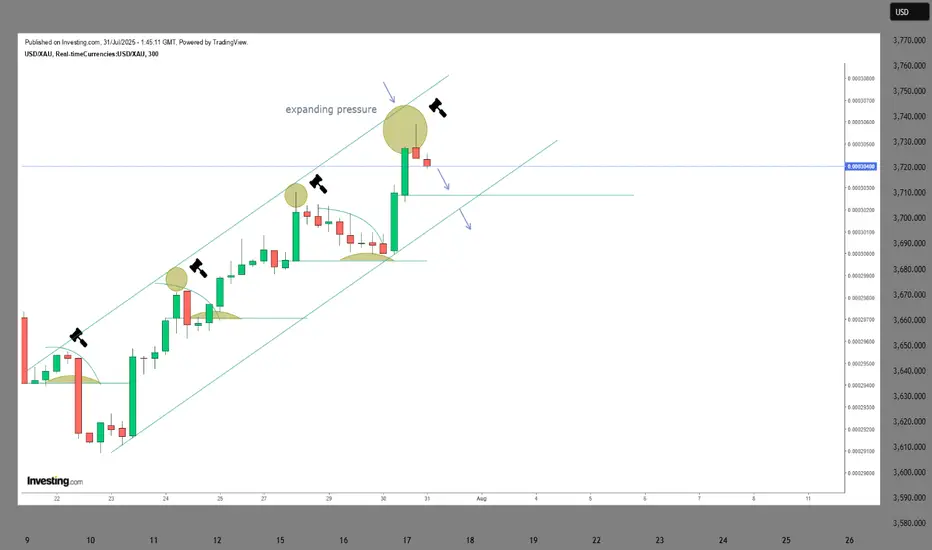
GOLD prep work to ATH retap has started. seed at 3270!First thing first.
Diagram above is in reverse metrics (USDXAU)
--------
GOLD, has been met with some well deserved respite on price growth after a series of parabolic highs this past few weeks. And this healthy trims are warranted in the grand scheme of things -- to sustain its upward trajectory. A price rest is definitely welcomed.
Now based on our latest daily metrics, gold is showing some low key hints of shift -- it may not be visible to 99% of traders -- but it is there now to magnify.
Diagram above is in reverse metrics (USDXAU). It is currently showing some pressure expansion for bears and hinting of prep work to reverse.
This is a precursor of a massive structure change-- for that elusive upside continuation.
On the daily metrics, we got some hop signals here as well from -- first one in a while. Price baselines detaching itself from the descending trend line. There maybe something here now. A good zone to seed on the most discounted bargain levels -- with safety.
Spotted at 3260.
Interim mid target: ATH at 3500
Long term. 4k++
Trade safely.
TAYOR.
Will gold prices continue to fall on August 1st?
Core Logic Analysis
Negative factors dominate
The Federal Reserve's hawkish stance: keeping interest rates unchanged and Powell suppressing expectations of a rate cut have weakened gold's safe-haven appeal.
Strong economic data: ADP employment data exceeded expectations, and coupled with the upcoming PCE and non-farm payroll data, market expectations of an early Fed rate cut have cooled.
Technical Breakdown: Gold prices fell below the key support level of $3,300, hitting a new monthly low. A large weekly bearish candlestick chart indicates bearish dominance.
Key Support and Resistance
Resistance: 3315 (hourly rebound resistance), 3333 (previous high and daily resistance).
Support: 3280-3290 (short-term), 3250-3245 (strong monthly support).
Potential Risks
Unexpectedly weak non-farm payroll data or escalating geopolitical tensions could trigger a short-term rebound, but a break above 3330 is required to reverse the downward trend.
Today's Trading Strategy
Short-Term Trading
Primarily short at highs: Short lightly on a rebound to 3310-3315, stop loss at 3325, target 3290-3280.
Aggressive Short: Add to short positions if the price reaches 3330-3333, stop loss at 3340, target 3280.
Cautious Long: Try a long position on the first touch of 3250-3245, stop loss at 3235, target 3270-3280 (quick in and out).
Mid-term Strategy
If the monthly line closes below 3250, shorting at high levels can be continued in August, targeting the 3150-3100 range.
If the gold price rebounds above 3350 after the non-farm payrolls, the trend needs to be reassessed.
Events to Watch
Data:
Non-farm payroll report on Friday (if the data exceeds expectations, gold prices may fall further).
US June PCE Price Index (Federal Reserve inflation indicator).
Technical Signal:
A daily close below 3250 would confirm a medium-term downtrend.
Observe the recapture of the 3300 level, which serves as a dividing line between bulls and bears.
Summary
Gold is currently in a bearish phase. Prioritize shorting on rallies, but be wary of unexpected data fluctuations. If the mid-line breaks below 3250, the market could target the 3000-3100 range. Conversely, if it holds above 3330, strategy adjustments will be necessary. Strictly stop loss and control risks.
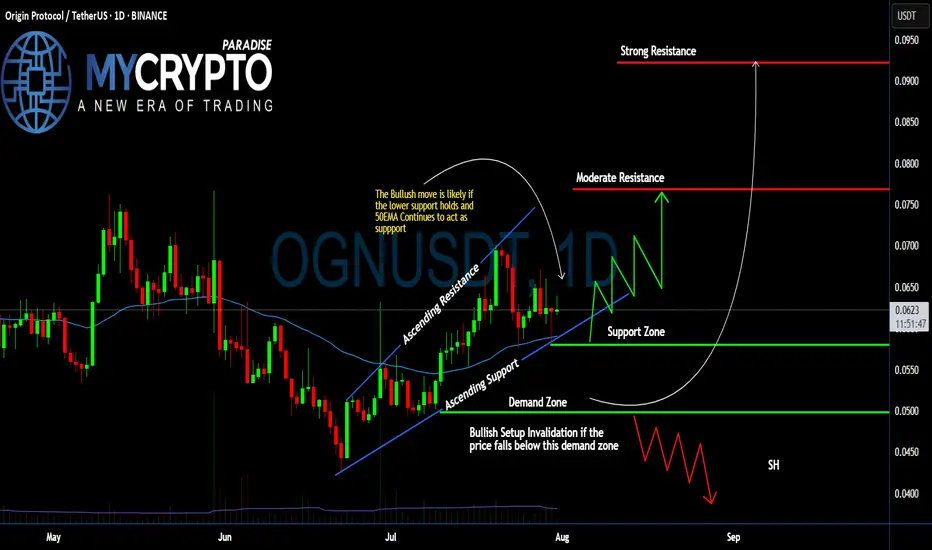
#OGN Ready For a Massive Bullish Move | Must Watch For BullsYello, Paradisers! Is #OriginProtocol about to explode to the upside, or is this a bull trap in disguise waiting to liquidate the impatient? Let’s break down what’s brewing on #OGNUSDT:
💎After forming a clean ascending channel, #OGN has been respecting both the ascending resistance and ascending support levels. Price is currently trading just above the 50 EMA, which has been acting as a dynamic support line since early July. This structure shows clear buyer interest around the $0.058–$0.062 zone—an area that aligns with volume cluster support.
💎The bullish scenario remains valid as long as #OGNUSD holds above the demand zone between $0.0499–$0.0580, and especially if it stays above the 50 EMA. As long as this structure is maintained, we could see a bounce toward the moderate resistance level at $0.076, where previous sellers stepped in and price stalled.
💎If buyers can break through that moderate resistance with strength and rising volume, the next key target lies at $0.092, which aligns with a strong resistance level and high-volume node on the visible range. This area is likely to trigger a reaction, so traders should remain agile.
💎However, if price breaks down below the demand zone, this would invalidate the current bullish setup and open the door for a potential move back toward the $0.045–$0.040 area. A broader shakeout would likely accompany this and could trap many late long entries.
Stay patient, Paradisers. Let the breakout confirm, and only then do we strike with conviction.
MyCryptoParadise
iFeel the success🌴
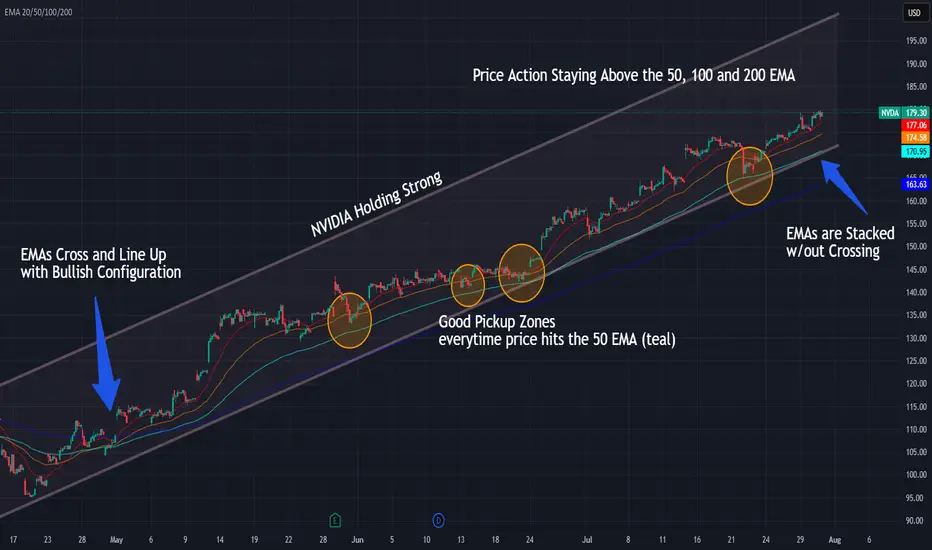
NVIDIA Riding the 50 EMA — Trend Still IntactNVDA continues to respect the rising channel while price holds above the 50, 100, and 200 EMAs — with each 50 EMA touch offering solid entries.
📌 Bullish EMA structure: 20/50/100/200 stacked clean
📌 50 EMA = key support and entry zone
⏱️ Timeframe: 1H
#nvda #stocks #ema #swingtrading #bullishtrend #quanttradingpro #tradingview
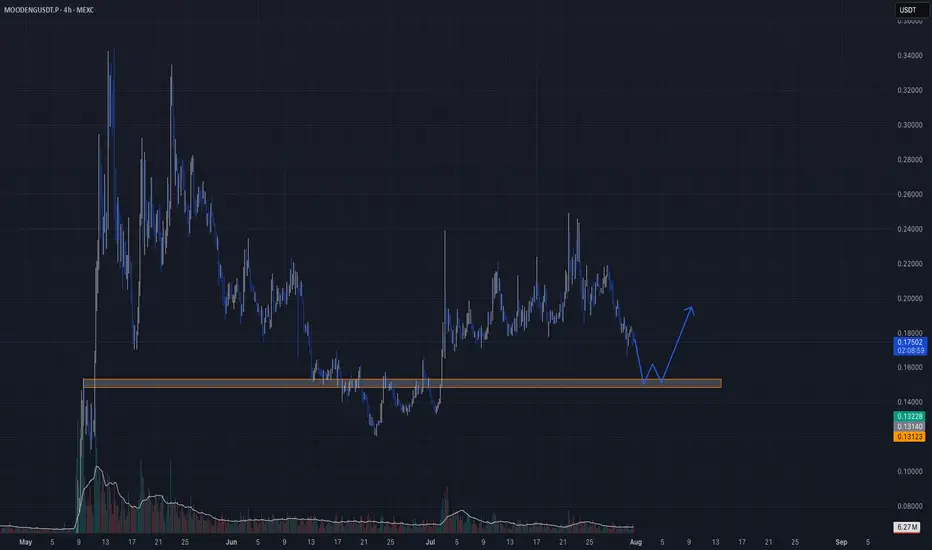
Moodeng Liquidity Grab + ReversalStrategy: Liquidity Grab + Reversal
Entry: $0.15350-$0.15000
Stop Loss: $0.14490
Take Profits: $0.17600, $0.19500
📊 Rationale:
– HTF trend: Range-bound with engineered downside inducement
– LTF structure: Watching for bullish CHoCH after sweep below local support
– Liquidity targeting: Price is likely to run sell-side stops below $0.16000–$0.15000 and reverse from unmitigated demand
🧠 Volume remains calm, OI is stable, and market is setting up for a clean liquidity sweep into a prior reaction zone. Confirmation will follow from M5–M15 CHoCH after the sweep.
⸻
🧠 Stay sharp. Trade smart. Let the market come to us.
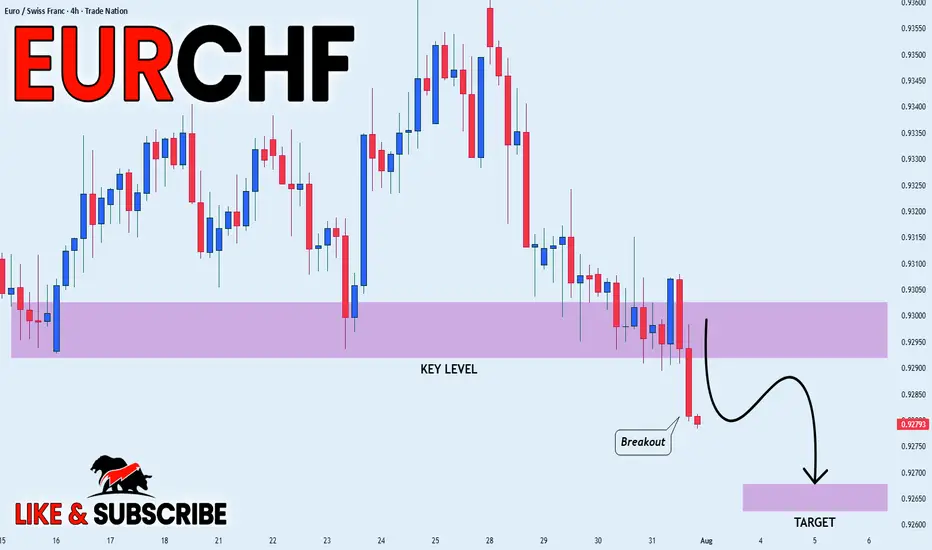
EUR_CHF WILL KEEP FALLING|SHORT|
✅EUR_CHF broke the key
Structure level of 0.9295
While trading in an local downtrend
Which makes me bearish
And I think that after the retest of the
Broken level is complete
A rebound and bearish
Continuation will follow
SHORT🔥
✅Like and subscribe to never miss a new idea!✅
Disclosure: I am part of Trade Nation's Influencer program and receive a monthly fee for using their TradingView charts in my analysis.
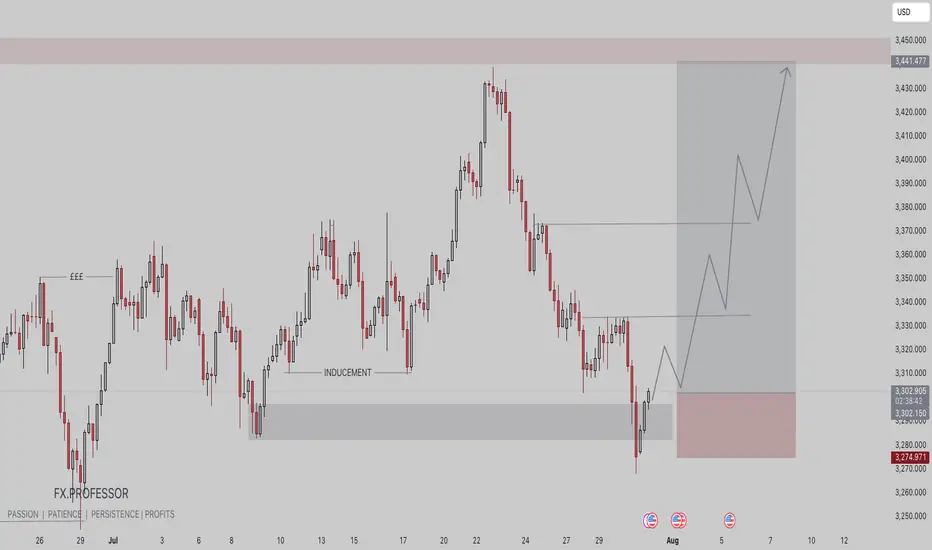
GOLD BUY TRADE IDEA🟡 XAU/USD Smart Money Setup – July 31, 2025
🔍 Key Technical Highlights:
• Demand Zone Entry:
• Price has tapped into a clear demand zone (gray box) around 3,274 – 3,290, signaling potential institutional accumulation.
• The previous inducement low has been swept, aligning with Smart Money Concepts (SMC).
• Liquidity Engineering:
• Equal highs (liquidity pool) visible from late June remain uncollected — a prime upside target.
• Price structure shows internal BOS, suggesting a shift in market sentiment.
• Expected Path:
• A potential multi-leg bullish move is mapped out, targeting the 3,440+ premium zone, completing imbalance fill and stop-run above highs.
• Risk-Reward:
• Stop loss sits just below the demand zone (~3,274), maintaining a favorable risk-to-reward ratio.
⸻
🧠 Smart Money Flow Narrative:
1. Sweep of inducement lows triggers institutional entries.
2. Demand zone holds with bullish reaction — confirmation of intent.
3. Expect higher highs and a rally toward uncollected liquidity above 3,440.
4. Low-risk buy opportunity for both swing and intraday traders.
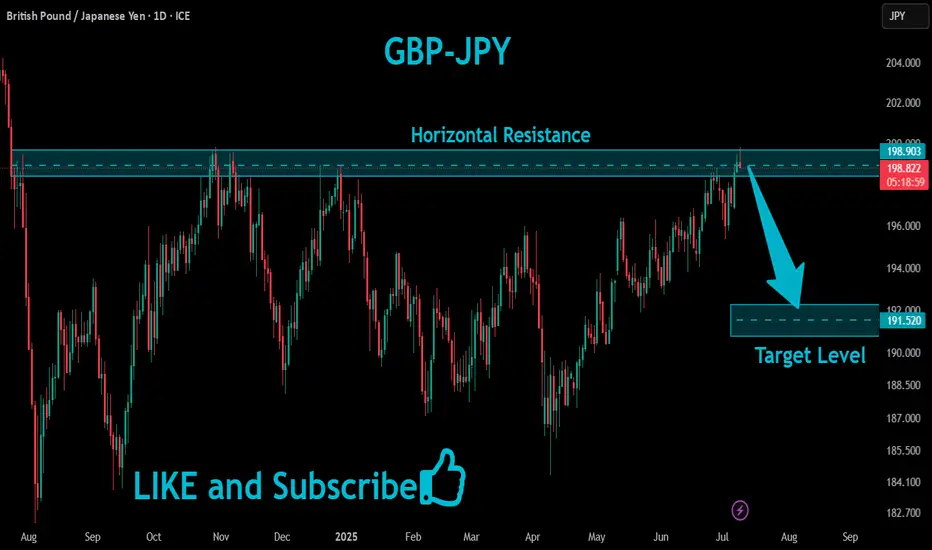
GBPJPY Will Fall!
HI,Traders !
#GBPJPY has retested a
Horizontal resistance level
Of 198.903 so we are
Locally bearish biased
And from the resistance we
We will be expecting a
Local bearish correction !
Comment and subscribe to help us grow !
AVAXUSD at Support ? recent brok the resistanceAVAX has recently broken the Support and is likely to reverse from this support area let us see.
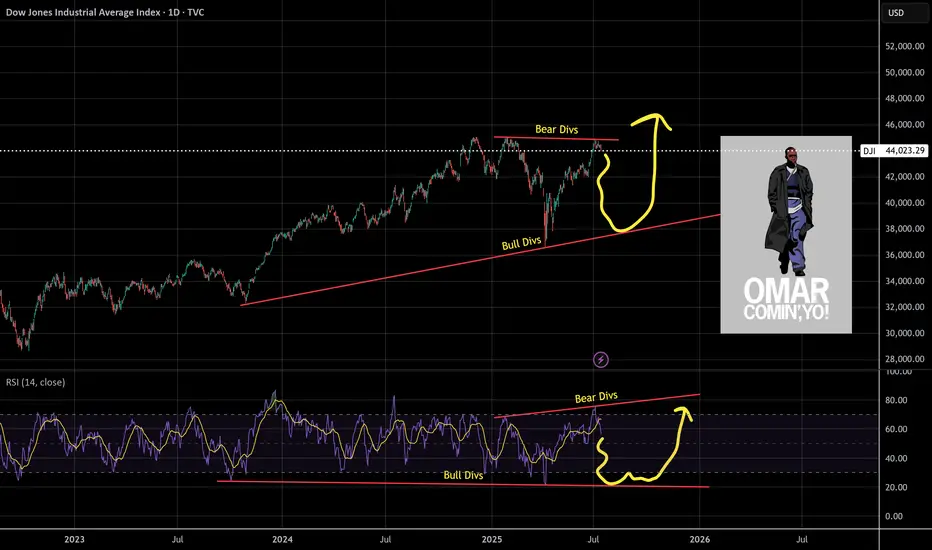
Shakeout On The WayUnlike the SPX, the DJI didn't make a higher-high. Why is this? I think partially because it's price weighted as opposed to market cap weighted like the Nasdaq or SPX. The other part would be CPI numbers.
So what's next for the DJI? I see hidden bullish divs long term and hidden bearish divs short term, this a common shake out tactic I see to liquidate longs and shorts. I'll be looking to load up on the trade at the bottom of the channel and play the range as it develops.
As always: stay calm, don't panic, and don't forget you can always use a stop loss
The fear and green index is at 74, when people are greedy be fearful.
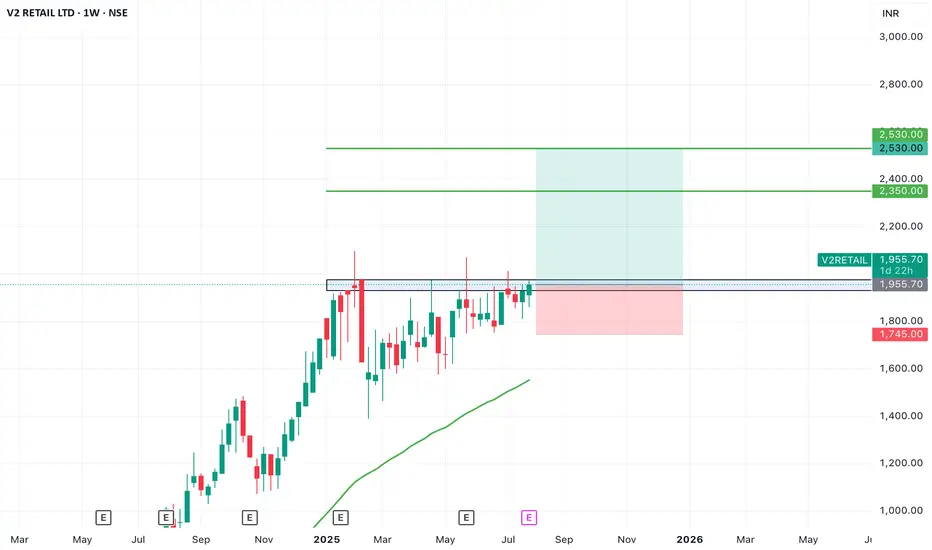
SWING IDEA - V2 RETAILV2 Retail , a small-cap value fashion retailer with a pan-India presence, is showing strong bullish momentum and a textbook swing trade setup backed by multiple breakout signals.
Reasons are listed below :
Breakout from a VCP (Volatility Contraction Pattern) – indicating accumulation and strength
Ascending triangle breakout – classic continuation pattern
Cleared major resistance zone, confirming bullish intent
Maintains a clear uptrend with higher highs and higher lows
Target - 2350 // 2530
Stoploss - weekly close below 1745
DISCLAIMER -
Decisions to buy, sell, hold or trade in securities, commodities and other investments involve risk and are best made based on the advice of qualified financial professionals. Any trading in securities or other investments involves a risk of substantial losses. The practice of "Day Trading" involves particularly high risks and can cause you to lose substantial sums of money. Before undertaking any trading program, you should consult a qualified financial professional. Please consider carefully whether such trading is suitable for you in light of your financial condition and ability to bear financial risks. Under no circumstances shall we be liable for any loss or damage you or anyone else incurs as a result of any trading or investment activity that you or anyone else engages in based on any information or material you receive through TradingView or our services.
@visionary.growth.insights
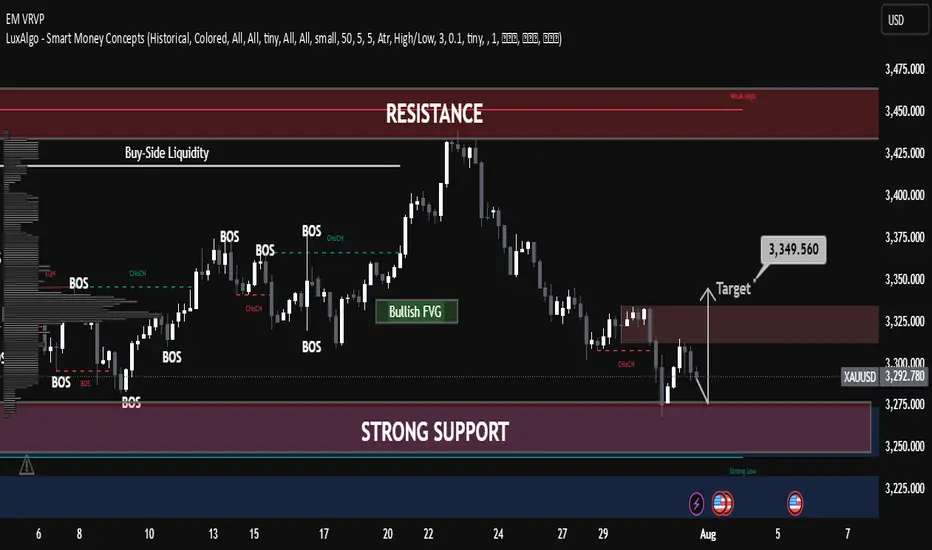
XAUUSD Smart Money Technical Analysis – Bullish Potential XAUUSD Smart Money Technical Analysis – Bullish Potential from Strong Support
Gold (XAUUSD) is currently trading around $3,291.780, showing a potential bullish reversal setup from the strong support zone after a clear liquidity sweep and market structure shifts.
🔍 Key Technical Highlights:
✅ Strong Support Zone (Demand)
Price is reacting from a major demand zone (Strong Low) between $3,275 – $3,225, a level that previously triggered bullish rallies.
Multiple Breaks of Structure (BOS) and CHoCH indicate previous bullish control and a possible re-accumulation phase.
✅ CHoCH Near Support
A recent Change of Character (CHoCH) around the support area shows the first signs of smart money accumulation.
Liquidity below recent lows has been swept, triggering possible bullish intent.
✅ Bullish FVG (Fair Value Gap)
A clear Bullish FVG remains unmitigated around the mid-range, offering target confluence at $3,349.560.
Price may aim to rebalance inefficiency and fill the FVG as part of the bullish move.
✅ Resistance Zone Above
The resistance area near $3,325 – $3,350 acts as a short-term target for long positions.
Further resistance lies at the Buy-Side Liquidity & Weak High zone around $3,450 if momentum sustains.
🧠 Smart Money Concept Interpretation:
Liquidity Grab: Price dipped into strong demand to collect sell-side liquidity before potential reversal.
CHoCH + BOS Alignment: Indicates the market may now transition into a bullish phase.
FVG as Magnet: Price is drawn toward unfilled value zones—ideal for bullish target projection.
🎯 Trade Idea (Educational Purposes Only):
Bias: Bullish
Entry: Around current zone ($3,290)
Target: $3,349.560 (FVG zone)
Invalidation/SL: Below strong low (~$3,225)
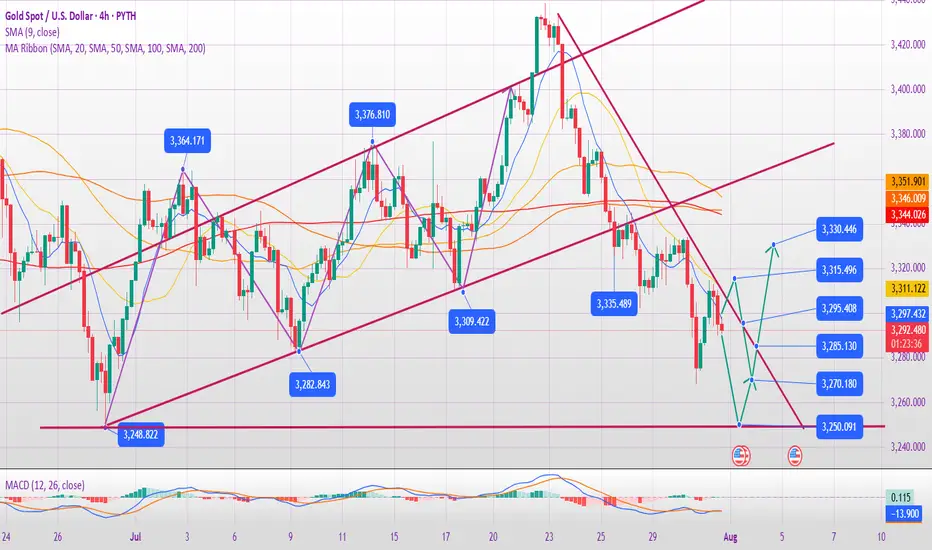
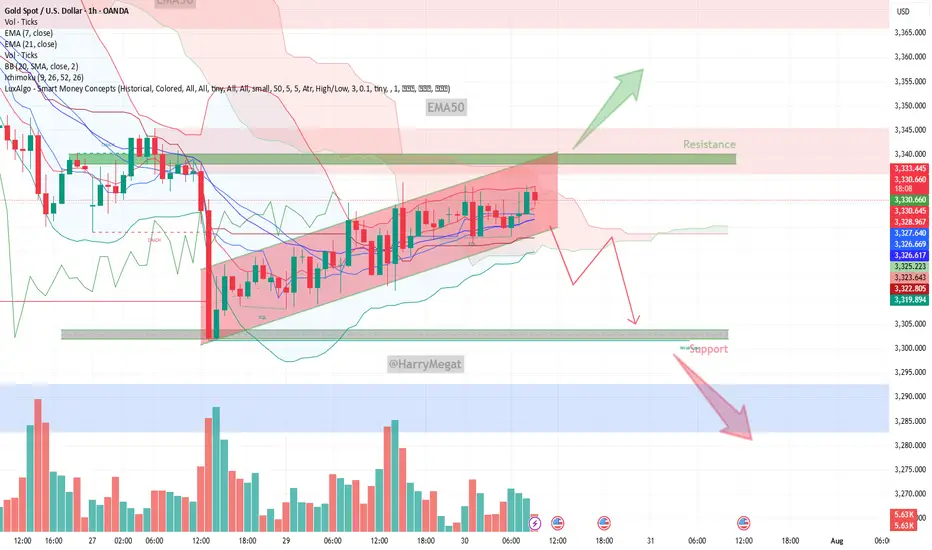
Gold (XAU/USD) on the 1‑hour timeframeGold (XAU/USD) on the 1‑hour timeframe
Chart Structure & Bias
* Price remains trapped in a **rising channel** (\~\$3,328–3,333), pressing against resistance near **\$3,340–3,345**.
* Short-term momentum is bearish: both EMA 7 and EMA 21 sit above current price, with declining volume signaling weakening buyer strength.
* Overall trend leans neutral‑to‑bearish until market clears key zones decisively.
Trade Scenarios
**Bearish Breakdown (Preferred)**
* **Trigger:** Break and close below channel support (\~\$3,326).
* **Targets:** Initial drop toward **\$3,320**, then **\$3,300**, and possibly lower if momentum intensifies.
* **Invalidation:** Price pushes back above **\$3,333–3,335**, negating bearish structure.
**Bullish Breakout (Conditional)**
* **Trigger:** Clean breakout and sustained close above **\$3,342–3,345**.
* **Targets:** Upward stretch toward **\$3,355–3,360**, and if strong, **\$3,367–3,375+**.
* **Invalidation:** Fails to hold structure—retesting from above back beneath **\~\$3,338**.
Macro Drivers & Market Conditions
* Caution prevails pre‑Fed decision and ADP / GDP releases—market awaits cues on interest rate direction.
* Safe‑haven demand has softened as global trade sentiment improves, while U.S. dollar strength continues to cap upside in gold.
* Analysts favor **sell‑on‑rise positioning**, bumping up potential for controlled pullbacks.
Verdict
Gold is consolidating in a tight upward channel, showing short-term bearish pressure. The **bearish breakdown scenario holds the edge** unless price convincingly clears above **\$3,345** on strong volume, which could flip bias. A confirmed break below **\$3,326** sets the stage for downward moves toward **\$3,300** or lower.
USDCAD Analysis – July 16, 2025
Following the ceasefire between Iran and Israel, oil prices have weakened, reducing support for the Canadian dollar, which is closely tied to crude. As a result, CAD could remain among the weaker currencies over the next two weeks.
Meanwhile, the US dollar may gain strength following the CPI data released on July 15, 2025, potentially setting up a favorable swing opportunity for USDCAD bulls.
🟥 High-Risk Setup – R:R 7.0
This aggressive setup targets a sharp upside move with a tight stop loss, aiming for a high reward relative to the risk. It's suitable for traders comfortable with volatility and willing to accept a lower probability for a higher payout.
🟦 Moderate-Risk Setup – R:R 2.5
A more balanced scenario with a wider stop and a closer target, offering a higher probability of success and smoother trade management. This setup aligns well with swing trading strategies seeking consistent results.
Both setups are based on the current price action structure visible on the chart.
Trade safe, manage your risk, and follow your plan. ✅

USDCAD Update: Don’t Sleep on This Uptrend’s First LegYo traders, Skeptic from Skeptic Lab here! 🚀 USDCAD’s serving a hot long trigger for pattern traders chasing the first leg of a big uptrend! We’ve got an ascending triangle breakout on the daily, with bullish candles stacking up, hinting at a return to the weekly bullish trend. Too early to confirm, but the momentum’s fire.
📈 Today’s FOMC meeting’s got everyone buzzing—will Powell cut, hold, or drop resignation hints? Check the full setup in the video, but with crazy news like Federal Funds Rate
, s tick to high-probability trades, keep risk low, and no FOMO or revenge trading! Drop your thoughts, boost if it vibes <3

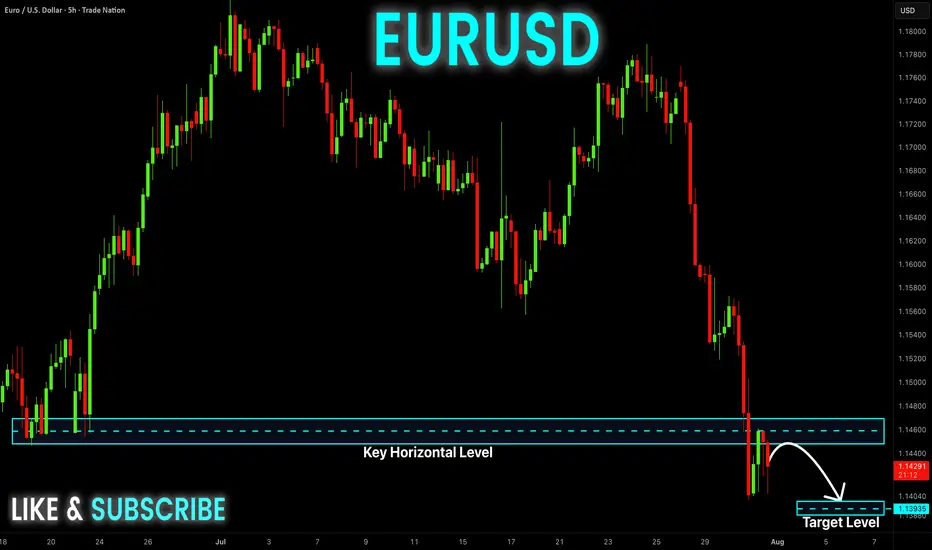
EUR-USD Bearish Breakout! Sell!
Hello,Traders!
EUR-USD made a bearish
Breakout of the key horizontal
Level of 1.1460 then made
A retest and a pullback so
We are bearish biased and
We will be expecting a
Further bearish continuation
Sell!
Comment and subscribe to help us grow!
Check out other forecasts below too!
Disclosure: I am part of Trade Nation's Influencer program and receive a monthly fee for using their TradingView charts in my analysis.
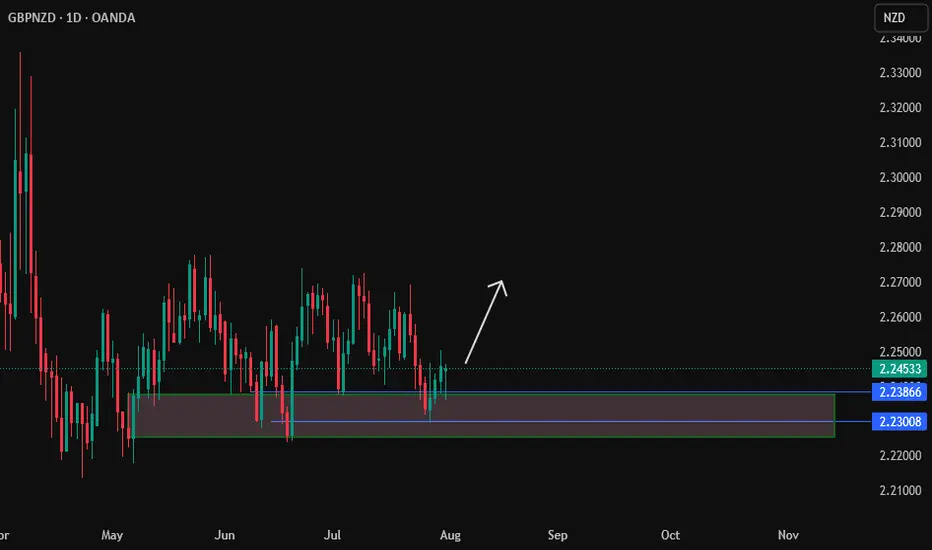
gbpnzdGBP/NZD – Set to Breakdown. Forex Strategy is Bearish: GBP/NZD is currently at 2.2479 in a range. With this breakout, we are looking for a small pullback ..
sl
down support
GBPJPYDate:
July 31,2025
Session:
New York Session
Pair:
GBPJPY
Bias:
Long
Liquidity from Monday's London session was swept in today's (Thursday) New York and London Session. Now I see price following the trend downward.
Entry: 199.080
Stop Loss: 199.387
Target: 198.207
RR: 2.90

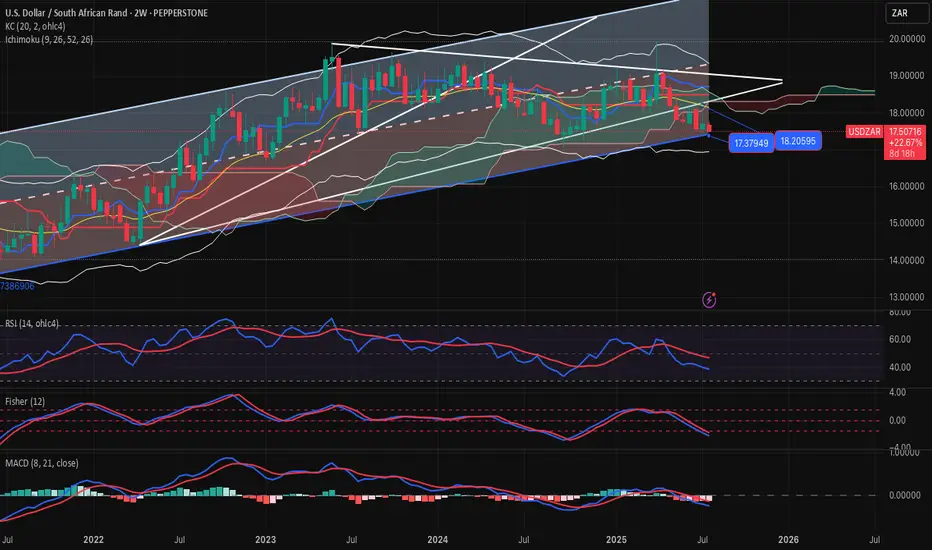
USDZAR-BUY strategy 2-weekly chart Reg. ChannelThe pair is overall on negative mode long-term basis. However, judging the bottom of the channel 17.3700 area or slightly below, BUY entry might look interesting for a recovery medium-term.
Gold is under pressure4 again and medium-term is is overbought, considering that, the pair may find benefit moving back towards 18.1000 area again.
Strategy BUY into 17.35-17.45 region for profit target 18.0975.
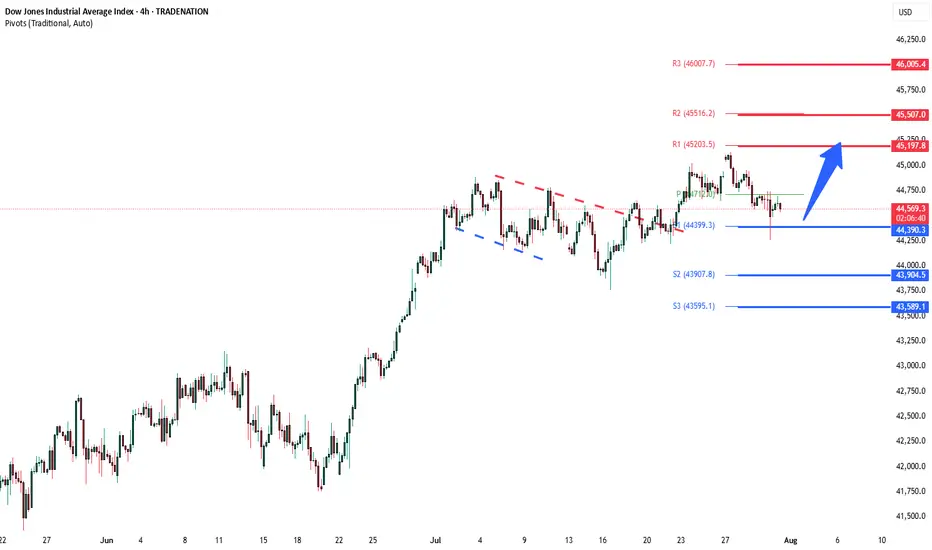
DowJones breakout retest supported at 44390Key Support and Resistance Levels
Resistance Level 1: 45197
Resistance Level 2: 45500
Resistance Level 3: 46000
Support Level 1: 44390
Support Level 2: 43900
Support Level 3: 43590
This communication is for informational purposes only and should not be viewed as any form of recommendation as to a particular course of action or as investment advice. It is not intended as an offer or solicitation for the purchase or sale of any financial instrument or as an official confirmation of any transaction. Opinions, estimates and assumptions expressed herein are made as of the date of this communication and are subject to change without notice. This communication has been prepared based upon information, including market prices, data and other information, believed to be reliable; however, Trade Nation does not warrant its completeness or accuracy. All market prices and market data contained in or attached to this communication are indicative and subject to change without notice.
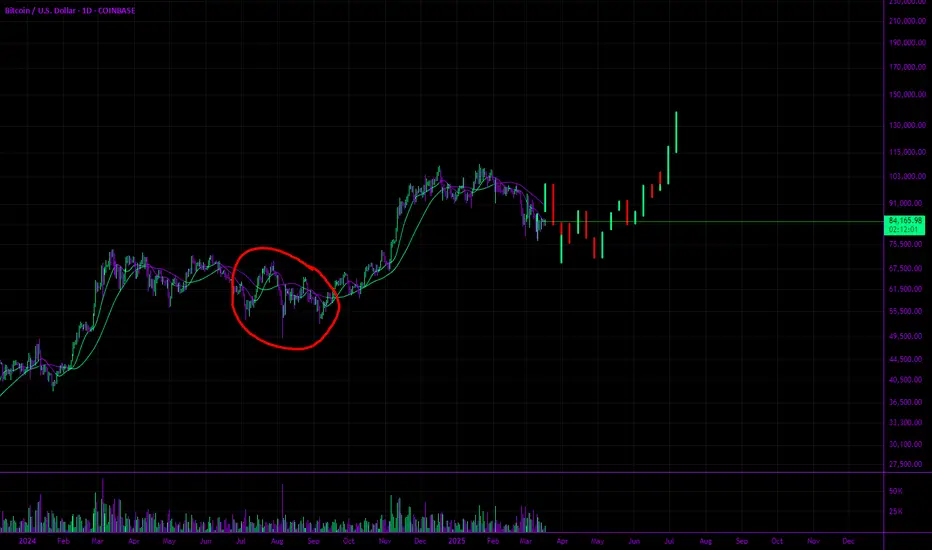
$BTCUSDT: Fictitious Fractal 136KSo. I see we are having a relatively difficult time.
My expectations are in this range for the next appx. 125 days - 365 days.
Downside: 68.6k-69.9k
Topside: 100k to 136k (round to 150k)
I drew this fractal by hand and I want to watch it closely.
I expect in the next few weeks we hit 100k and then do a nice rug to 69k range.
This is probably wrong.
I pretty much extrapolated the red brush circle into a weeks long fractal.
I am longing all the dips to 68k.
Enjoy.
Mr. Storm.