BITCOIN, GOLD ANALYSISQuickly we dive into analyzing our favorite pairs for the day we check and confirmed our directional biased which at the end of the day 1:2 is being targeted. BTC is is in a tricky spot but we will always follow the direction of the market to be more o the safer side.
Chart Patterns

SUIUSD – Snapped Trend, Needs FuelSUI launched off $3.62 support, breaking trendline and 200 SMA around $3.81, reaching $3.95. RSI got hot (~63) and now turning. It’s pausing under resistance, forming a potential flag. $3.89 is key support to hold for next push. Below that risks retracing deeper.

USDCAD Wave Analysis – 31 July 2025
- USDCAD broke resistance zone
- Likely rise to resistance level 1.3900
USDCAD currency pair recently broke the resistance zone located between the resistance level 1.3785 (upper border of the sideways price range from the start of June) and the 50% Fibonacci correction of the downward impulse from May.
The breakout of this resistance zone accelerated the active impulse wave 3, which belongs to medium-term impulse wave (B) from the start of July.
USDCAD currency pair can be expected to rise further to the next resistance level 1.3900 (target price for the completion of the active impulse wave 3).

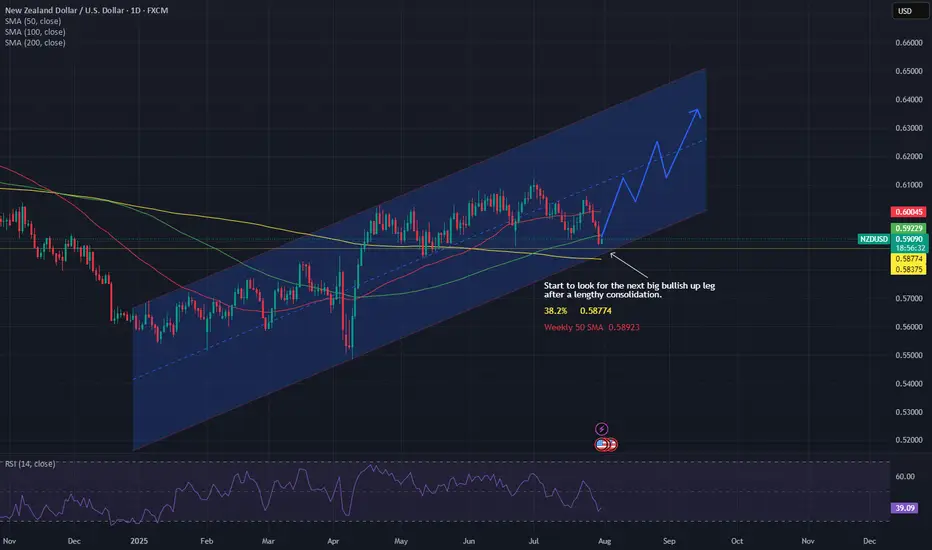
The next NZD Bullish up leg looks ready.NZD has been in a side ways consolidation period for weeks now but as channel support, Weekly 50 MA, Daily 200 MA, 38.2% fib of first up leg all line up, could this be the start of the next big move.
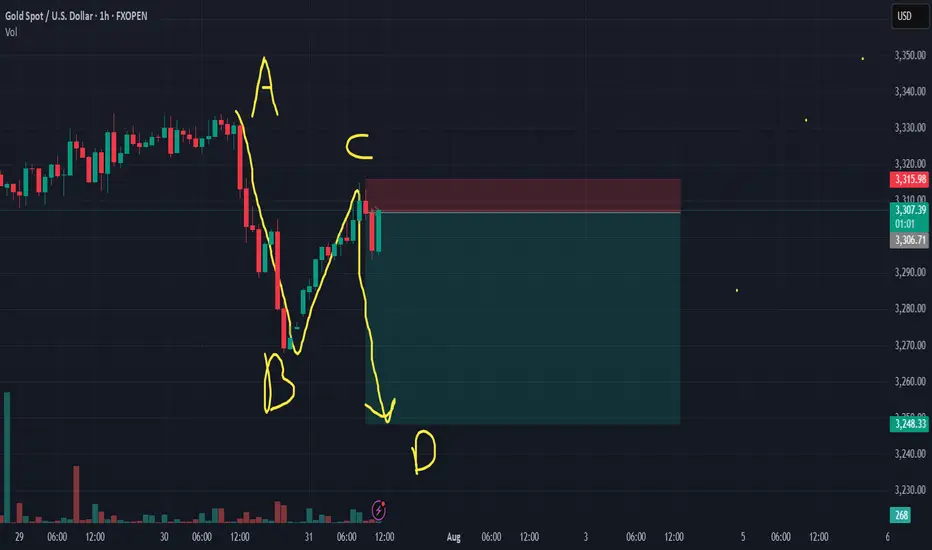
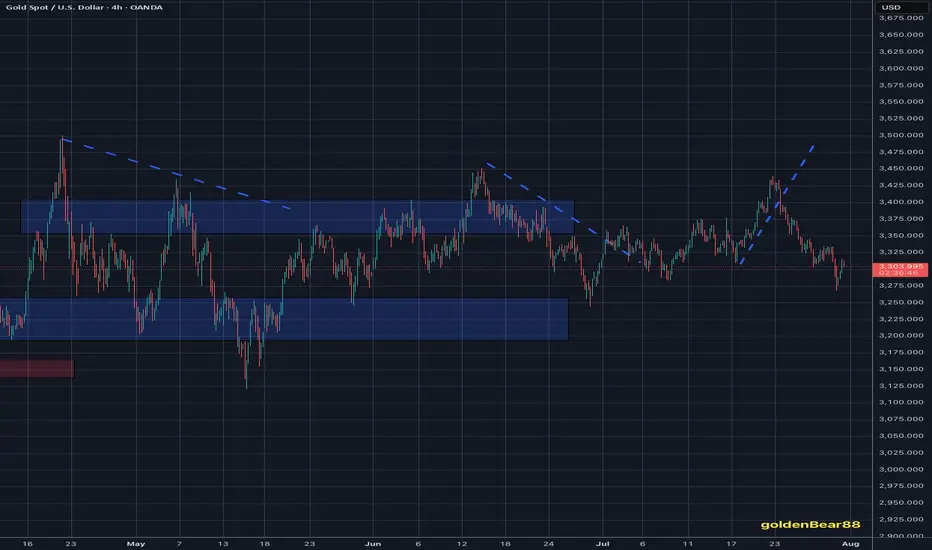
Where is GOLD going next?In the last four months, GOLD privided us a common pattern (for four times) that usually lead to an explosive moves. Where are we going next and what could be the target? In this case, time help us to understand better. The pattern is not complete yet and i expect the move to run in 24 hrs (maybe due to the high impact news will we have tomorrow, like the Initial Jobless Claim and CPE?). Now we just need to understand where the price will go to make profits, and to try to understand this we will check the RSI and the MACD. When this pattern occured, the RSI was rising and above 50 for three times with MACD on bullish cross (the three times that the price pumped) and was chopping and struggling close to 50 (but below it) with a bearish cross on MACD the single time it crushed. If we look at the actual situation, RSI is rising and MACD it's on bullish setup, but i will update you tomorrow (or when a breakout will occur). Now, for the possible target, we can easily aim to $100 move. So, price can touch $3420 for a long or $3240 for a short.
What do you think guys? Let me know in the comments!

Gold Spot / U.S. Dollar Analysis (15-Minute Chart)Key Levels
Support Levels:
Immediate: 3,294.000 (S/L level)
Next: 3,280.000
Resistance Levels:
Immediate: 3,304.000 (Entry level)
Next: 3,308.000, 3,316.250, 3,320.000
Profit Targets:
Tiered levels up to 3,328.000 (highest target).
Price Action & Trends
Current Trend:
The price is bullish (+0.84% today) but hovering near the entry level (3,299.000) and testing 3,302.700.
The presence of multiple profit targets above suggests a bullish bias in the trade setup.
Critical Observations:
Price recently dipped to 3,294.000 (S/L) but rebounded, indicating buying interest at support.
The 3,304.000 level (entry) now acts as resistance. A breakout above could target 3,308.000+.
Volume & Momentum:
Not visible in the screenshot, but the upward movement suggests moderate bullish momentum.
Trade Setup Analysis
Entry: 3,299.000
Stop-Loss: 3,294.000 (5 USD below entry)
Profit Targets:
3,304.000 (Breakeven+)
3,308.000 → 3,328.000 (Scalping opportunities).
Risk-Reward Ratio:
If targeting 3,328.000, the RR is ~5:1 (29 USD profit vs. 5 USD risk).
Actionable Insights
Bullish Scenario:
Hold if price sustains above 3,304.000 (entry resistance).
Next target: 3,308.000.
Bearish Caution:
If price falls below 3,294.000 (S/L), exit to limit losses.
Watch for rejection at 3,304.000 (potential reversal).
Market Context:
Gold is sensitive to USD strength and geopolitical events. Monitor broader trends for confirmation.

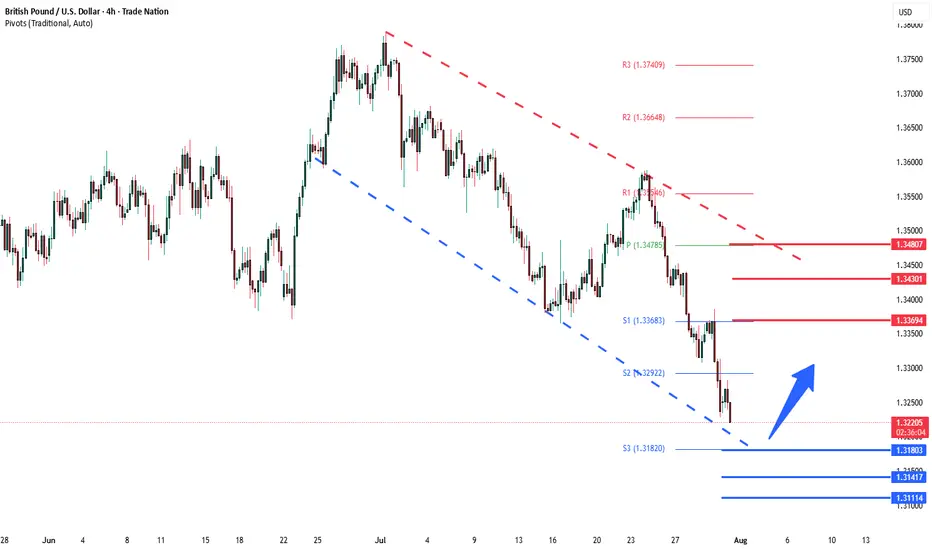
GBPUSD corrective pullback support at 1.3180The GBPUSD remains in a bullish trend, with recent price action showing signs of a corrective pullback within the broader uptrend.
Support Zone: 1.3180 – a key level from previous consolidation. Price is currently testing or approaching this level.
A bullish rebound from 1.3180 would confirm ongoing upside momentum, with potential targets at:
1.3370 – initial resistance
1.3430 – psychological and structural level
1.3480 – extended resistance on the longer-term chart
Bearish Scenario:
A confirmed break and daily close below 1.3180 would weaken the bullish outlook and suggest deeper downside risk toward:
1.3140 – minor support
1.3110 – stronger support and potential demand zone
Outlook:
Bullish bias remains intact while the GBPUSD holds above 1.3180. A sustained break below this level could shift momentum to the downside in the short term.
This communication is for informational purposes only and should not be viewed as any form of recommendation as to a particular course of action or as investment advice. It is not intended as an offer or solicitation for the purchase or sale of any financial instrument or as an official confirmation of any transaction. Opinions, estimates and assumptions expressed herein are made as of the date of this communication and are subject to change without notice. This communication has been prepared based upon information, including market prices, data and other information, believed to be reliable; however, Trade Nation does not warrant its completeness or accuracy. All market prices and market data contained in or attached to this communication are indicative and subject to change without notice.
Excellent Selling opportunities deliveredGold delivered excellent re-Sell opportunities and as soon as DX started gaining value after GDP numbers, I was confident in Selling direction. I have Sold Gold on #3,324.80 towards #3,318.80 first, then #3,310.80 extension. Then I have Bought Gold (aggressive set of Scalping orders from #3,302.80 - #3,303.80 belt) closed on #3,306.80 and pre-Fed set of Selling orders on #3,294.80 - #3,296.80 closed below on #3,280's. Final order was #3,270.80 Buy which I kept towards #3,292.80 Resistance. All in all spectacular session for me and my Traders.
Technical analysis: As discussed, as long as #3,300.80 - #3,305.80 former Resistance holds, I was aware that Gold was more likely to push towards #3,270’s for a #2-Month Low’s test, still however within the Hourly 4 chart’s Buying accumulation zone. This week was / is packed with Fundamental announcements and real trend should be revealed (as today’s session Fundamental catalyst interfered and was already digested by markets), since today’s Price-action delivered the session High test around #3,300.80 benchmark and most likely market will close above it, triggering most of the late Sellers Stop-losses and as Bond Yields reversed and DX printed another series of Bullish candles above the Hourly 4 chart’s Support, Gold again reversed above #3,300.80 psychological barrier and is comfortably seen Trading above it. This shows how unstable market has become and that I should expect side Swings on Short-term, but those are not cause for an alarm as underlying Medium-term trend remains Bullish and I am there ready with my key entry points to Profit on this perfect Price-action for my current Trading model.
My position: I do not expect Gold to continue soaring with DX on such numbers and my practical suggestion is to Sell every High's that Gold deliver (in & out as I prefer to do).
GOLD SHORT10 year bullrun is followed by a shorter term bearmarket. Gold is starting to lose its strength, which is a clear sign of weakness and the beginning of a bearish reversal.

GOLD BUY M15 Gold (XAUUSD) 15-Min Chart Analysis – July 31, 2025
The chart shows a clear bullish structure after a confirmed Change of Character (ChoCH) and Break of Structure (BOS) on the lower time frame. Price has broken above previous resistance zones, indicating strong buying momentum.
Entry Zone:
Price is currently retesting a demand zone (highlighted in pink).
Ideal buy entry was taken after the bullish ChoCH.
Stop Loss:
SL: 3397, placed just below the demand zone for risk protection.
Targets / Resistance Levels:
1. First Resistance: 3308
2. Second Resistance: 3311
3. Third Resistance: 3316
4. Final Target: 3325
Bias:
Bullish, expecting higher highs as long as price holds above the demand zone.
Break and retest strategy is forming, suggesting continuation toward the final target.


EURUSD Bearish Breakout !
HI,Traders !
#EURUSD was trading along
The rising support line but
Now we are seeing a bearish
Breakout so we are bearish
Biased and we will be expecting
A further bearish move down !
Comment and subscribe to help us grow !

GBP/USD Professional Analysis – “Trap Trigger at Support”GBP/USD Professional Analysis – “Trap Trigger at Support”
📈 Market Overview:
• Pair: GBP/USD
• Timeframe: Likely 1H or 2H based on candle spacing
• Date: July 28, 2025
• Current Price: 1.33529
⸻
🔍 Technical Breakdown
🔴 Resistance Zone: 1.35800 – 1.36200
• Strong supply area where the last bullish impulse failed.
• Price got rejected hard, initiating a new downtrend.
• Sell-side pressure was confirmed with Supertrend turning red.
🟤 Support Zone: 1.32860 – 1.33400
• Major demand area where price previously reversed sharply.
• Currently being tested again after a clean sweep into the Trap Trigger zone.
⚠ Trap Trigger Zone (Liquidity Sweep Area):
• Price wicked just below support, tapping into a low-volume/high-liquidity area.
• This wick likely cleared sell-side liquidity and trapped breakout sellers.
• Followed by a bullish rejection wick, implying smart money accumulation.
⸻
🛠 Indicators & Tools:
• Supertrend (10,3): Currently red, indicating short-term bearish momentum.
• However, if price closes above 1.34032 (Supertrend level), it could flip bullish.
• Volume Profile (VRVP):
• Low-volume node under support suggests a quick “stop hunt” move, not genuine selling.
• High-volume acceptance area sits higher, near 1.34500–1.35000.
⸻
🎯 Forecast:
🔴 Bearish Invalidations:
• Price closing below 1.32860 with volume would invalidate this setup.
• That could signal continuation to deeper liquidity (1.32500 or below).
⸻
🧠 Smart Money Perspective:
• Liquidity engineered beneath support
• Trap Trigger activated — ideal for institutional reversal setups
• This is a classic “Stop Hunt → Reclaim → Expand” model

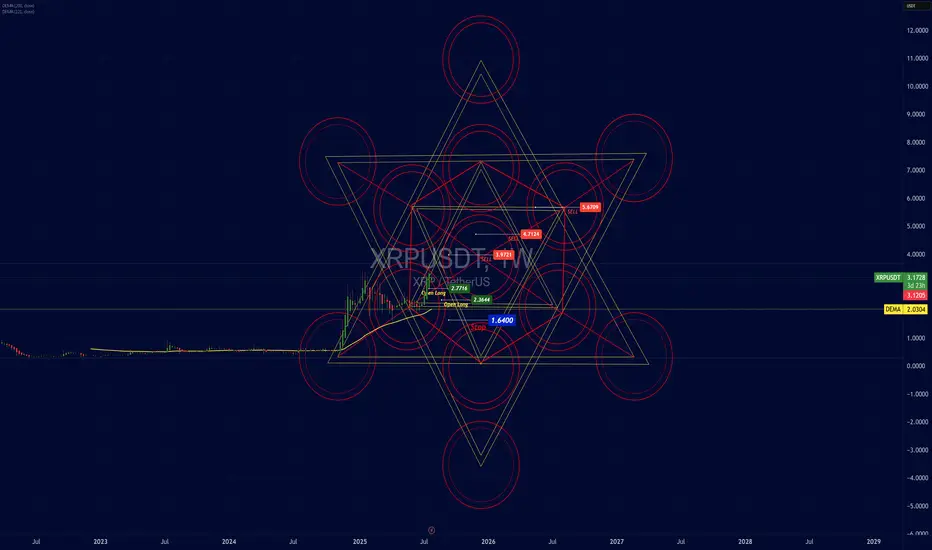
Analytical Geometry Strategy Applied to the Market — XRP/USDTAnalytical Geometry Strategy Applied to the Market — XRP/USDT
Position Trader: Action Based on the Structural Geometry of the Metatron's Cube
Operational Introduction
In medium to long-term strategic positioning (position trading), market entry must not be random or emotional — it must be grounded in predictable zones of symmetry and imbalance.
For that, we apply Analytical Geometry to chart structure, using the Metatron’s Cube — a three-dimensional geometric figure composed of 13 spheres and 78 interlinked vector lines.
The cube is a projection from a six-dimensional hyperplane onto the 2D Cartesian plane. Its application on the chart allows us to:
Delimit areas of vector confluence (support/resistance)
Identify angular energy zones and technical pressure points
Anticipate critical price inflection points based on mathematical symmetry
Structural Application on the XRP/USDT Chart
The projection of Metatron’s Cube onto the XRP/USDT chart reveals:
Entry points (Open Long) located at the lower inner vertices of the cube, where vectors converge toward the central axis — the liquidity attraction point
Supply zones (Sell) aligning with circular and angular intersections of the lines, where multiple vectors overlap — indicating movement saturation and possible redistribution
Stops placed below the angular base, representing a break in symmetry (the point where the vector loses cohesion with the model)
Structural Coordinates (Based on Vector Analysis)
Entry Points (Open Long):
Point A: (x = 2.6444, y = 0)
Point B: (x = 2.7176, y = 0)
Strategic Stop:
Point C: (x = 1.6400, y = -1), just below the lower angular base — a vector dispersion zone
Technical Targets (Supply Zones):
Level 1: x = 3.9721 (first circular layer)
Level 2: x = 4.7124 (72° expansion — common in golden ratio geometry)
Level 3: x = 5.6709 (structural exhaustion zone)
Technical Justification: Why Analytical Geometry Works
Analytical Geometry, developed by René Descartes, allows for the representation of curves, vectors, and spatial structures using numerical coordinates.
Metatron’s Cube functions as a vector mesh over the price chart — translating market behavior into a mathematical language of:
Proportions
Intersections
Angular projections
This approach enables us to:
Model price behavior as a multivariable function
Anticipate reaction zones based on angular and linear symmetry
Protect capital with stops anchored in vector-based rupture zones
Scientific Relevance
Metatron’s Cube is not merely symbolic — it remains actively used in modern physics and aerospace engineering.
At NASA, geometries derived from the Cube are applied to:
Orbital simulations
Spatial perimeter calculations on nonlinear geodesics
Angular mass distribution in interplanetary navigation systems
The same mathematical foundation used to understand celestial body dynamics is used here to identify repeatable behavior patterns in the market — with a high degree of precision.
Technical Conclusion
The market’s geometric structure is not random — it is vectorial, symmetrical, and proportional
Using Metatron’s Cube as a geometric projection allows for rational and coordinated alignment of entry, stop, and target points
The first target has already been validated, proving the structure’s effectiveness
The position remains active, with upper targets defined by vector intersections and angular saturation zones
Closing Insight
"The market’s geometry is the invisible code behind apparent movement. He who understands the vectors, masters the cycles."
This strategic model combines analytical geometry, energetic symmetry, and technical foundation in a unified framework — with precision, logic, and harmony.
XAUUSD and AUDUSD Analysis todayHello traders, this is a complete multiple timeframe analysis of this pair. We see could find significant trading opportunities as per analysis upon price action confirmation we may take this trade. Smash the like button if you find value in this analysis and drop a comment if you have any questions or let me know which pair to cover in my next analysis

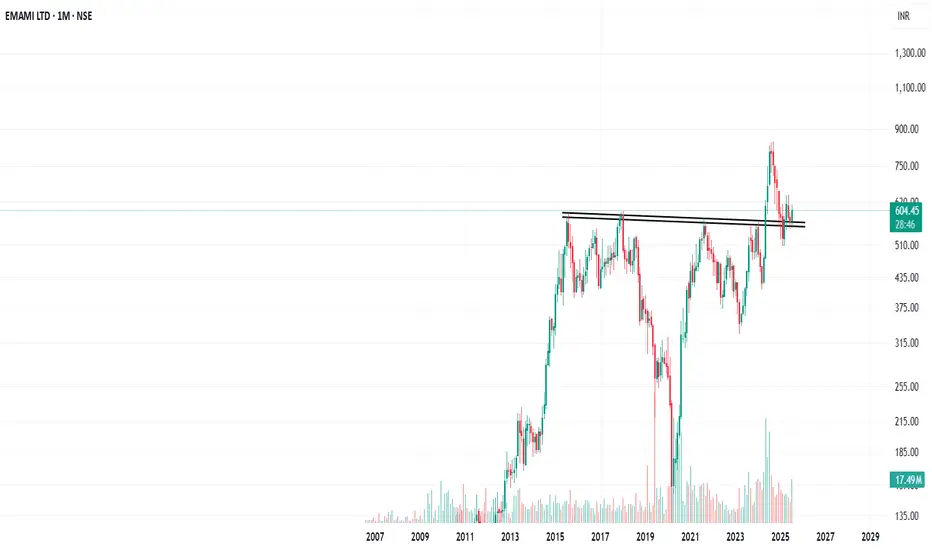
#Emami - a very proising setup for investment betEmami is taking support at the major breakout area. since its a monthly chart, in long term looks good for an investment.
BITCOIN & 134KAfter Bitcoin rallied on July 8 and consolidated for two weeks, this bull flag remains valid, targeting $134,000.

Review and plan for 1st August 2025Nifty future and banknifty future analysis and intraday plan.
Quarterly results.
This video is for information/education purpose only. you are 100% responsible for any actions you take by reading/viewing this post.
please consult your financial advisor before taking any action.
----Vinaykumar hiremath, CMT

1000BONK - Bull Flag in Play1000BONK/USDT Overview (1D Chart)
1000BONK has completed a falling wedge breakout from the 0.0267 low and is showing bullish momentum. Key resistance levels to watch are:
📌 0.0339
📌 0.0408
📌 0.0497
🎯 Target: 0.054

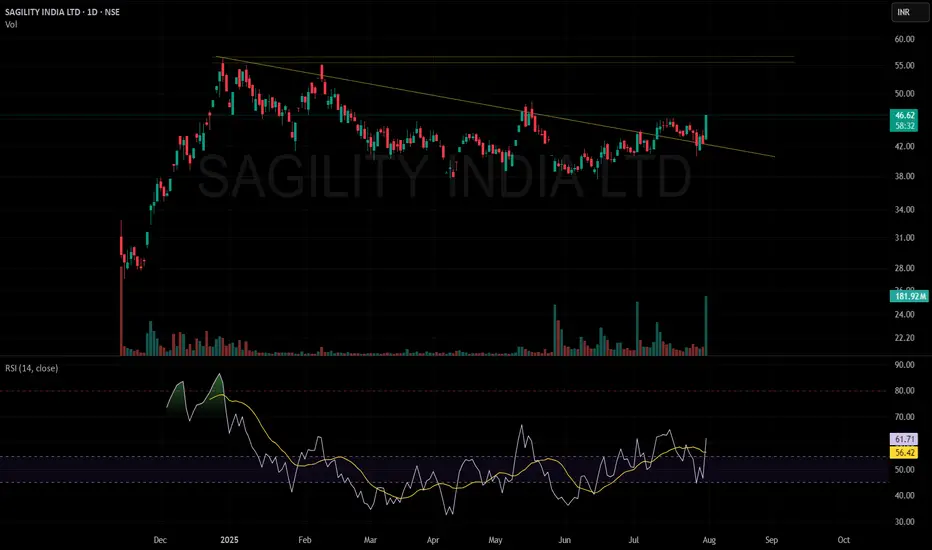
SAGILITY breakoutSAGILITY INDIA LTD
Technical Analysis Overview
Breakout Confirmation: The stock has convincingly broken out above a long-term descending trendline, accompanied by a sharp 9.98% surge in price and a significant jump in trading volume (181.83M). This combination of price action and volume generally indicates strong bullish sentiment and marks a potential trend reversal or fresh upward leg.
Volume Analysis: The highest volume day on the chart aligns with the breakout, suggesting institutional or large participant buying. Sustained higher volumes on up days after consolidations like this often provide additional confirmation of a genuine breakout rather than a false move.
RSI Momentum: The Relative Strength Index (RSI) is at 61.71, displaying strong bullish momentum yet leaving room before entering the overbought zone (typically above 70). This suggests there may still be scope for further upside without being immediately at risk of a major reversal due to overextension.
Trend Structure: After a consolidation phase and repeated attempts at the trendline, the price has managed to close decisively above resistance, indicating that the sellers may be getting exhausted and buyers are now in control.
Strategy & Key Levels
Watch for Retest: A pullback or retest towards the breakout trendline (around the 43-44 level) could present a buying opportunity if the level holds as new support.
Next Resistance Zones: Immediate resistance can be expected at previous swing highs, notably in the 50-55 range, where the stock faced prior selling pressure.
Risk Management: Any sustained move back below the breakout trendline would warrant caution, as it could indicate a failed breakout.
Summary
This breakout, backed by strong volume and improving RSI, indicates a shift in market sentiment in favor of buyers. Keeping an eye on price action around the breakout area and monitoring volume on any pullbacks will be key to validating the strength of this move.
GOLD USDHI GUYS.
H4 CHART here we see on going buys for sculppers and scul [ping sells around the coner.
forcus on the big pictucture more distance more pips as soon as h4 ,h2,h1 forms a (DB)
DOUBLE BOTTOM then we make entries on long position buys to clear upper area(3400,3439).

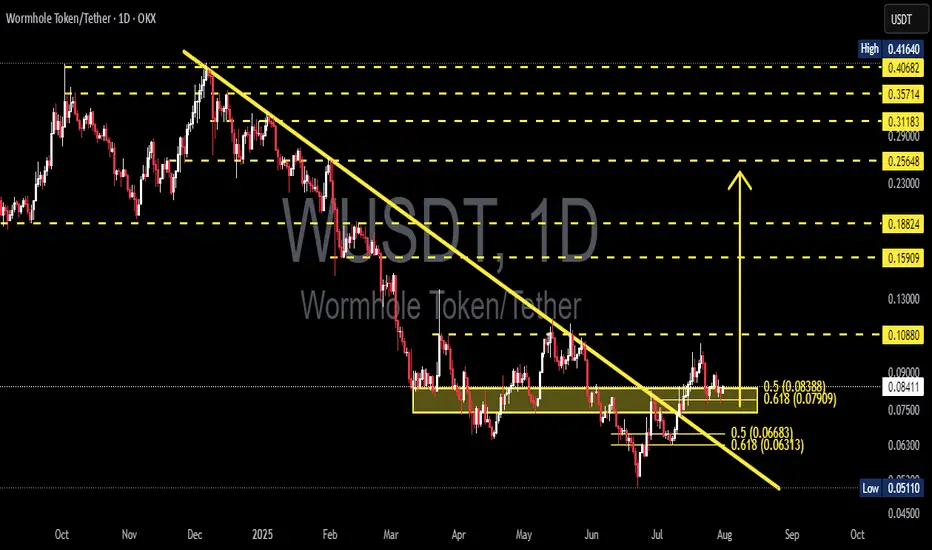
WUSDT Major Downtrend Break! Now Testing the Golden Pocket!🧩 Overview:
Wormhole Token (WUSDT) has finally broken out of a long-standing downtrend line that has been pressing the price down since February 2025. This breakout is a significant technical development and now the price is undergoing a critical retest phase — a moment that could mark the beginning of a major bullish reversal.
Price is currently consolidating around the Fibonacci 0.5–0.618 retracement zone (0.079–0.084), commonly known as the "Golden Pocket Zone" — a popular area for smart money accumulation.
---
🧠 Pattern & Structure:
📉 A long-term descending trendline was decisively broken, signaling a potential shift in market sentiment.
📦 A consolidation range is forming within a yellow support box — between 0.07909 and 0.08388, a prior resistance zone that is now being retested as support.
🔁 This is a classic breakout-retest structure, often seen before major price expansions.
---
🟢 Bullish Scenario (Reversal Potential):
If the price holds above the 0.079–0.084 support range, it sets the stage for a potential bullish continuation. Key upside targets include:
🔹 0.10880 – Previous distribution zone.
🔹 0.13000 – Psychological and structural resistance.
🔹 0.15909 – March resistance.
🔹 0.18824 – Measured move target from breakout.
🔹 0.23000–0.29000 – Expansion zone if momentum sustains.
A strong bullish candle closing above 0.09000 with increasing volume would strengthen this outlook.
---
🔴 Bearish Scenario (Failed Retest):
If the Golden Pocket fails to hold:
Price may retrace to lower supports:
🔻 0.07500 – Minor support zone.
🔻 0.06300 – Key support from June.
🔻 0.05110 – Yearly low and last line of defense. A breakdown below this level would revalidate the bearish trend.
Traders should be cautious if daily closes fall below the yellow zone with high selling volume.
---
💡 Conclusion & Strategy:
WUSDT is currently at a critical technical juncture. A confirmed breakout has occurred, but the retest phase is what will validate the strength of this move.
🎯 Swing traders may look for entries within the 0.079–0.084 range with invalidation below 0.075.
📉 Short-sellers might wait for a confirmed breakdown below this support with volume confirmation.
Momentum is building — the next move could define the mid-term trend.
---
📊 Chart Highlights:
✅ Downtrend Breakout: Confirmed
✅ Retesting Key Fibonacci Zone (0.5–0.618)
✅ Former Resistance → Becoming Support
🚨 Crucial Bullish-Bearish Decision Zone
#WUSDT #WUSDTAnalysis #WormholeToken #CryptoBreakout #GoldenPocket #PriceAction #FibonacciLevels #AltcoinReversal #TechnicalAnalysis