GBPUSD H4 | Bearish continuationThe Cable (GBP/USD) is rising towards the sell entry, which is a pullback resistance that aligns with the 23.6% Fibonacci retracement and could drop lower from this level.
Sell entry is at 1.3317, which is a pullback resistance that lines up with the 23.6% Fibonacci retracement.
Stop loss at 1.3392, which is a pullback resistance that is slightly below the 50% Fibonacci retracement.
Take profit is at 1.3172, which is a swing low support that aligns with the 100% Fibonacci projection.
High Risk Investment Warning
Trading Forex/CFDs on margin carries a high level of risk and may not be suitable for all investors. Leverage can work against you.
Stratos Markets Limited (tradu.com ):
CFDs are complex instruments and come with a high risk of losing money rapidly due to leverage. 65% of retail investor accounts lose money when trading CFDs with this provider. You should consider whether you understand how CFDs work and whether you can afford to take the high risk of losing your money.
Stratos Europe Ltd (tradu.com ):
CFDs are complex instruments and come with a high risk of losing money rapidly due to leverage. 66% of retail investor accounts lose money when trading CFDs with this provider. You should consider whether you understand how CFDs work and whether you can afford to take the high risk of losing your money.
Stratos Global LLC (tradu.com ):
Losses can exceed deposits.
Please be advised that the information presented on TradingView is provided to Tradu (‘Company’, ‘we’) by a third-party provider (‘TFA Global Pte Ltd’). Please be reminded that you are solely responsible for the trading decisions on your account. There is a very high degree of risk involved in trading. Any information and/or content is intended entirely for research, educational and informational purposes only and does not constitute investment or consultation advice or investment strategy. The information is not tailored to the investment needs of any specific person and therefore does not involve a consideration of any of the investment objectives, financial situation or needs of any viewer that may receive it. Kindly also note that past performance is not a reliable indicator of future results. Actual results may differ materially from those anticipated in forward-looking or past performance statements. We assume no liability as to the accuracy or completeness of any of the information and/or content provided herein and the Company cannot be held responsible for any omission, mistake nor for any loss or damage including without limitation to any loss of profit which may arise from reliance on any information supplied by TFA Global Pte Ltd.
The speaker(s) is neither an employee, agent nor representative of Tradu and is therefore acting independently. The opinions given are their own, constitute general market commentary, and do not constitute the opinion or advice of Tradu or any form of personal or investment advice. Tradu neither endorses nor guarantees offerings of third-party speakers, nor is Tradu responsible for the content, veracity or opinions of third-party speakers, presenters or participants.
Chart Patterns

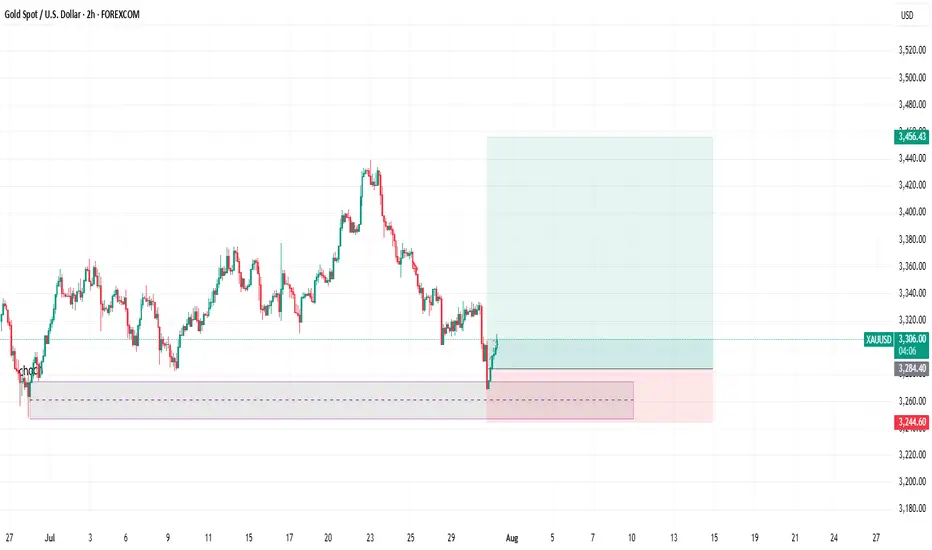
Technical Analysis - Gold (XAU/USD) - 4H ChartI’ve dissected the market using Elliott Wave theory and uncovered key signals that most overlook. Here's my breakdown:
## 📌 **Setup Overview*
I'm tracking a complex wave structure that hints at the final stage of a corrective pattern, setting the stage for a potential bullish rebound.
## 🎯 **Entry Strategy**
I’ve identified a prime buy zone around **3,350USD**—just above current market levels. This isn’t just a number—it's where price action and wave theory converge. High-probability setup with a tight stop. Above 3,380
## 🧭 **Projected Move**
While I’m eyeing short-term upside, the larger wave pattern suggests the potential for a deeper correction targeting the **3120.000 USD** area. I’m preparing for both scenarios to stay ahead of market sentiment.
---

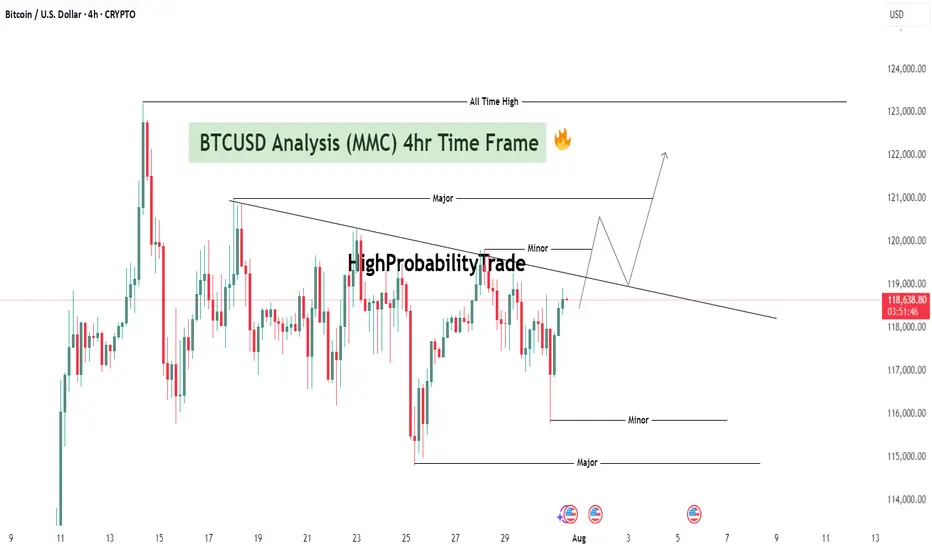
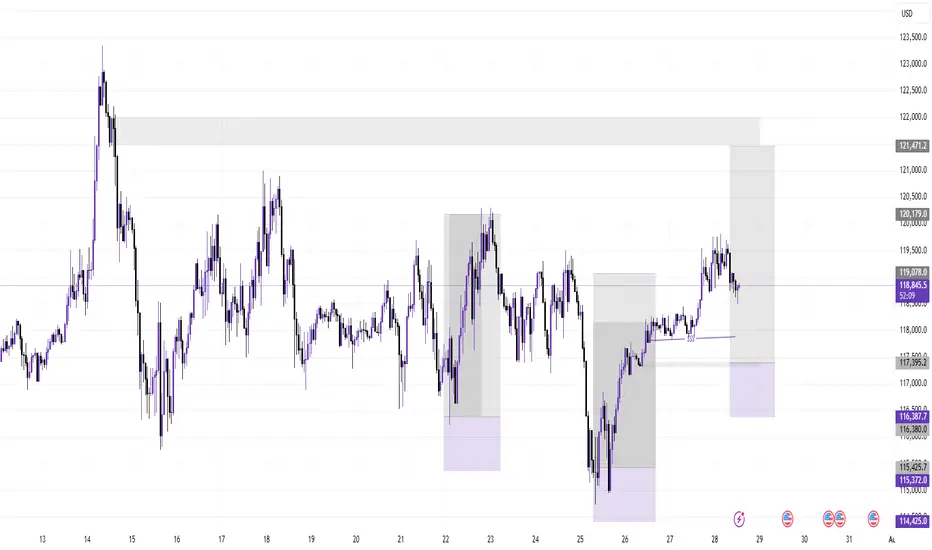
BTCUSD Analysis : Major Breakout Setup | Big Move Loading"Bitcoin Coiling Below Key Resistance – Breakout or Trap?"
🔍 Technical Overview:
Bitcoin is currently trading within a compressed range, sitting just below a key descending trendline that has capped upside movement for multiple sessions. Price is consolidating between minor highs and lows, hinting at a build-up of momentum for the next breakout move.
The setup presents a classic compression inside a bearish wedge, but with increasing bullish pressure evident from higher lows and wick rejections near minor supports.
🧱 Detailed Technical Breakdown:
🔸 1. Descending Trendline Structure
Price has formed a downward sloping resistance line from earlier highs.
This trendline has acted as a dynamic ceiling, rejecting multiple bullish attempts.
Each time price approaches it, the rejection gets weaker, indicating a possible breakout attempt soon.
🔸 2. Multiple Minor & Major Zones
Minor Resistance: Around $118,800–$119,200
A short-term ceiling that has paused bullish rallies.
Price needs a clean break and close above this to initiate momentum.
Major Resistance: ~$121,000–$121,200
This zone aligns with a previous significant swing high.
A break above here could result in strong bullish continuation toward ATH levels.
Minor Support: ~$117,000
Price has repeatedly bounced from this level.
A breakdown would indicate fading bullish strength and open the downside.
Major Support: ~$115,000
A historically strong demand zone.
If BTC fails all bullish attempts, this would be the final defense for buyers.
🧠 Market Psychology Insight:
Price is trapped between aggressive short-term sellers and accumulating buyers.
Buyers are placing confidence in this area by defending higher lows.
Sellers are still protecting the trendline, but with each retest, the defense weakens.
This is a classic equilibrium zone where liquidity is building—once imbalance hits, a strong impulsive breakout (either direction) is likely.
Volume and momentum should be watched closely as a breakout with confirmation may trap the opposite side, leading to a strong move (short squeeze or long liquidation).
🔮 Scenario Forecasts:
📈 Bullish Breakout Scenario:
Price breaks above $119,200 → minor resistance flips to support
Retest of the broken trendline confirms a bullish breakout
Price targets:
First Target: $121,000–$121,200 (major resistance)
Second Target: $122,500+
Third Target: $123,800–$124,000 (All-Time High)
Confirmation Needed: 4H candle close above descending trendline and $119,200 with rising volume.
📉 Bearish Rejection Scenario:
Price gets rejected from the trendline or minor resistance zone
Breaks below $117,000 minor support
Possible targets:
First Target: $116,000 (reaction zone)
Second Target: $115,000 (major support)
A fall below $115,000 could invalidate the bullish buildup and invite strong bearish continuation.
This would signal that bulls failed to reclaim control, and sellers maintain market structure dominance.
📌 Key Levels Summary:
Type Price Range Significance
🔺 All-Time High $123,800–124,000 Final upside target
🔸 Major Resistance $121,000–121,200 Key breakout level
🔹 Minor Resistance $118,800–119,200 Immediate trendline + local supply
🔹 Minor Support ~$117,000 Local demand base
🔻 Major Support $115,000 Last line of defense for bulls
🧭 Conclusion & Strategy:
Bitcoin is approaching a make-or-break zone under a significant descending trendline. Price compression is tightening, and a breakout looks imminent.
Traders should stay patient and wait for confirmation—either a breakout and successful retest for longs or a rejection and trendline defense for shorting opportunities.
Whether it’s a breakout toward $121K and ATH, or a drop toward $115K support, this setup offers a high-probability trade opportunity for both bulls and bears depending on the confirmation.
XAU/USD Intraday Plan | Support & Resistance to WatchGold staged a minor recovery overnight after bouncing from the 3,267 Support Zone, and is now trading around 3,305. Price remains below both the 50MA and 200MA, which continue to slope downward—confirming short-term bearish structure.
This current move is still corrective unless bulls manage to reclaim the 3,309–3,334 resistance zone. A clean break and hold above 3,334 would be the first sign of strength, opening up potential retests of 3,348 and 3,362.
Until then, any rallies into the 3,309–3,334 zone should be viewed with caution. If the bounce loses steam, watch for a retest of 3,289 - 3,267. A break below that would expose the 3,241 and 3,208 levels, with the HTF Support Zone (3,241–3,208) acting as a broader downside cushion.
📌 Key Levels to Watch
Resistance:
‣ 3,309
‣ 3,334
‣ 3,348
‣ 3,362
Support:
‣ 3,289
‣ 3,267
‣ 3,241
‣ 3,208
🔍 Fundamental Focus – Thursday, July 31
Big day for data.
🟥 Core PCE, Employment Cost Index, and Unemployment Claims — all critical for Fed outlook and could move gold sharply.
⚠️ Volatility expected around 2:30pm. Stay nimble and manage risk carefully.

XAUUSD Analysis : Channel Break, Demand Zone + SR - Interchange"High-Probability Zone Reaction & SR Flip Confirmation"
Gold (XAUUSD) is currently reacting from a significant support zone after completing a bearish breakout from a well-established ascending channel. The market structure indicates both threat and opportunity depending on how price behaves around key levels ahead.
🔍 Structure Breakdown & Price Behavior:
🔹 1. Rising Channel Violation
Over the past few weeks, price was comfortably moving inside a well-respected ascending channel, making higher highs and higher lows.
Recently, however, price broke below the lower boundary, which is often a bearish signal—indicating a possible trend reversal or a deeper correction phase.
Such breakdowns suggest buyers are losing control, and bearish sentiment is gaining strength.
🔹 2. Supply Zone Reaction & Drop
Before the breakout, we observed a sharp rejection from a high point, triggering a sell-off.
The price completed its move into a previously defined supply zone, resulting in a strong bearish impulsive leg that pushed it outside the channel.
This move shows clear institutional distribution—where large sellers unloaded positions around that zone.
📍 Key Zone Focus:
🟩 Previous Reversal / Demand Zone (Green Box)
Price is now sitting in a historically strong demand zone, which acted as a major reversal point in the past.
This area is marked as the first zone of interest where buyers might step back in to defend.
The green box represents a liquidity pocket where institutions previously accumulated positions—hence it’s a strong bounce candidate.
🟦 SR Interchange Zone (Blue Box)
The next major level above current price is the SR Interchange zone, around 3,320–3,340.
This level was previously broken and now acts as resistance.
It's crucial because it represents the battle zone where the market will decide whether to continue bearish or shift back bullish.
🧠 Market Psychology & Order Flow Insight:
The recent aggressive selling pressure from the highs, followed by a bounce from the demand zone, shows a shift from euphoria to fear.
Sellers are active at supply, while buyers are attempting to defend the previous demand.
The market is currently in decision mode—and the SR flip zone (3,320–3,340) will be the judge.
A break and retest above this level signals strength and potential for a trend resumption.
A failure to reclaim it would confirm bearish dominance and open doors for deeper targets.
🔄 Possible Scenarios Ahead:
📈 Scenario 1 – Bullish Rejection & Breakout:
If buyers successfully hold the 3,280–3,260 demand zone and push price above the SR Interchange zone, we can expect:
📍 Target 1: 3,360 (mid-term resistance)
📍 Target 2: 3,400–3,420 (previous high & upper trendline)
This would confirm a fakeout from the channel and a bullish continuation pattern.
📉 Scenario 2 – Failure at Resistance & Drop Continuation:
If price fails to reclaim the interchange zone, expect a retest of the green demand, followed by a potential drop toward:
📍 3,260 – local support
📍 3,240 – major support (unfilled demand below)
📍 3,220–3,200 – ultimate downside target
This would solidify a bearish market structure, confirming the sellers are in control.
🧭 Key Levels To Watch:
Level Type Price Range Significance
Supply Zone ~3,400–3,420 Major institutional selling area
SR Interchange (Blue) ~3,320–3,340 Critical resistance / flip zone
Current Price ~3,297 Watching reaction for momentum shift
Demand Zone (Green) ~3,280–3,260 Key support / bounce zone
Major Demand Pending ~3,240–3,220 Next support level if drop continues
✅ Conclusion:
Gold is at a critical inflection point.
The recent bearish breakout signals weakness, but the current support zone may provide a short-term bullish setup if buyers defend it effectively. A successful reclaim of the SR flip zone will shift sentiment bullish again. Otherwise, a deeper correction is likely.
This setup is ideal for both swing and intraday traders—look for confirmation signals at the current support and SR zone before executing trades.

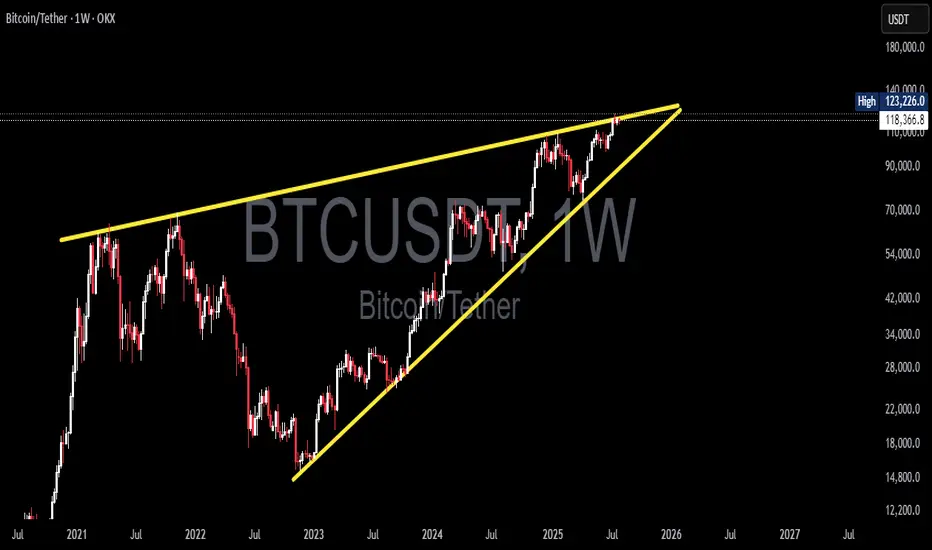
Bitcoin at a Decisive Moment! Rising Wedge Formed — Breakout?🧠 In-Depth Technical Analysis (BTCUSDT – Weekly Timeframe)
Bitcoin is currently trading within a large Rising Wedge pattern, formed over the long term from late 2022 to mid-2025. This structure is typically a bearish reversal formation, although it can also lead to a breakout in strong bull markets.
The wedge is defined by:
Consistently higher lows on the lower trendline
A gradually rising upper resistance line that currently caps price around $123K–$125K
Decreasing volume, indicating consolidation and energy buildup near the apex
This wedge reflects a period of euphoric price action post-2022 bear market accumulation, with price now testing the top of a historically significant resistance zone.
---
📊 Key Price Levels:
🔹 Current Price: ≈ $118,436
🔹 Recent Weekly High: $123,226
🔹 Critical Resistance (Wedge Top): $123,000–$125,000
🔹 Dynamic Support: Rising wedge base (~$90,000–$95,000)
---
🐂 Bullish Scenario: “Historic Breakout Incoming”
If BTC successfully breaks above the wedge’s upper resistance and closes a weekly candle above $125K with strong volume, it would signal a confirmed breakout from the long-term wedge structure.
📈 Upside Targets:
🎯 Target 1: $140,000
🎯 Target 2: $155,000+ (based on Fibonacci extension and macro targets)
🚀 A breakout of this magnitude may trigger a new parabolic rally, especially if accompanied by:
Increased institutional adoption
Spot ETF inflows
Favorable macroeconomic shifts (e.g., rate cuts)
---
🐻 Bearish Scenario: “False Breakout or Breakdown Risk”
If Bitcoin fails to break out and faces strong rejection from the resistance zone (possibly a false breakout), the rising wedge formation may break down — leading to a steep correction.
📉 A breakdown from this structure often leads to sharp drops due to:
Overextension of the current trend
Distribution phase by smart money
🎯 Downside Targets:
Support 1: $95,000–$90,000
Support 2: $76,000
Major Support: $54,000 (historical demand & EMA zones)
---
🔍 Optional Indicators for Chart Confirmation:
Weekly RSI: Watch for bearish divergence
Volume Profile: Can highlight distribution or accumulation zones
EMA 21/50: Ideal for identifying dynamic support levels in retracements
---
📌 Conclusion:
Bitcoin is at a crucial inflection point within this multi-year Rising Wedge. A confirmed breakout could lead to new all-time highs, while a breakdown may trigger a broad correction. Traders should prepare for high volatility, wait for clear confirmation signals, and manage risk wisely in this pivotal zone.
#Bitcoin #BTCUSDT #RisingWedge #BTCBreakout #TechnicalAnalysis #CryptoMarket #PriceAction #BearishReversal #CryptoSignal #ChartPattern #BitcoinAnalysis #Cryptocurrency
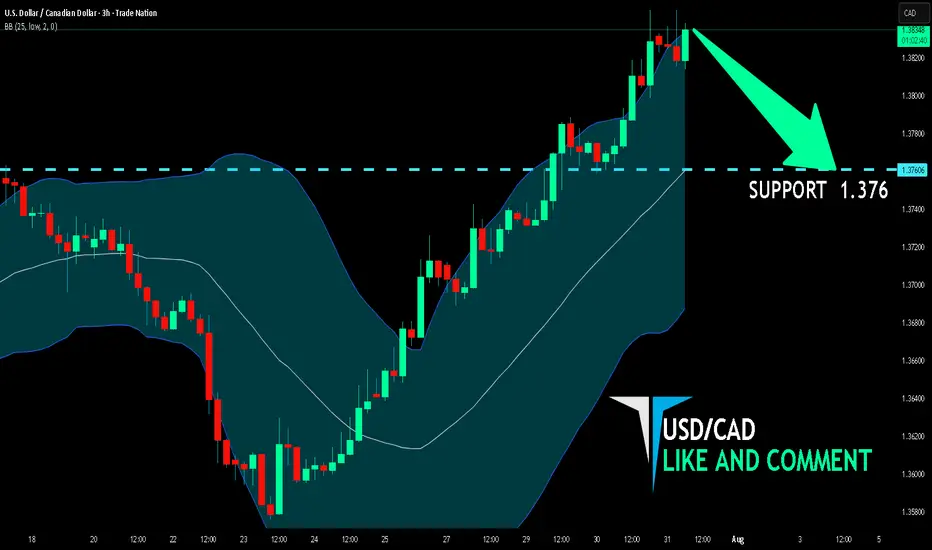
USD/CAD SHORT FROM RESISTANCE
Hello, Friends!
It makes sense for us to go short on USD/CAD right now from the resistance line above with the target of 1.376 because of the confluence of the two strong factors which are the general downtrend on the previous 1W candle and the overbought situation on the lower TF determined by it’s proximity to the upper BB band.
Disclosure: I am part of Trade Nation's Influencer program and receive a monthly fee for using their TradingView charts in my analysis.
✅LIKE AND COMMENT MY IDEAS✅
XAUUSD bullish reversal from a demand zoneThe setup also aligns with a liquidity sweep below previous lows, which could trigger a reversal. Price is now breaking minor resistance levels, creating early confirmation for bullish momentum.
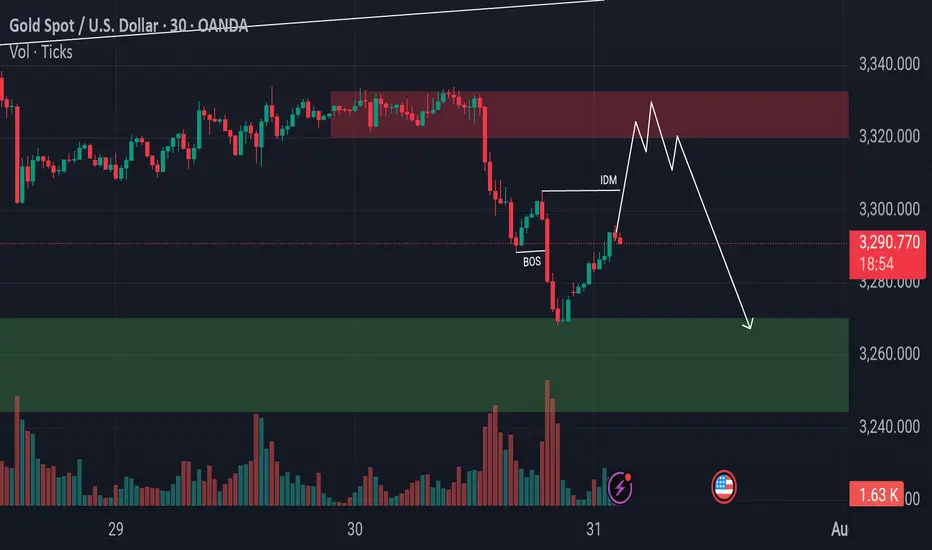
Gold Bulls Charging to 3305 But What’s Waiting There?Gold has recently taken support from the lower levels and has also shown a Break of Structure (BoS) to the downside. Currently, there is Imbalance and Internal Draw on Liquidity (IDM) resting around the 3305 level. The market appears to be moving upward to mitigate that imbalance. It's important to closely monitor this zone, as once the market reaches and fills this area, there is a high probability of a potential rejection or bearish move from that level
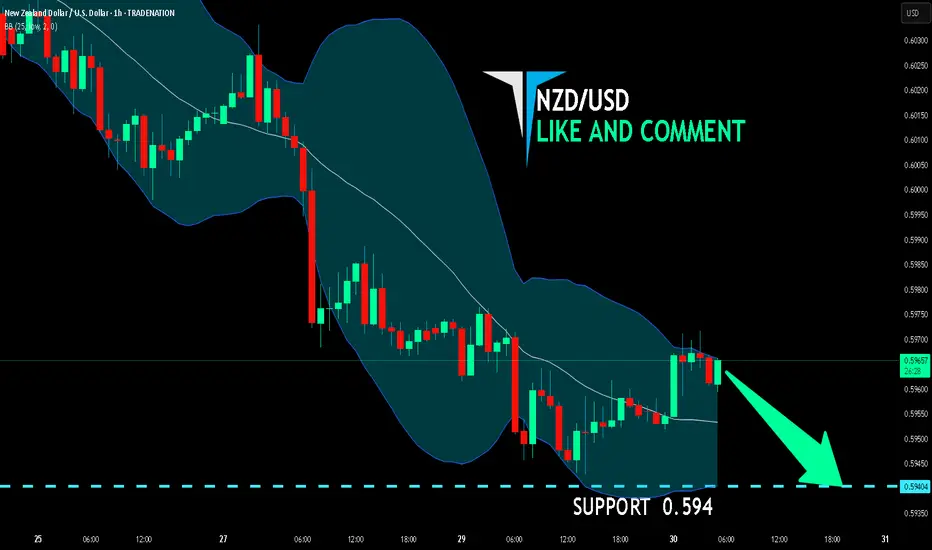
NZD/USD SELLERS WILL DOMINATE THE MARKET|SHORT
Hello, Friends!
NZD-USD uptrend evident from the last 1W green candle makes short trades more risky, but the current set-up targeting 0.594 area still presents a good opportunity for us to sell the pair because the resistance line is nearby and the BB upper band is close which indicates the overbought state of the NZD/USD pair.
Disclosure: I am part of Trade Nation's Influencer program and receive a monthly fee for using their TradingView charts in my analysis.
✅LIKE AND COMMENT MY IDEAS✅
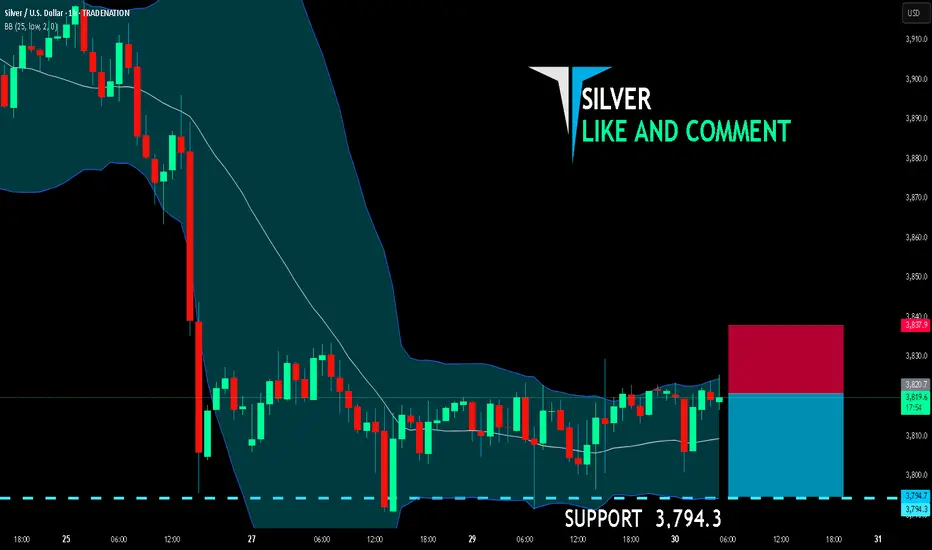
SILVER SENDS CLEAR BEARISH SIGNALS|SHORT
SILVER SIGNAL
Trade Direction: short
Entry Level: 3,820.7
Target Level: 3,794.3
Stop Loss: 3,837.9
RISK PROFILE
Risk level: medium
Suggested risk: 1%
Timeframe: 1h
Disclosure: I am part of Trade Nation's Influencer program and receive a monthly fee for using their TradingView charts in my analysis.
✅LIKE AND COMMENT MY IDEAS✅
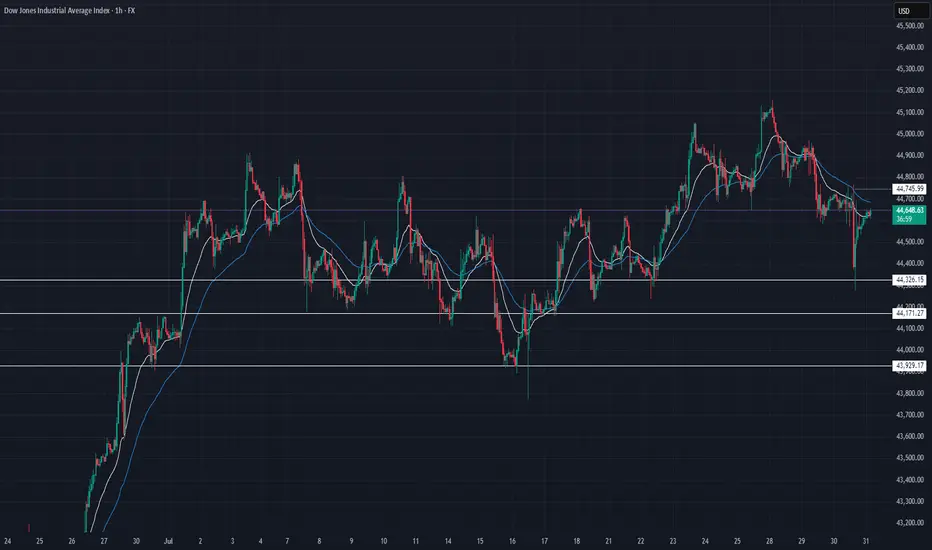
US30 Technical Breakdown – 07/31/2025📍 US30 Technical Breakdown – 07/31/2025
US30 is currently trading at 44,624, showing signs of weakness after failing to hold gains near 45,100. The index has broken down from its recent consolidation range and is hovering just above mid-range support at 44,600.
Momentum has shifted slightly bearish, and price action remains choppy within the broader 44,700–45,000 range. Bulls must defend the 44,600 level to avoid a deeper move into the demand zone below.
📊 Current Market Behavior:
🔄 Choppy consolidation near the lower end of the range
📉 Repeated rejection at 45,100
🧱 Support currently holding around 44,600
⚠️ Downside pressure increasing – caution warranted
📌 Key Levels:
🔹 Resistance Zones:
44,745–44,800 → Immediate intraday ceiling
45,000 → Psychological resistance
45,100 → Previous swing high / heavy rejection area
🔹 Support Zones:
44,600 → Immediate support (currently testing)
44,326 → Strong historical support
44,171–43,929 → Broader demand zone
🧠 Bias:
🔽 Slightly Bearish Intraday
EUR/USD Potential Bearish MoveHi Traders.
1. HTF Expanding Structure
2. HnS Pattern
3. LTF Bearish Impulse
4. Breakout from Structure
Wait for LTF Correction and Breakout to confirm this setup

Waiting Patiently for this bias on BTCUSDWaiting for BTC to come clear the liquidity as shown in my chart setup, then I'm entering for a BUY following the overall trend.
XAUUSD (Gold) Analysis – 1H Chart | July 31, 20251. Fakeout & Rejection from Supply
Price faced sharp rejection near the 3,332 resistance. The strong red candle indicates aggressive selling and liquidity grab.
2. Retest of Broken Demand Zone
Gold is now retesting the **3,298–3,305** yellow zone, which previously acted as demand but may now flip to resistance (supply).
3. Bearish Market Structure
The price formed a **lower high and lower low** pattern — a clear sign of downtrend resumption. Current bounce looks corrective.
4. Projection: Potential Drop Ahead
As per the drawn path, if price fails to reclaim above 3,305, a likely drop toward 3,282, then 3,268 is expected.
5. Key Levels to Watch
Resistance: 3,305 → 3,332
Support: 3,282 → 3,268 → 3,246
Bearish bias remains valid below 3,305.

Gold Trade Plan 31/07/2025Dear Traders,
3304-3307 is very important area for Gold,
Pay close attention to the 3303-3307 zone. If you see a rejection in this area, you can enter a sell position.
if Fix above 3305------> 3351
IF Fix below 3305----->3267 (again)
Regards,
Alireza

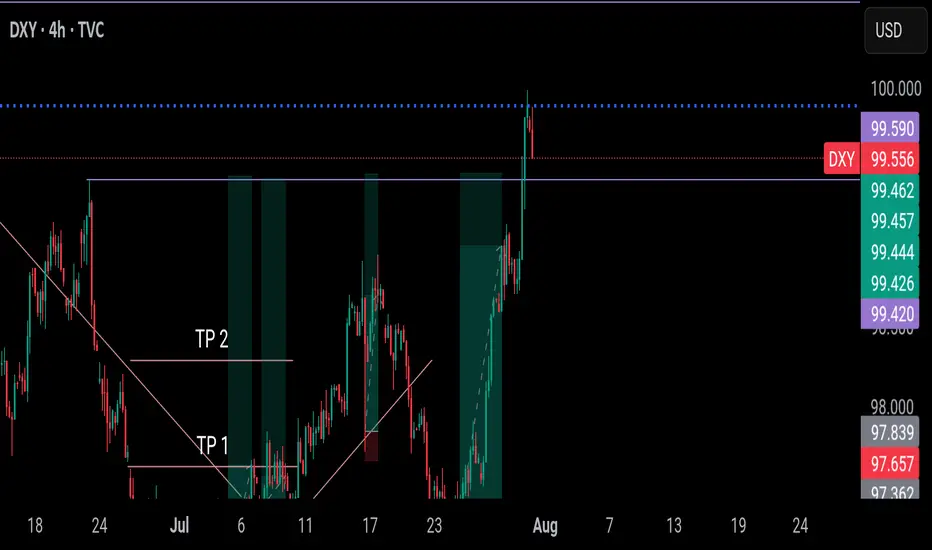
DXY has finally arrived at our final POI. What next?DXY has finally arrived at a point I marked out for you since. I called it out and I was called a madman.
We may experience some downwards pressure and it already started during the Asian session. We have to wait for further confirmation to know if it wants to continue the bullish movement or fall.
Let's be patient for now.
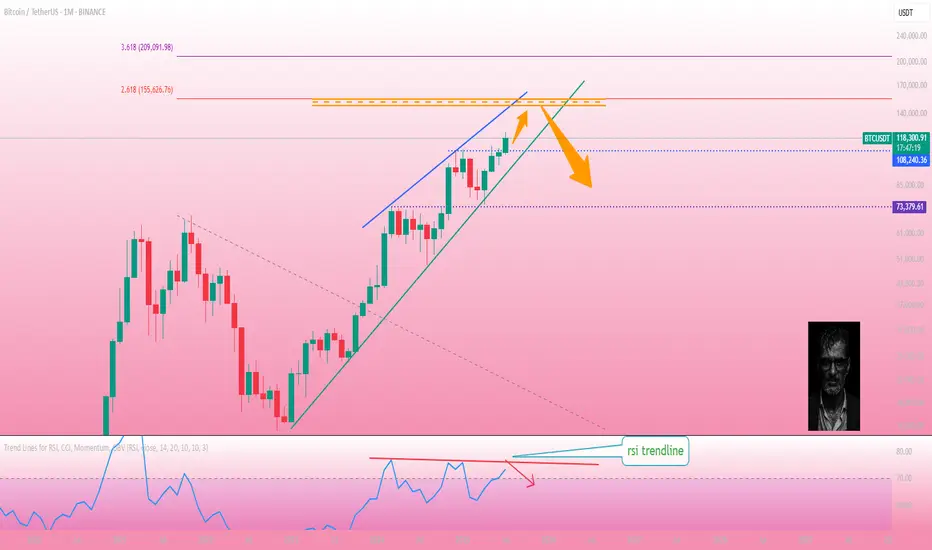
Bitcoin on a monthly time frameBitcoin on the monthly time frame.
If the monthly candle closes in this way, the price is expected to move to the 618 Fibonacci area. According to the trend line in RSI, we will enter a correction phase after the price rises.
GBP/USD 4H Chart Analysis (Bearish Flag) Read the caption📉 GBP/USD 4H Chart Analysis
Pattern Identified: Bearish Flag Pattern
Timeframe: 4-Hour (4H)
Currency Pair: GBP/USD
🔍 Chart Explanation:
This chart illustrates a classic Bearish Flag Pattern, which is a continuation pattern signaling a potential further decline in price after a temporary consolidation.
Downtrend Leg (Flagpole):
The strong and sharp bearish move on the left side of the chart forms the flagpole, indicating aggressive selling pressure.
Consolidation (Flag Formation):
Price enters a rising channel (the flag) which reflects a short-term corrective phase or pullback. This consolidation occurs within the Resistance Zone, suggesting weakening bullish momentum.
Resistance Zone:
Marked in blue, this zone is where the price struggled to break above, and it acts as a ceiling. Rejection from this zone confirms bearish pressure and increases the likelihood of a breakdown.
Breakdown & Target Levels:
The chart shows that price has broken out downward from the flag pattern, triggering a continuation of the prior downtrend.
Two important support levels are highlighted:
🔸 1st Support: 1.33449 – This is the immediate target where price may pause or react.
🔸 2nd Support: 1.32408 – This is the extended target if selling pressure continues.
Ichimoku Cloud (Background):
The cloud behind the price action represents market sentiment. The red cloud suggests a bearish bias aligning with the flag pattern breakdown.
🧠 Technical Summary:
This setup favors a sell-side outlook. The rejection from resistance within a bearish flag and subsequent breakdown confirm bearish momentum. Traders may look for selling opportunities below the flag breakdown with targets at the mentioned support zones.

eurusd buy short termafter yesterday's drop of the euro, today and tomorrow should make a small correction of 100 pips, extending to 150 pips, until the value of 1.1550

Decision Zone for DXY This Week: Around 97.600After a significant downward expansion in DXY, we observed a consolidation around last week's low. This week, the market opened with a pullback.
The first stop for this pullback appears to be the current daily fractal high candle and the weekly bearish FVG on the chart. We can assess potential selling pressure from this area on lower timeframes. We'll be monitoring the wicks within this zone, along with any newly forming FVGs.
If the price breaks above this area, our next points of interest will be the gaps within the zone above the 0.5 swing level, and ultimately the swing high itself as the final target.
Given the current setup, we believe there are promising trading opportunities on EURUSD.
Take care until the next update!

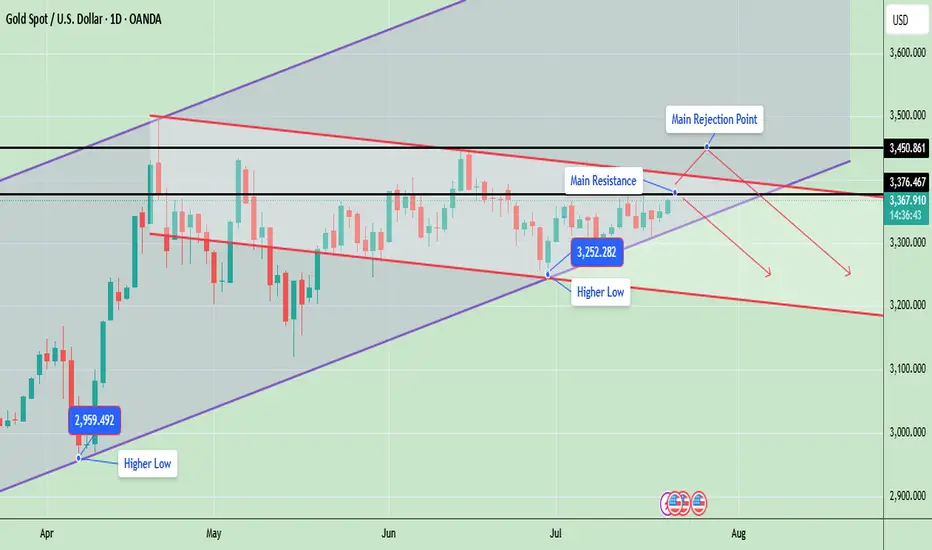
Gold Price Update – Testing Key ResistanceGold is currently trading around 3367, showing strong bullish momentum as it continues to form higher lows, which indicates an ongoing uptrend. The market structure is developing inside a rising wedge pattern, with the price consistently respecting both the ascending support and resistance lines.
Gold is now testing a key resistance zone between 3376 and 3450, an area that previously acted as a major supply zone and caused sharp rejections. A successful breakout and close above 3450 will likely confirm a bullish continuation and may open the door for a rally toward 3500 and possibly 3580. However, if gold fails to break this level, it could retrace back to the 3300 or 3250 support zones, especially if a rejection candle forms in the daily timeframe.
📊 Key Technical Highlights:
- Price has approached the upper resistance boundary of the wedge.
- Daily candle is bullish, indicating strong buying momentum.
- However, unless price closes above 3,376–3,450, there’s still a risk of rejection from the top channel and a pullback toward 3,300–3,250.
🔑 Key levels to watch:
- Gold is currently trading around $3,367, just below a crucial horizontal resistance at $3,376
- A strong breakout above $3,376, and especially above $3,450, could open the door for further bullish movement toward the $3,500–$3,600 range, following the upper trendline of the ascending channel.
- On the downside, if price fails to hold the higher low at $3,252, a drop toward $3,200 or even $3,100 is possible aligning with the downward red trendline.
- The structure remains bullish overall, as price is still making higher lows and staying within the rising channel
📊 Weekly Gold Chart Analysis
Gold is currently trading around $3,368, forming a symmetrical triangle pattern on the weekly timeframe. This pattern typically indicates a period of consolidation before a potential breakout in either direction. The price is getting squeezed between lower highs and higher lows, which is a sign of decreasing volatility and approaching breakout.
🔑 Key Technical Insights:
- ✅ Current Structure: Price has been consolidating within a triangle since April 2025 after a strong upward move. It is now near the apex of the triangle, suggesting a breakout is imminent—most likely in the next 1–2 weeks.
🔼 Bullish Breakout:
- If gold breaks above the triangle resistance (~$3,385–$3,393), it could trigger a sharp rally.
- Upside targets post-breakout: $3,450, $3,500, $3,600+ (if momentum continues)
🔽 Bearish Breakdown:
- A break below the triangle support (~$3,335–$3,325) may lead to a deeper correction.
- Downside targets post-breakdown: $3,285, $3,200
- Possibly $3,100–$3,050 if bearish sentiment intensifies
📉 Volume Drop:
As typical with triangles, volume has likely decreased, signaling indecision. Once volume returns, it will likely confirm the breakout direction.
Note
Please risk management in trading is a Key so use your money accordingly. If you like the idea then please like and boost. Thank you and Good Luck!
Beyond the Chart – GOLD Market Technical Analysis🧠 OANDA:XAUUSD Market Outlook: Gold (XAU/USD)
✅ Bullish Case (Upside Bias)
• Price has reclaimed multiple Fair Value Gaps (FVGs) on the way up.
• Holding above the 0.382 Fib level (3293) indicates moderate bullish momentum.
• A confirmed breakout above 3301 (0.5 Fib) may open the path to key resistance levels:
• 3308 (0.618 Fib)
• 3314 (0.705 Fib)
• 3319 (0.786 Fib)
📌 This move is likely a retracement rally within a broader downtrend — unless price reclaims above 0.786 with strength, confirming a shift in structure.
⸻
🛠️ Trading Plan
• Bullish Setup: Long above 3301, targeting 3308 → 3314, with tight stops.
• Bearish Setup: Look for rejection patterns at 3308–3314 zone, targeting a move back to the 3280 area.
⸻
📘 Disclaimer: This is educational content and not financial advice. Always do your own analysis and manage your risk accordingly
