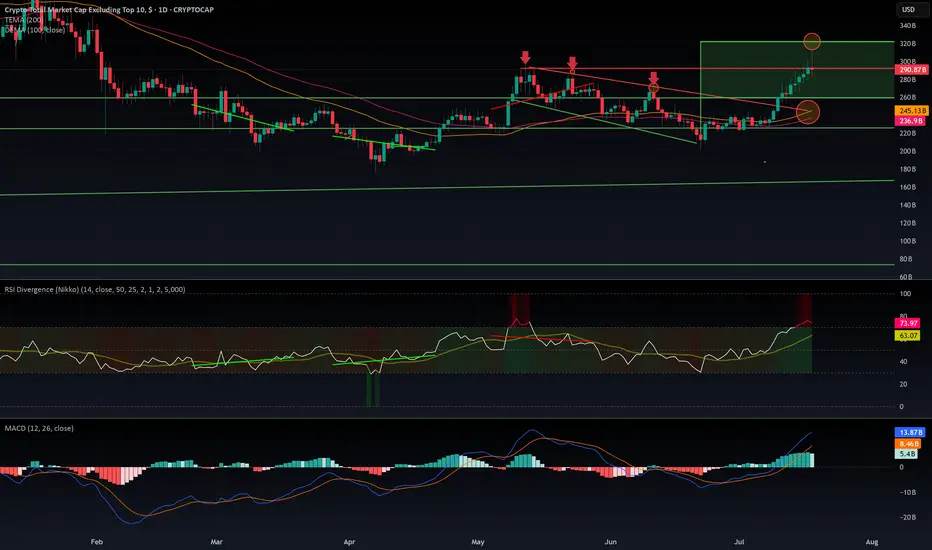
$OTHERS rejected from $320 B resistance. What is next?CRYPTOCAP:OTHERS Rejected at $320B: Is the Altseason on Pause?
CRYPTOCAP:OTHERS just got rejected at the $320B resistance after a decent pump — the kind that usually signals the start of an altseason. But if we dig into the indicators, warning signs are flashing:
- MACD is sitting in overbought territory.
- RSI is heavily extended, signaling potential exhaustion.
- EMA 100 & 200 are colliding with the top of a previous downtrend channel — a zone that historically acted as strong resistance.
The rejection was sharp. So what's next? Are we entering a range between $320B and $260B? It's quite possible. The aIf you wantltcoin market now sits at a decision point: either it keeps pushing higher or takes a breather — potentially pausing the rally until September.
Historically, August is a slow month in the West. People go on vacation, volumes drop, and markets tend to cool off. This seasonal pattern supports the idea of a consolidation phase before a stronger second leg of altseason kicks off in mid-September and carries into Q4.
I’m not posting too many ideas lately because the market landscape has changed. The new players aren’t just trading — they’re manipulating flows with massive capital to hunt retail liquidity.
They’re also using far more sophisticated tools than our classic MACD and RSI — including AI-powered indicators and multi-layered analytics that are beyond retail reach.
In this new environment, predictions are harder and risk is higher.
🧠 Do Your Own Research (DYOR), stay sharp, and don’t blindly trust social influencers.
Chart Patterns
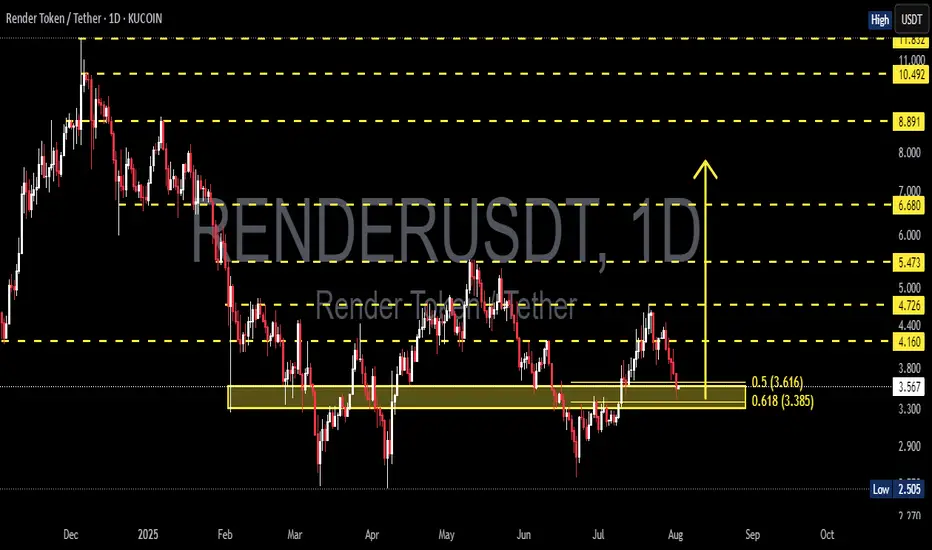
RNDR/USDT at a Critical Turning Point: Golden Pocket as the Key?✨ Overview:
Render Token (RNDR) is currently testing a crucial support zone — the Golden Pocket Fibonacci Retracement between 0.5 (3.616) and 0.618 (3.385). This zone not only represents a significant retracement level but has historically acted as a strong demand area, often serving as a springboard for major price reversals.
---
🧠 Detailed Technical Analysis:
🔸 Support Zone & Golden Pocket
Price has retraced back to the 0.5 – 0.618 Fibonacci zone, a high-probability reversal area.
This zone has acted as a demand base multiple times since February 2025.
How the price reacts here will likely define the next major trend direction.
🔸 Market Structure
The overall structure shows a mid-term downtrend, marked by lower highs and lower lows.
However, the current price action shows slowing bearish momentum, indicating potential hidden accumulation.
A potential double bottom pattern could be forming, hinting at a bullish reversal if confirmed.
---
📈 Bullish Scenario:
1. Strong Rebound from the Golden Pocket
Watch for bullish candlestick patterns (e.g., pin bar, bullish engulfing) near $3.38–$3.61.
Initial resistance levels: $4.16 – $4.72
If broken, mid-term targets could extend to $5.47 – $6.68
2. Double Bottom Confirmation
A confirmed double bottom with a neckline breakout around $4.16 would greatly strengthen bullish momentum.
3. Increased Buying Volume
A spike in volume during the rebound would validate bullish sentiment and potential trend reversal.
---
📉 Bearish Scenario:
1. Breakdown Below the Golden Pocket
If the price breaks below $3.385 with strong volume, we could see a move down toward $2.77, the next significant support.
2. Weak Bounce / Lower High
A failed breakout above $4.16 may indicate a bearish continuation after a temporary relief rally.
---
📌 Summary:
RNDR is currently at a technically sensitive zone. The Golden Pocket between $3.38 and $3.61 is the key area to watch. A strong bullish reaction could signal the start of a trend reversal, while a breakdown could trigger further downside continuation. Traders are advised to wait for clear confirmation via price action before committing to any strong positions.
---
🔖 Key Levels to Watch:
Level Description
3.38 – 3.61 Golden Pocket (Potential Buy Zone)
4.16 Minor Resistance
4.72 Bullish Breakout Trigger
5.47 – 6.68 Mid-Term Reversal Targets
2.77 Strong Support if Breakdown Occurs
---
🧩 Chart Patterns Observed:
Potential Double Bottom – early bullish reversal signal.
Golden Pocket Reaction Setup
Descending Structure – still intact but weakening.
---
🔍 Trade Ideas:
🔄 Wait-and-see approach: Wait for clear bullish confirmation on daily candles.
🎯 Aggressive Long Entry: Around 3.40–3.60 with a tight stop-loss.
⚠️ Short Opportunity: If a strong breakdown below 3.38 occurs with volume confirmation.
#RNDR #RenderToken #RNDRUSDT #CryptoAnalysis #GoldenPocket #FibonacciRetracement #DoubleBottom #PriceAction #SupportResistance #AltcoinSetup #CryptoSignals #TechnicalAnalysis
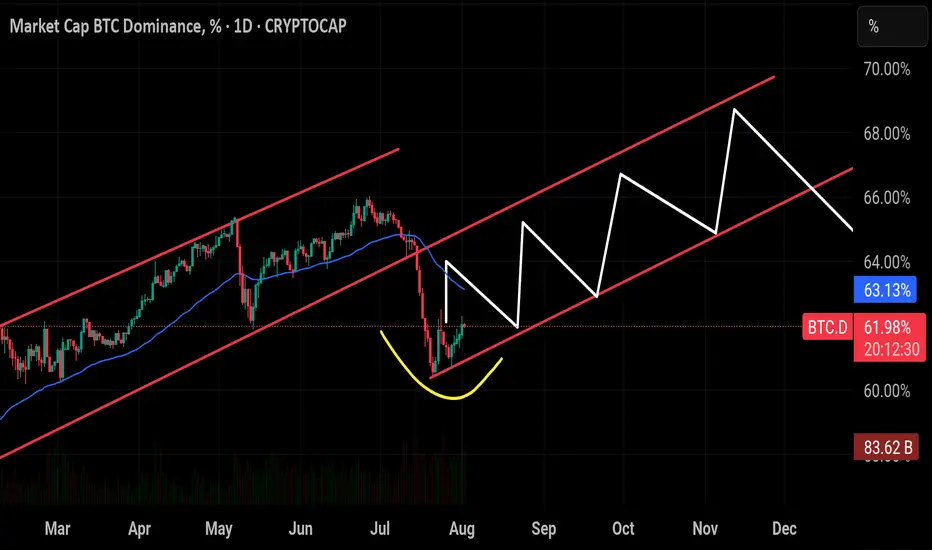
$BTC Dominance seems to be replaying its historical pattern —CRYPTOCAP:BTC Dominance seems to be replaying its historical pattern — after peaking around 66%, it’s now pulling back toward the critical 60% support zone. If the breaks below this level have triggered sharp drops toward 54%, often marking the start of strong altcoin seasons. Unless BTC.D closes back above 65%–66%, history suggests we could see another wave of altcoin outperformance in the weeks ahead. And looking at the chart structure, a breakout in BTC’s price action could align with this cycle, potentially driving Bitcoin toward a new all-time high soon.
ETHUSDTPossible short on ETH, as we know this might be a news dump that caused this blood in the market and might recover very soon, but we broke a key support level, this is the 4HR chart and we will have a better idea what's on the table when weekly close.

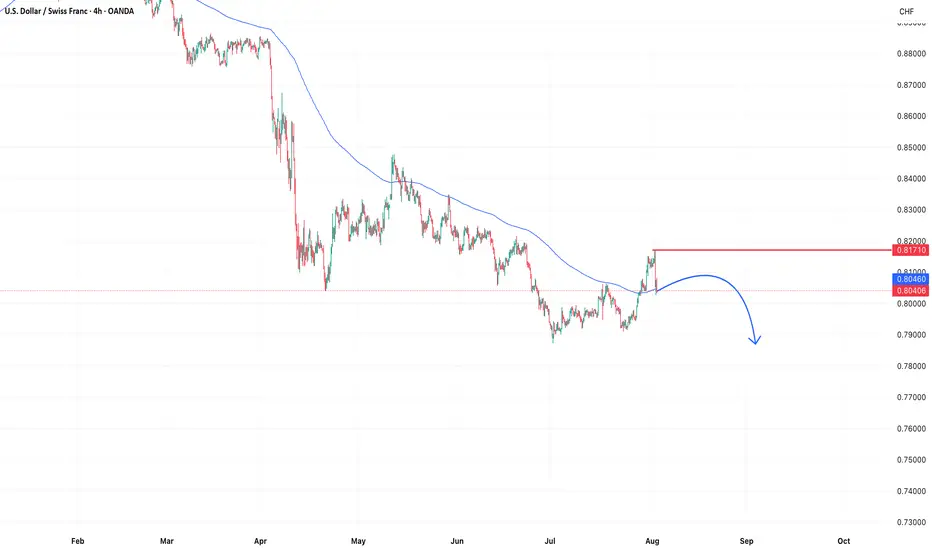
USDCHFUSDCHF is expected to continue its downtrend next week. After a weak recovery attempt, selling pressure remains dominant. Traders should keep an eye on key support zones for potential trading opportunities.
NE - Looking for strong bullish continuationN wave with N, NT & V projection.
Cup & Handle pattern.
The pattern strongly resembles a "Cup and Handle" formation, supported by an N wave structure with Ichimoku alignment.
Cup and Handle Pattern
Cup Shape: Smooth U-curve from Nov 2024 to Jul 2025.
Handle: A short pullback forming higher lows between late July and early August.
Breakout Area: 0.740 is the rim resistance — breakout above this will confirm the Cup & Handle.
- Valid Cup & Handle characteristics:
Rounded bottom (accumulation phase).
Handle with light pullback and low volume.
Breakout attempt with increasing volume (watch confirmation).
Price is well above the Kumo: Clear bullish trend.
- Tenkan-sen > Kijun-sen: Short-term momentum is bullish.
V as immediate resistance at 0.715. If price stay above this level, confirming the bullish continuation.
Entry (Breakout Buy) 0.740 (above resistance/handle)
Aggressive Entry 0.660–0.675 (on handle support bounce)
Stop Loss 0.620 (below handle and Tenkan/Kijun)
TP1 (V) 0.715
TP2 (NT) 0.770
TP3 (N) 0.815
- Chikou Span is above the cloud and price: Confirming trend support.
- Kumo Future is Bullish: Strong foundation for continuation.
Note:
1. Analysis for education purposes only.
2. Trade at your own risk.

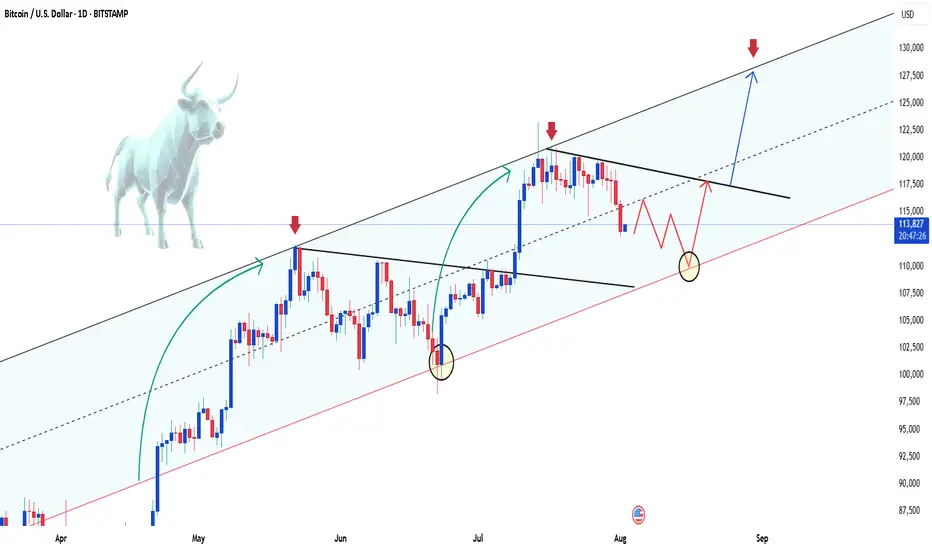
BTCUSD – bullish momentum is backBitcoin is making a strong comeback, breaking above short-term resistance and reestablishing its uptrend after a prolonged consolidation phase. The technical structure now shows clear control from the bulls, with higher highs and higher lows beginning to form.
Positive risk sentiment and growing expectations of capital flowing back into the crypto space—especially after a series of weak U.S. economic data—are fueling the current BTCUSD rally. If momentum holds, the next target could be the upper boundary of the price channel.
Keep an eye on how price reacts at key levels and trendlines — this might be the launchpad for the next bullish leg.
Good luck, and if you enjoyed this analysis, don’t forget to hit like and drop a comment!
GBPUSD: Bearish Momentum vs. Fundamental Repricing – Key LevelsGBPUSD is at a critical juncture, balancing a clear technical breakdown with a fundamental backdrop favoring near-term volatility. The pair has slipped from its rising wedge structure and is now testing key retracement zones while markets reprice expectations for Fed rate cuts after weak US jobs data. Traders are closely watching whether this bearish momentum will extend toward the 1.3128 support or if a rebound from oversold conditions could trigger a corrective bounce.
Technical Analysis (8H Chart)
Pattern: Clear breakdown from a rising wedge, confirming bearish bias.
Current Level: Price sits near 1.3278, struggling to reclaim the 1.3300 resistance zone.
Key Support Zones:
1.3128 (61.8% Fibonacci retracement) – main bearish target.
1.2945 (78.6% retracement) – extended downside target if selling pressure deepens.
Resistance Levels:
1.3300 (immediate resistance, prior support now flipped).
1.3380 (secondary resistance if a retracement rally occurs).
Projection: Likely bearish continuation toward 1.3128, with a potential retest of 1.3300 before continuation.
Fundamental Analysis
Bias: Bearish in the short term, but Fed policy and risk sentiment remain key drivers.
Key Fundamentals:
USD: Weak NFP (73K), higher unemployment (4.2%), and downward revisions boost Fed cut bets (~75% for September), typically a USD-negative factor.
GBP: BOE maintains a cautious stance due to sticky inflation but lacks clear hawkish conviction as growth slows.
Tariffs: US tariffs add a mild negative weight on GBP trade sentiment.
Risks:
Hot US CPI could slow Fed cut bets, supporting USD.
Hawkish BOE comments could limit GBP downside.
Global risk sentiment shifts could either favor USD (risk-off) or weaken it further (risk-on).
Key Events:
US CPI and PPI for USD direction.
BOE policy updates and UK CPI.
US jobless claims and Fed commentary.
Leader/Lagger Dynamics
GBP/USD is a lagger, mainly reacting to USD shifts. However, its moves directly influence GBP crosses such as GBP/JPY and GBP/CHF.
Summary: Bias and Watchpoints
GBP/USD remains in a bearish phase, targeting 1.3128 with a potential corrective bounce toward 1.3300 first. The primary driver is the technical breakdown, while fundamentals add volatility around US CPI and BOE policy. If CPI surprises lower, the bearish outlook could reverse into a short-term rebound; if CPI is hot, downside momentum could extend. You should monitor USD-driven events closely as GBP/USD sets the tone for broader GBP movements.

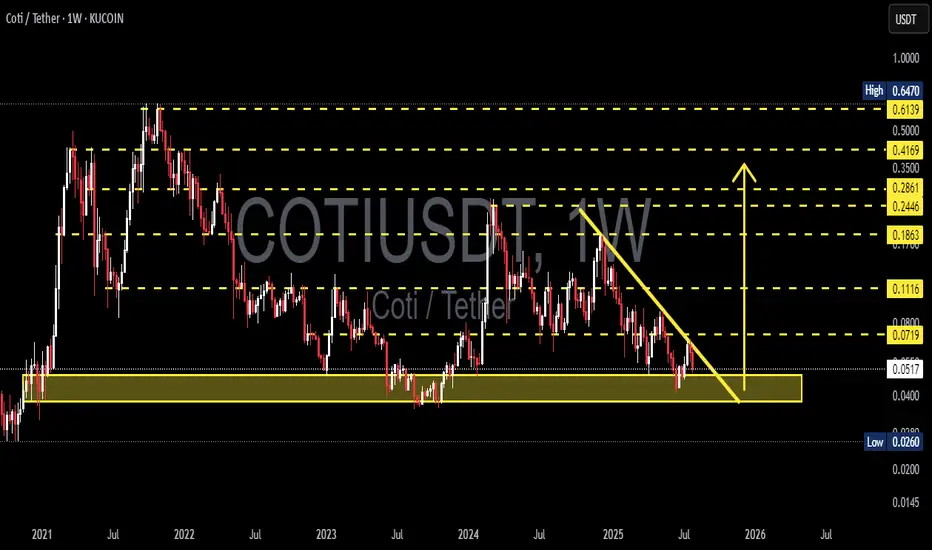
COTIUSDT Weekly Analysis Potential Reversal?📍 Current Price Position – On Top of Historical Support!
The COTI/USDT pair is currently testing a crucial support zone between $0.0400 – $0.0517, which has been a key demand zone since early 2021. This isn't just any support — it's a macro psychological area that has repeatedly triggered strong reversals in the past.
We are at a make-or-break level, where the next move could define the mid-term trend.
---
🧩 Price Structure and Pattern
📐 The chart shows a descending triangle pattern with:
Consistently lower highs (marked by the downward yellow trendline),
Flat horizontal base around the major support zone.
This pattern can result in:
A powerful breakout if the trendline is broken, or
A sharp breakdown if the horizontal support fails.
---
📈 Bullish Scenario: Reversal Momentum Building?
If price:
Breaks above the descending trendline (~$0.0719), and
Closes a weekly candle above that resistance zone,
➡️ We could see a breakout move with targets at:
Resistance Level Target
Initial Target $0.1116
Mid-Term Target $0.1863
Strong Zone $0.2446 – $0.2861
Long-Term Bullish $0.35 – $0.4169
📌 A confirmed higher high and higher low structure above $0.11 would strengthen the bullish case.
---
📉 Bearish Scenario: Breakdown from Support
If:
Price fails to hold the $0.0517 – $0.0400 support area,
and prints a weekly close below this zone,
➡️ The next bearish targets could be:
Support Level Target
First Support $0.0260
Psychological Level $0.0200
Extreme Panic Zone $0.0150 – $0.0100
⚠️ This would indicate a capitulation phase, likely to trigger panic selling and deeper lows.
---
🧠 Strategy Notes for Traders
✅ For Position Traders:
The $0.040 – $0.0517 area is a prime watch zone for reversal setups with tight stop-loss below $0.040.
Excellent Risk:Reward potential if reversal confirms.
✅ For Swing Traders:
Breakout above the trendline offers a solid entry signal.
Targets up to $0.1863 look achievable with strong volume.
✅ For Conservative Traders:
Wait for breakout + retest confirmation before entering.
Avoid FOMO — let the weekly candle close guide your decision.
---
⚡️ Final Takeaway
> COTI/USDT is at a tipping point!
This long-standing support is the last line of defense for the bulls. A breakout can trigger a macro trend reversal, while a breakdown will extend the downtrend and invite heavier selling pressure.
Watch for the weekly close, trendline reaction, and volume behavior — the next major move is likely just around the corner.
#COTI #COTIUSDT #CryptoAnalysis #AltcoinWatch #DescendingTriangle #BreakoutTrading #SupportAndResistance #PriceAction #ChartPattern #WeeklyAnalysis
BTC Daily Elliott Wave CountAs mentioned in my analysis on youtube post on Total Market Cap short-term, the daily bullish case is now verified, canceling the bearish case with a break through the daily bearish invalidation level.
This past week price action suggests a move towards the completion of a blue wave x. Make sure to check out my latest analysis on short-term Crypto Total Market Cap.
The link to the chart:
Bullish Count

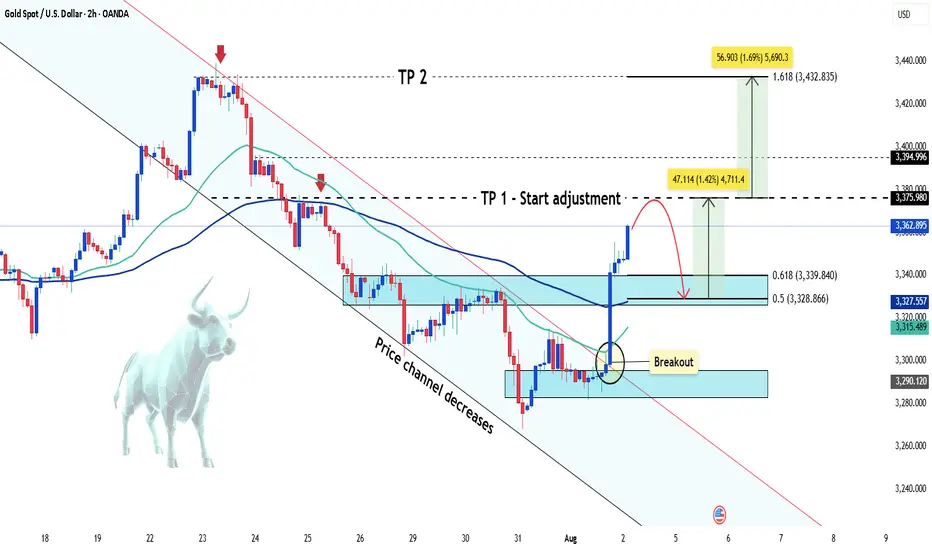
Gold suddenly increased sharply Hey everyone, let’s dive into what’s happening with XAUUSD!
Gold is experiencing a remarkable rally this weekend, skyrocketing from the $3,285 zone to around $3,362 — gaining over 700 pips. This sharp move comes amid weakening U.S. labor market data, which has fueled speculation that the Federal Reserve may begin cutting interest rates as early as September.
According to the U.S. Bureau of Labor Statistics (August 1st), non-farm payrolls rose by just 73,000 jobs in July — well below economists’ expectations of 106,000. The disappointing figures have shaken confidence in the U.S. economy and placed pressure on the U.S. dollar, as markets increasingly anticipate a dovish shift from the Fed.
For gold, this weak jobs report reinforces its role as a safe-haven asset, driving strong demand as investors seek protection from economic uncertainty. At the same time, lingering fears around global trade tensions and new tariffs imposed by President Donald Trump continue to support the flight to safety.
From a technical perspective, gold has broken out of its descending price channel and is moving fast. According to Dow Theory, a short-term correction may occur soon, but if price holds above key support levels, the rally could extend toward the $3,432 region — the 1.618 Fibonacci extension zone.
This move might mark the beginning of a new bullish phase after weeks of consolidation.
What do you think — is gold just getting started?
Third Quarter 2025 Nigerian share picks Update....Percentage Up!Here's a summary and update on the third quarter 2025 Nigeria stock picks based on the price comparison between July and August - 1month:
Q3 2025 Trading View: Nigerian Stock Picks Update
Strong Performers with Significant Gains:
BUACEMENT: Up 48%, showing strong momentum as a cement sector leader.
DANGSUGAR: Increased by nearly 37%, notable growth in the sugar sector.
ELLAHLAKES: Shares rose over 36%, a promising performer.
DANGCEM: Cement stock up about 20%, continuing solid growth.
ETRANZACT: Up 24%, showing steady improvement in the tech/payment sector.
MULTIVERSE: Grew by 24%, indicating healthy gains in diversified tech.
NB: +28.8%, good growth for the banking/finance sector.
Moderate or no Growth:
ARADEL: Small increase of about 1%, steady but minimal movement.
HMCALL: Stable with a minor 1.4% increase, remaining consistent.
TRANSPOWER: No price change, holding steady for now.
Overall Market Sentiment:
Average gain across all picks is approximately +22%, a strong positive trend overall.
Indicates a bullish sentiment on these carefully selected third-quarter stocks.
Opportunity exists to take advantage of higher momentum sectors like cement, sugar, and tech/payment companies.
Trading Takeaway:
The Q3 2025 picks demonstrate robust growth potential, especially in key sectors like construction materials and tech/payments. Conservative performers provide portfolio stability while high growth stocks offer upside. Continual monitoring for volume and market news is recommended to capitalize on gains and manage risks moving forward.

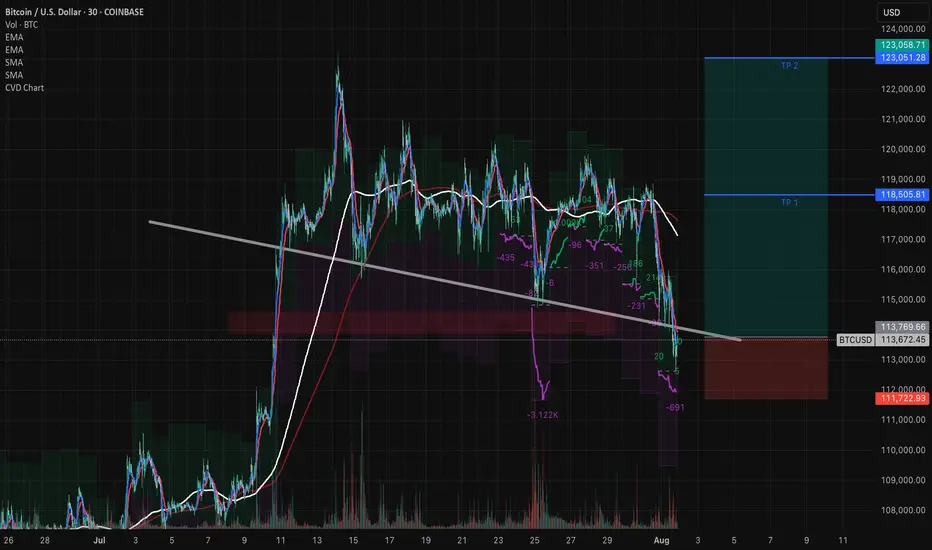
WAIT FOR A TRIPLE CONFIRMATION AND CAPITALIZE ON THE TARIFFS
Analysis and Prediction by DunnInvesting
Market Overview
The BTCUSD chart on a 1-hour timeframe shows a recent consolidation phase following a sharp decline. Key technical indicators suggest a potential reversal or continuation pattern. The price is approaching a critical support zone around $113,792.86, with a descending trendline acting as resistance.
Thought Process
Support Zone Identification: The $113,792.86 level aligns with a historical support zone and the 50-period EMA, indicating a strong area for potential buying interest.
Trendline Resistance: The descending trendline has capped recent upward movements. A break above this level could signal a bullish reversal.
Triple Confirmation: Wait for three confirmations:
A bullish candlestick pattern (e.g., engulfing candle) at the support zone.
A break above the trendline with increased volume.
A retest of the trendline as new support.
This setup offers a clear entry point with defined risk below the support zone, making it understandable and actionable.
Trade Plan
Entry: $114,500 after triple confirmation.
Take Profit 1 (TP1): $118,505 (4.5% gain).
Take Profit 2 (TP2): $123,051 (7.5% gain).
Stop Loss: $112,000 (below support, ~2.2% risk).
Risk-Reward Ratio: 1:2.04 (TP1) and 1:3.41 (TP2).
Profit Targets and Stop Loss
TP1 at $118,505 targets a conservative 4.5% move.
TP2 at $123,051 aims for a more ambitious 7.5% upside.
Stop loss at $112,000 protects against a breakdown below support.
Clarifying Notes
This idea leverages the current market uncertainty around tariffs, which could drive volatility and create trading opportunities. Monitor volume and news closely for validation.
Disclaimer
This is not financial advice. Trading involves risk, and you should only trade with capital you can afford to lose. Consult a financial advisor before making any trading decisions.
EURUSD--LONG--02_08_25--strong reaction from monthly support around 1.14142
--price will move higher towards 1.17019
--best entry is between 1.15585 and 1.15619

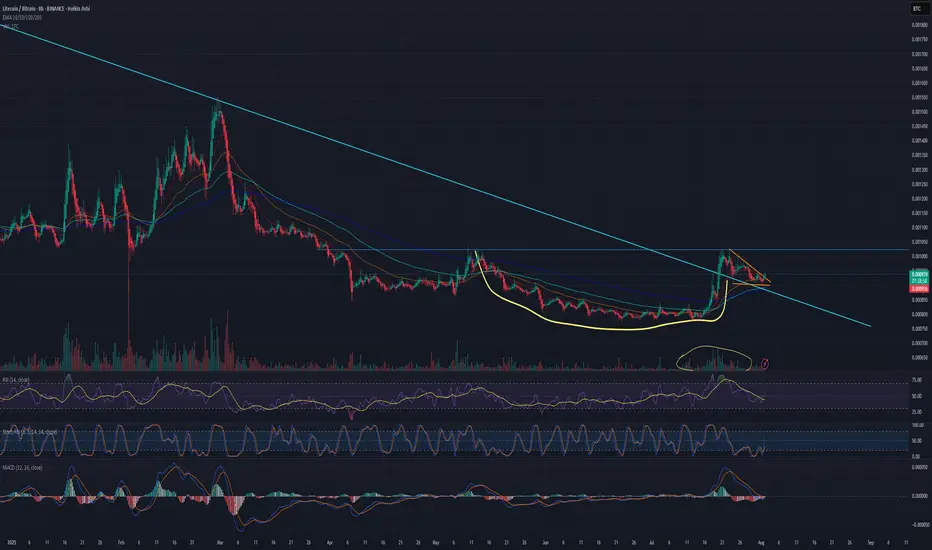
Is Litecoin finally ready to pop for real this time? 1600% gainAs many of you have been, I'm watching crypto prices closely since the BTC jump to $123k, waiting for the next move. Well, today we see that move and the entire market is blood red, except for...
Litecoin.
The patiently waiting little brother of the "big 3", waiting for his time to grow up and shine. Well today I'm impressed, mr. Litecoin is the only green coin in my entire Watchlist.
Zooming in on the chart: there’s a clean, rounded cup and a crisp handle forming, and that handle looks like it’s already breaking out. If Bitcoin can hold the $112K level, I think this could be the start of some serious moves from LTC.
The perfect bull flag that's formed on the chart has good volume too.
That blue line coming down is a long term trendline, and price is consolidating above it.
Still thinking about that "1600%"?
If you zoom out, there's a massive descending wedge forming since 2014 (11 years!!!). If Litecoin finally breaks out of it, the first fib level (.236) is at .01275BTC, that's 1600% up from here.
We'll see.
BTC | Swing Plan UpdatePrice failed to break out above 1D supply and sharply rejected, losing key 4H demand at $117,300.
HTF demand at $109,000 (1D FVG + BOS + S/R) is the next major area of interest—this is where I’ll look for fresh swing setups if the market flushes further.
No need to rush new positions until a clean setup prints or levels are reclaimed.
Plan:
Wait for price to test $109,000 zone before considering a swing long.
Only consider LTF scalp longs if we reclaim the 4H BOS at $118,300.
Stay flat until high-probability entry, let the market show its hand.

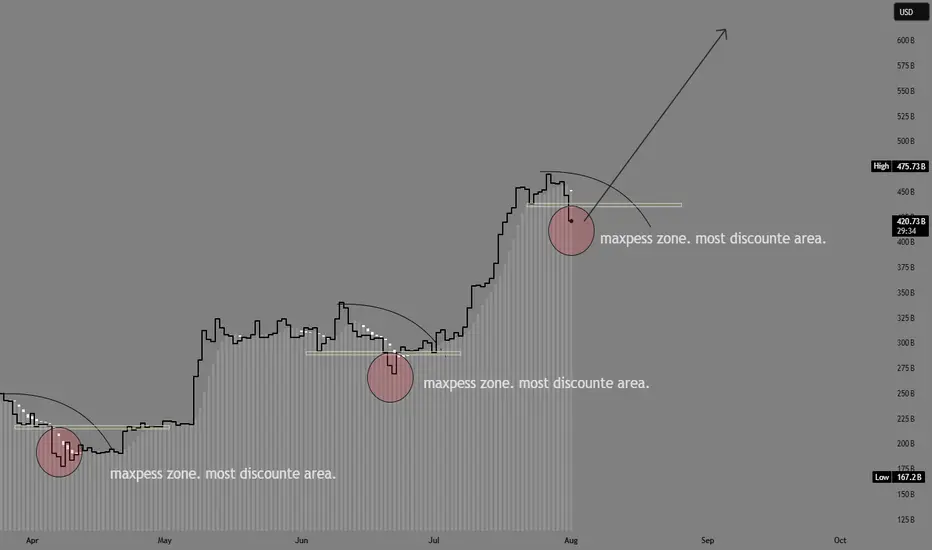
ETH accumulation season 3 has begun at 3.4k. Start loading up!!!ETH has seen impressive price growth for the past few weeks from our original spot at 2.4k -- and it run as high as 3.9k -- almost at our target of 4k.
Now, as with any parabolic moves, eth has to hibernate a bit for that well deserved recharge. This healthy correction at current levels is warranted. 23.6%, 38.2% FIB taps are usually ETHs favorite zone area. This is where most buyers converge as far the most bargain area to position. And we are now at that elusive zone.
A seed from this area is ideal. From our current diagram, you can see we are now on season no.3. This has been doin the same behavior since 160B mcap, and for this next phase, ETH is eyeing 600B mcap from here.
This is in line with our original forecast.
We are now on Month no. 3 as we entered August, my predicted cycle duration would be 17 bullish months till December 2026.
-----------
STONG BUY HOLD at this area. We got a rare elusive season of accumulation that doesnt come very often.
Happy profiting everyone
See you up there.
Spotted at 3.4k
Mid target 5k.
Long term target. 10k.
TAYOR.
Trade safely.
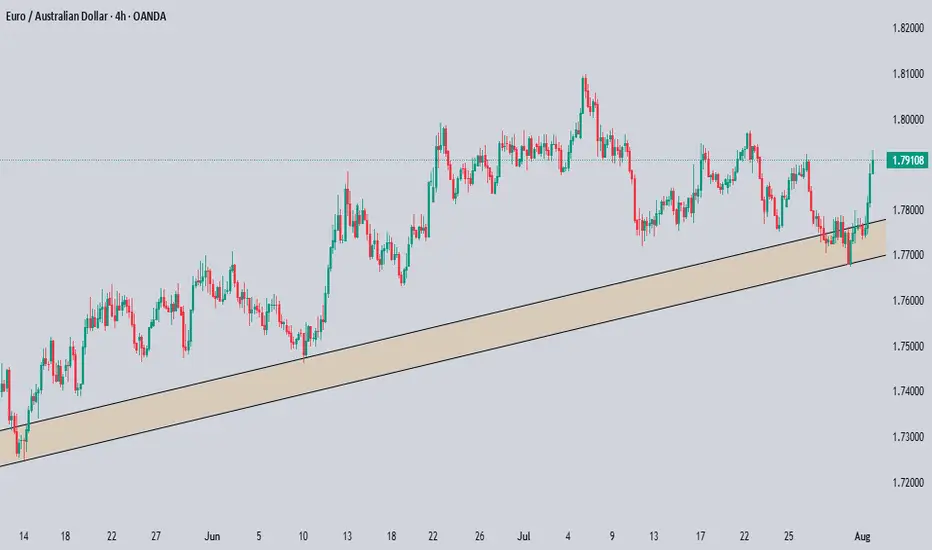
EURAUD BULLISH MOVE CONTINUESOur analysis is based on a multi-timeframe top-down approach and fundamental analysis.
Based on our assessment, the price is expected to return to the monthly level.
DISCLAIMER: This analysis may change at any time without notice and is solely intended to assist traders in making independent investment decisions. Please note that this is a prediction, and I have no obligation to act on it, nor should you.
Please support our analysis with a boost or comment!
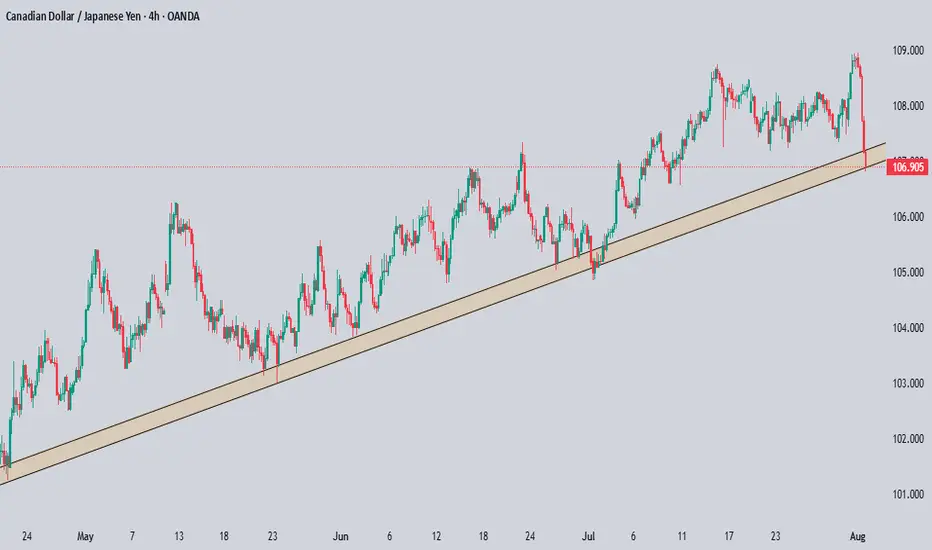
CADJPY Technical & Order Flow AnalysisOur analysis is based on a multi-timeframe top-down approach and fundamental analysis.
Based on our assessment, the price is expected to return to the monthly level.
DISCLAIMER: This analysis may change at any time without notice and is solely intended to assist traders in making independent investment decisions. Please note that this is a prediction, and I have no obligation to act on it, nor should you.
Please support our analysis with a boost or comment!
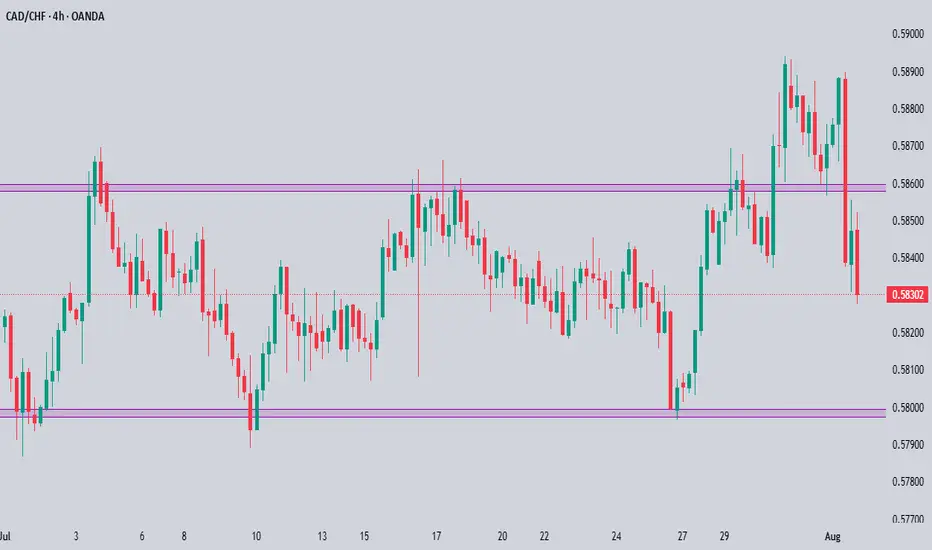
CADCHF Technical & Order Flow AnalysisOur analysis is based on a multi-timeframe top-down approach and fundamental analysis.
Based on our assessment, the price is expected to return to the monthly level.
DISCLAIMER: This analysis may change at any time without notice and is solely intended to assist traders in making independent investment decisions. Please note that this is a prediction, and I have no obligation to act on it, nor should you.
Please support our analysis with a boost or comment!
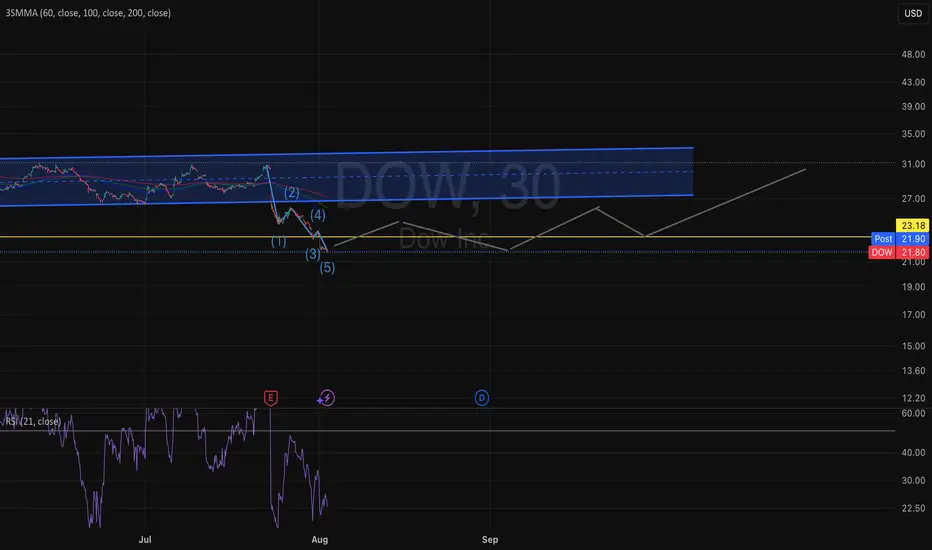
Will the DOW every Rally after Tariffs?Disclaimer: I do NOT know what I am doing.
Based on Elliot Wave, recent consolidation, and Phi sequencing, the pullback for 'Merican production should fire up the movement.
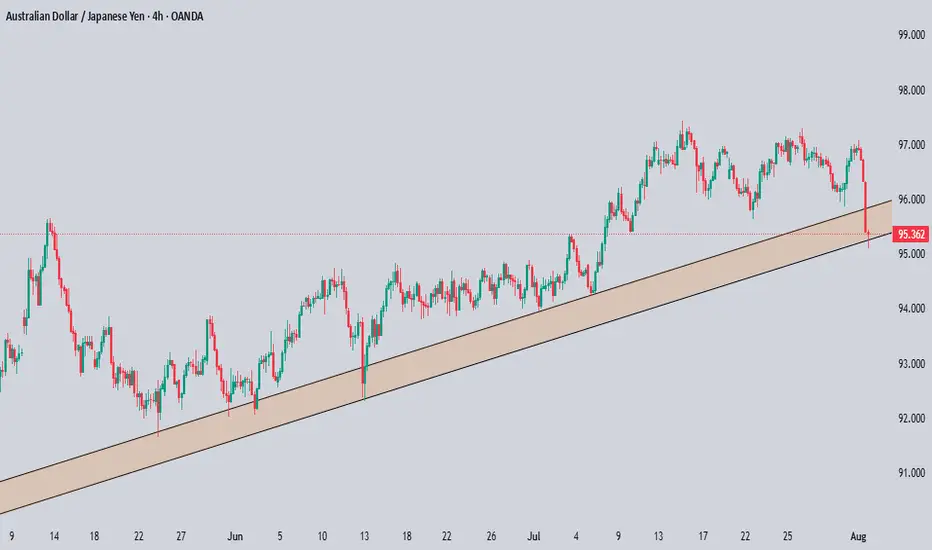
AUDJPY Technical & Order Flow AnalysisOur analysis is based on a multi-timeframe top-down approach and fundamental analysis.
Based on our assessment, the price is expected to return to the monthly level.
DISCLAIMER: This analysis may change at any time without notice and is solely intended to assist traders in making independent investment decisions. Please note that this is a prediction, and I have no obligation to act on it, nor should you.
Please support our analysis with a boost or comment!
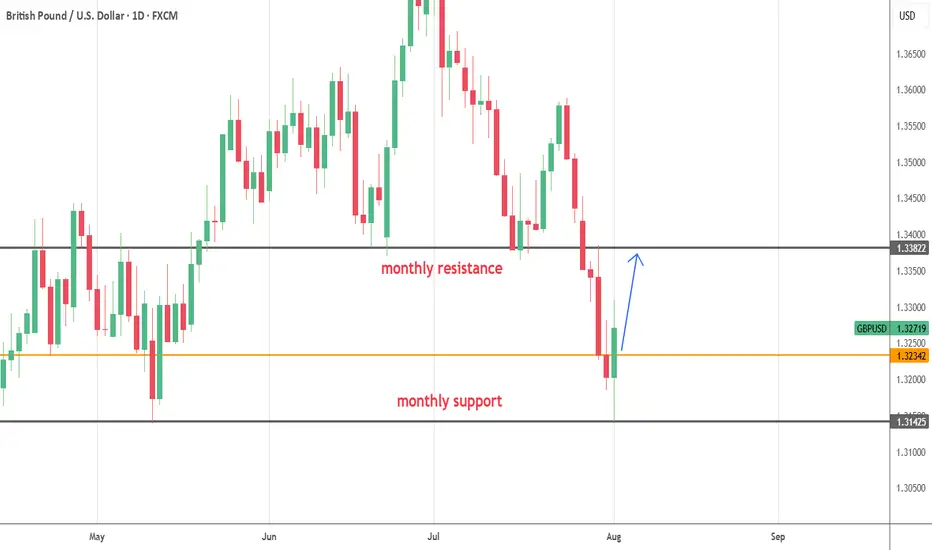
GBPUSD--LONG--02-08-25--Bouncing up from monthly support around1.31425 (black horizantal line),price at least move higher to the monthly resistance around 1.33822(black horizantal line)
--best entry level is between 1.325 and 1.328