$DUOl Bottomed? PT $600 Bounced off where it is supposed to on the lower trendline. This is on linear scale and if
DUOL manages to reclaim the 8SMA, things will start looking better to the upside. One step at a time! ;)
PT $600+ (Top of the channel)
Chart Patterns

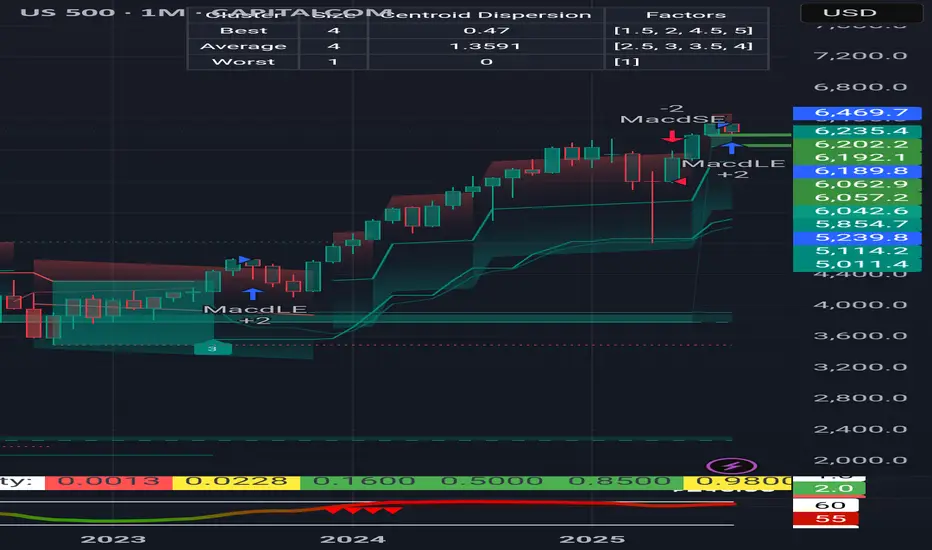
Correction will be to 6050-6190, probably the upper limit Now I notice something very important and things and the analyses of many actually coincide. Monthly support from the accumulated volume lies between 6050 and 6170. 4h indicators show a clear reversal. Separately, at these levels are the previous ATH. In my opinion, it is possible to stop even at 6180-6190. We will probably start with a gap on Monday. Now here comes the moment and over the weekend what will take place as conversations and statements in the media, but it is very likely that the minimum could happen as early as Monday night (USA time) or by Tuesday. I agree that this correction was necessary and should have happened as soon as possible because things became difficult even for bulls like me.
08/1/25 Trade Journal, and ES_F Stock Market analysis EOD accountability report: +440
Sleep: 6 hours
Overall health: Good
VX Algo System Signals from (9:30am to 2pm)
— 9:30 AM Market Structure flipped bearish on VX Algo X3!
— 10:12 AM VXAlgo ES X1 Buy signal
— 10:20 AM VXAlgo NQ X1 Buy Signal
—12:30 PM Market Structure flipped bullish on VX Algo X3!
— 1:00 PM Market Structure flipped bearish on VX Algo X3!
— 1:50 PM VXAlgo ES X1 Buy signal,
— 3:00 PM Market Structure flipped bullish on VX Algo X3!**
What’s are some news or takeaway from today? and What major news or event impacted the market today?
Market range expanded a lot today, we dropped over 100 points today and sometimes i forget to adjust my bracket orders to go for 10 -15 points take profits when the volatility is so high. But overall, it was a good day, I knew to be patient as market was wild and sometimes you want to just snipe a few trades and call it a day before you get caught on the wrong side.
The great thing about big moves is that it will eventually hit a major level and it will react really well, you just have to wait for it.
a great question is will the market recover? Or is going back down to April prices?
News
*STOCKS TUMBLE TO END THE WEEK, VIX SPIKES AS SOFT JOBS DATA STOKE ECONOMIC JITTERS
What are the critical support levels to watch?
--> Above 6330= Bullish, Under 6310= Bearish

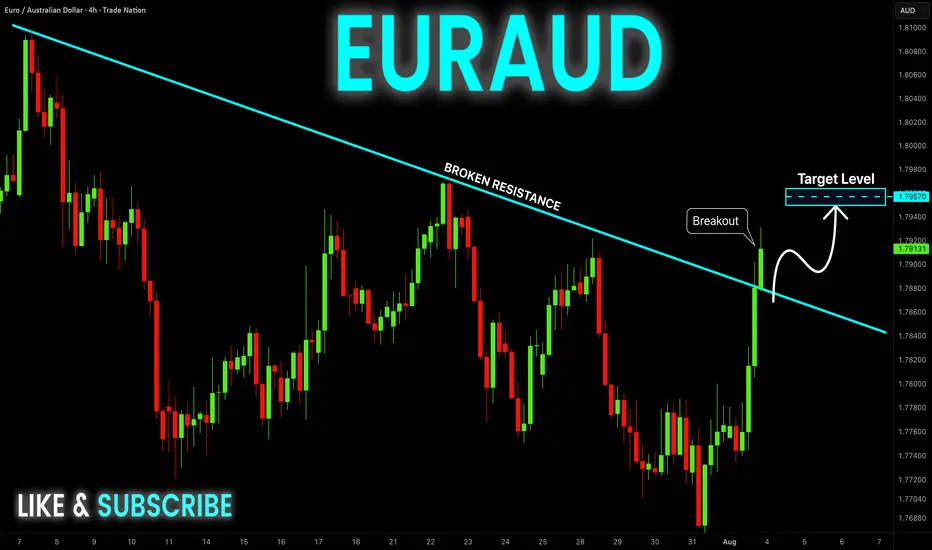
EUR-AUD Bullish Breakout! Buy!
Hello,Traders!
EUR-AUD made a bullish
Breakout of the falling resistance
And the breakout is confirmed
So we are bullish biased
And we will be expecting
A further bullish move up
On Monday!
Buy!
Comment and subscribe to help us grow!
Check out other forecasts below too!
Disclosure: I am part of Trade Nation's Influencer program and receive a monthly fee for using their TradingView charts in my analysis.
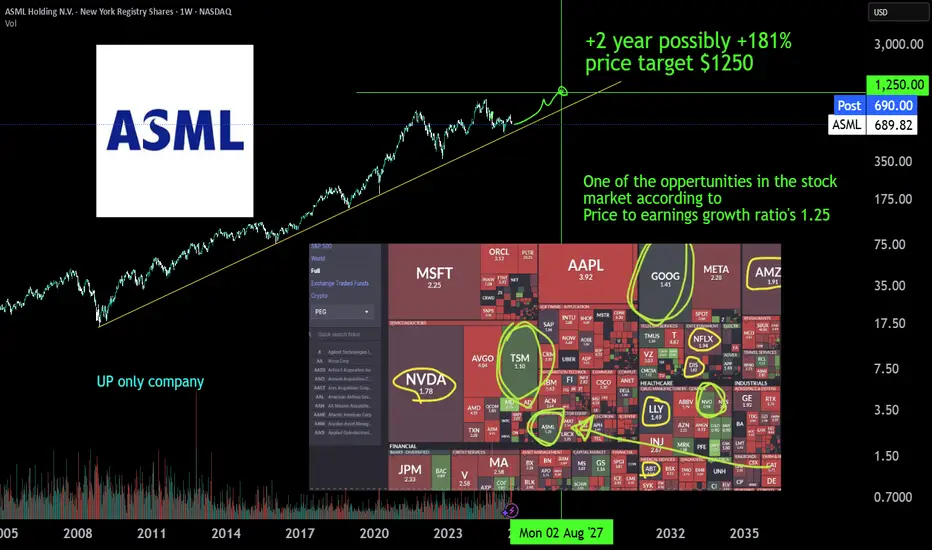
ASML monopolist, AI expanding +181% | 2Y oppertunity ASML is the monopoly Extreme ultra violet machinery company. There is no one close to it's technology or there is no one investing enough to R&D a thing like it. The whole AI datacenter and cloud chip growth depends on EUV machinery of ASML developed in 2013 (>10y of PhD level R&D deveopment). The first new High-NA EUV systems have been deployed at Intel in July 2025 for research purposes and will scale just like the EUV already does to keep pace with moore's law. TSMC has stated it will not yet depoly the machines but has to expand with to 10 year older tech EUV machines just to get the AI chip demand going. AI chip demand at NVIDIA is growing harder than expected comfirmed by latest earnigns of alphabet, microsoft, meta and amazon.
Also don't sleep on BESI a packing machinery wonder due to hydrid bonding technology, which makes 3D chip staking possible.
#GoHighTechNetherlands
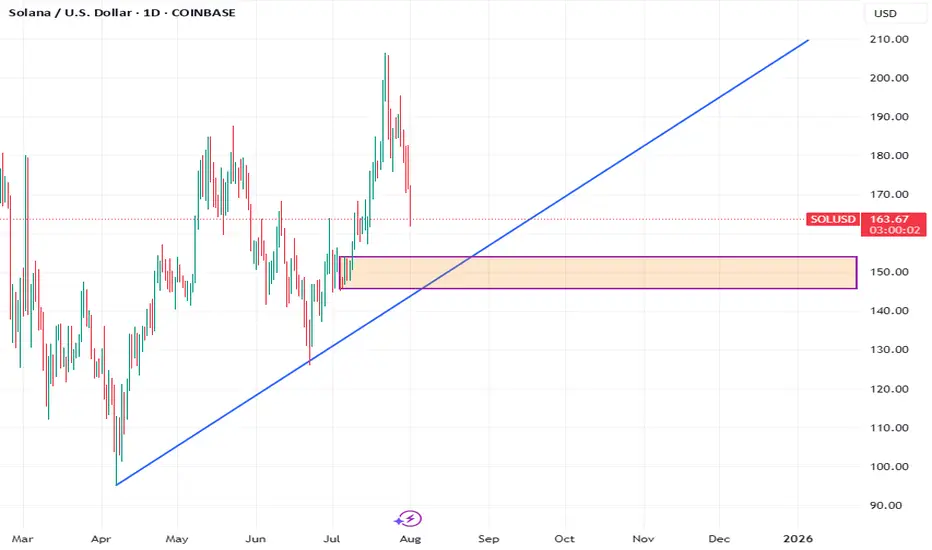
SolSolana is currently in a correction phase, and a strong demand is forming near the 151 area.
As per the rules, the market should ideally start buying from here.
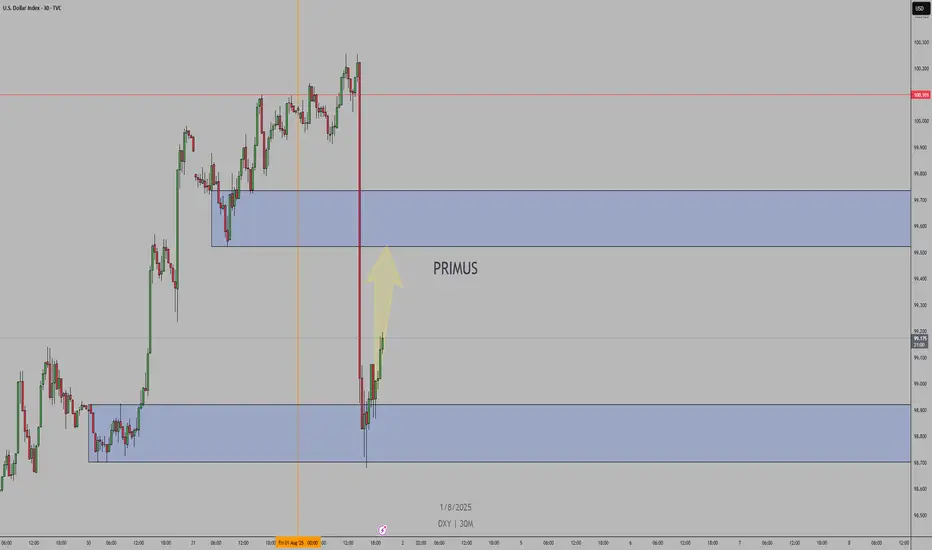
DXYBack to the initial direction which is bullish momentum acoording to cot report. And I'm expectiong more continuation till maket close of before
USDCHF--Short--short term bearish possibility
--strong reaction from monthly resistance around 0.8180
-- lets look at two case. CASE1)Tendency is bearsih. then price will fall. CASE-2) Tendency is bullish.Even if the price will rise later, first it will pullback to 0.7978 level then rise.

GBPUSDPrice Action: A key support zone has been broken and is now acting as resistance.
Market Structure: Lower highs + lower lows forming → confirms downtrend.
Bias: Bearish while price stays under the broken level.

Reversal from Channel Bottom or a Real Breakdown? Identifying th
🎯 BTCUSDT - Analysis
🔹 Analysis Date: 1 August 2025
📉BTCUSDT:
Price is currently moving inside an ascending channel and has touched the bottom of the channel again, offering a potential buy opportunity.
However, for those seeking a low-risk entry, the zone around 118,000 could be ideal—if price returns to the channel and confirms support.
Although it seems the channel’s lower boundary might break, this could be a fake break to mislead traders before a rebound.
The support at 110,000 is a crucial short-term level; if it fails, a deeper correction toward 98,090 or even 94,000 is likely.
Our targets remain at the upper boundary of the channel.
⚠️ Risk Management Tip: Wait for confirmation near 118,000 if unsure, and always size positions based on overall volatility.

Abbvie, maybe this time...
NYSE:ABBV has been very hard to trade...but with earnings behind us and good beat and guidance, I think this will run..
creating an ascending triangle here with higher highs into equal lows and a close above 197 next week could send this way past 200 IMO
healthcare sector is beaten down as it is, so any rotation into the sector will also help the stock

USD/MXN Bounces Back Ahead of August 2024 LowUSD/MXN appears to be bouncing back ahead of the August 2024 low (18.4291) as it extends the advance from the July low (18.5116), with the exchange rate trading above the 50-Day SMA (18.8993) for the first time since April.
USD/MXN trades to a fresh weekly high (18.9810) following the failed attempt to push below the 18.5090 (23.6% Fibonacci retracement) to 18.6330 (50% Fibonacci retracement) zone, with a move above 19.3720 (38.2% Fibonacci retracement) bringing the June high (19.4441) on the radar.
A move/close above 19.6280 (23.6% Fibonacci extension) opens up the May high (19.7820), but lack of momentum to hold above 18.7780 (50% Fibonacci retracement) may push USD/MXN back toward the July low (18.5116).
--- Written by David Song, Senior Strategist at FOREX.com

MARKET UPDATE— August 1st, 2025“Handle before lift-off? Or is the bull year cooling off?”
Let’s address the question everyone is silently asking:
Are we nearing the end of the bull year… or is this just the calm before the next storm?
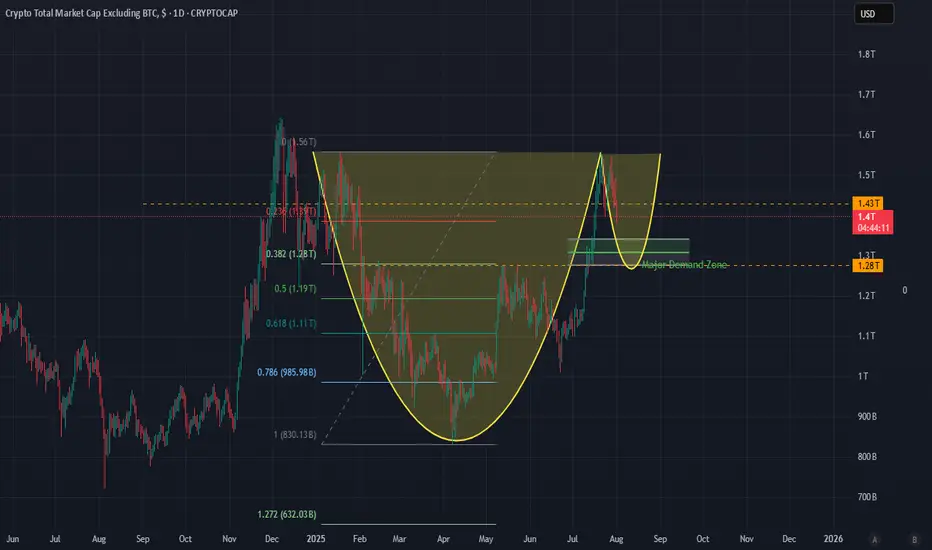
1. Total Market Cap (ALTS): Cup & Handle in Motion
We’ve observed something beautiful forming on the chart a clean cup and handle structure.
But here’s the twist: this isn’t just any setup it’s forming just below the infamous $1.43T ceiling, which has now rejected monthly closes in November, December, January, February, and July.
- High of January : $1.56T
- Low of April (Handle Base) : $0.83T
- High of July : $1.56T
These levels outline a powerful structure… but we haven’t launched yet. Why? Because the handle isn’t done cooking.
Based on Fibonacci retracement levels from the handle’s top to bottom:
- 0.236 sits at $1.32T
- 0.382 sits at $1.24T
- 0.5 sits at $1.195T
We’ve yet to hit those deeper levels, and considering ALT dominance , macro uncertainty (e.g., Trump tariffs ), and repeated monthly rejection below $1.43T , a retrace into $1.28T or deeper is not only possible.....it’s healthy .
This isn't the breakdown. It's the build-up.
2. Bitcoin: The Key That Turns the Lock
Now here’s where it gets intense.
Everyone’s assuming Bitcoin can hold $115K even if ALT dominance retraces to $1.28T .
Let’s be real:
> If ALT dumps, Bitcoin bleeds too.
And here’s what I see:
- There's a fair value gap between $113K and $111K , a probable first target.
- But beneath that lies the demand zone between $109K and $107.5K , loaded with liquidity.
- That liquidity is a magnet $107.5K is where the smart money lurks.
- A move from $115K to $107.5K is a 6–7% drop , and with ALTs faltering, it’s becoming increasingly probable.
This isn't panic territory. It's precision territory .
> We want that drop. That’s the spring before the sprint.
3. So what’s next?
This is how I see it:
- ALTS retrace into the $1.28T–$1.24T range, maybe wick to $1.19T completing the handle.
- BTC fills the FVG to $111K , then dives to $107.5K gathering all that demand before rebounding.
- Once BTC reclaims $113K and ALTS reattempt $1.43T , the stage is set. We’re looking at a clean slate… and clean breakouts .
🎯 What should you do with this?
1. Don’t panic—plan.
Use these drops as entries, not exits. Liquidity hunts aren’t to scare you—they’re to position the sharp ones.
2. Watch the zones like a hawk:
- BTC: $113K, then $107.5K
- ALTS: $1.28T, then $1.24T or $1.19T
3. Stay bullish—but strategic.
The structure is intact. Momentum is coiling. And once this handle completes, the push above $1.43T isn’t a maybe it’s a matter of timing.
💡 Final Word
Are we at the end of the bull year?
No . We're simply testing the patience of tourists… while giving early movers one final entry.
Are we going higher?
Absolutely. But first, we dip.... not because we’re weak… but because that’s what strength looks like before it roars.
Brace for impact. Then brace for ignition.
INDEX:BTCUSD
CRYPTOCAP:TOTAL2
Today's Long in Gold! Perfect setup... Lower level support multiple times, Entry WITH small SL and the news followed... 3299- 3350 🚀

BTC ReaccumulationI'm watching here either for a local model 1 which forms a MTF accumulation model 2 or a model 1 which deviates the range one more time. There is a nice build up of liquidity to the upside but sadly no clear model 2 POI. The technical target if the model gets confirmed will be the range high but i would expect to see a new ATH. Let's see.

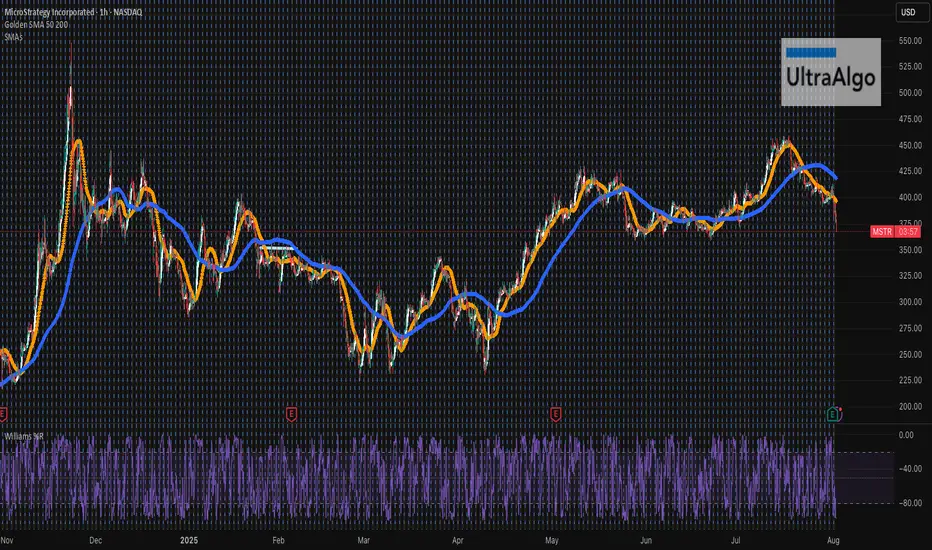
MSTR....Free FallingMSTR looks like it is nosediving straight down. When one is bullish on BTC, it is important to also understand that volatility is a big part of the game - a very costly game with many losers! BTC has past several key TAs and we only just started - crossing $300 is in the horizon. Always do your own due diligence, and received ultrabear signal earlier to exit, and cut your losses soon.
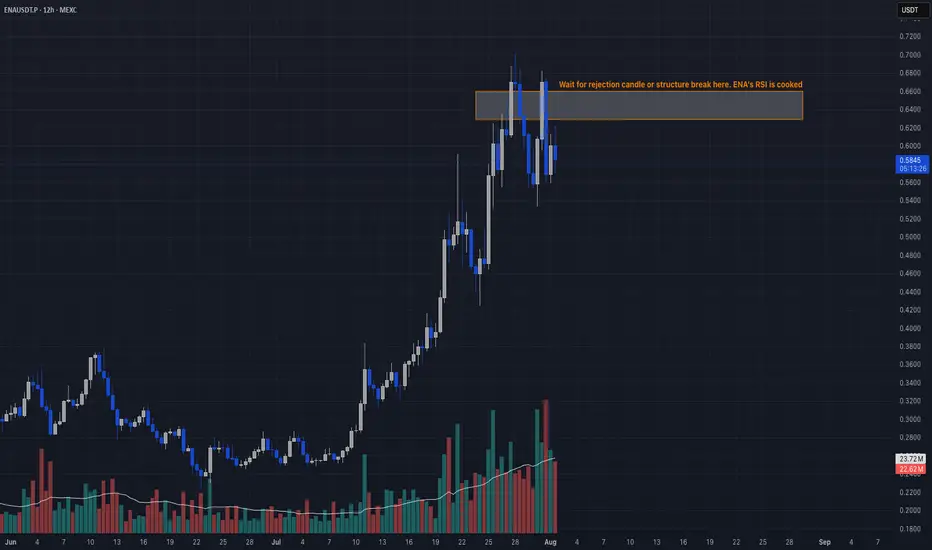
Overbought + Reversal Signal📣 Yo legends!
ENA got jacked on steroids lately, exploding in TVL and open interest like it’s headed to $10. But RSI at 82? Declining OI? That’s not strength, that’s a leverage hangover waiting to happen. Time to fade the party. 🥴
🔥 TRADE SETUP
Bias: Short
Strategy: Overbought + Reversal Signal
Entry: $0.63 – $0.66
SL: $0.71
TPs: $0.5446, $0.50, $0.42
Why?
– RSI 82 on daily = overheated
– Open interest dropping fast after topping $1.35B
– Funding collapsing → longs unwinding
– HTF sweep + LTF CHoCH confirmed.
Candle Craft | Signal. Structure. Execution.
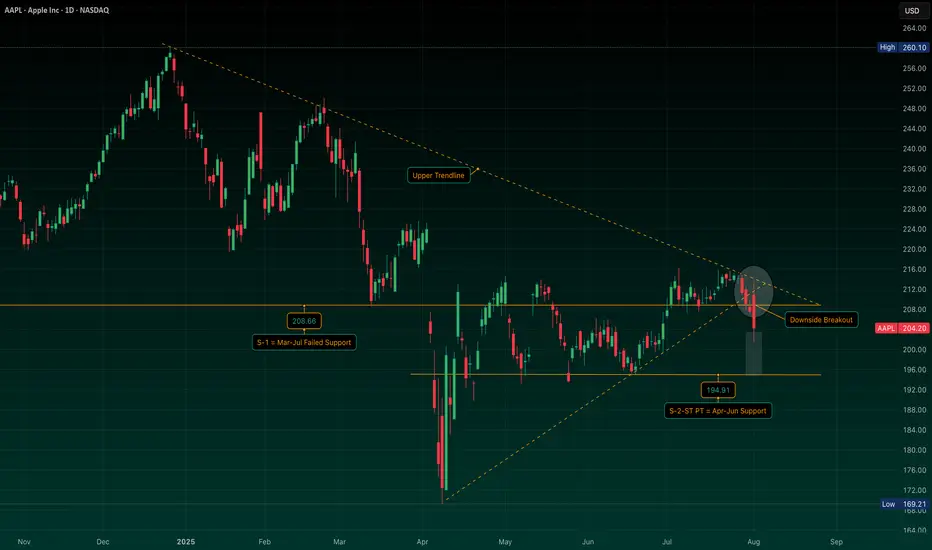
AAPL: Symmetrical Triangle Breakdown with S-2 in FocusAAPL has now broken below a well-defined symmetrical triangle structure, as well as the ~$208 S-1 support area I’ve highlighted.
I’m watching the $194.91 zone (S-2), which served as a key support and pivot earlier this year. If price heads into that area, I’ll be looking for confirmation and stabilization before initiating a position.
If the setup aligns, I plan to trade it via Sep/Oct put sales around the $170/$175 strikes -- targeting levels I’d be comfortable owning if assigned, and collecting premium if not.
Not stepping in early here… just tracking structure, respecting price action, and planning around risk-defined entries. We’ll see how this one plays out. Stay tuned.
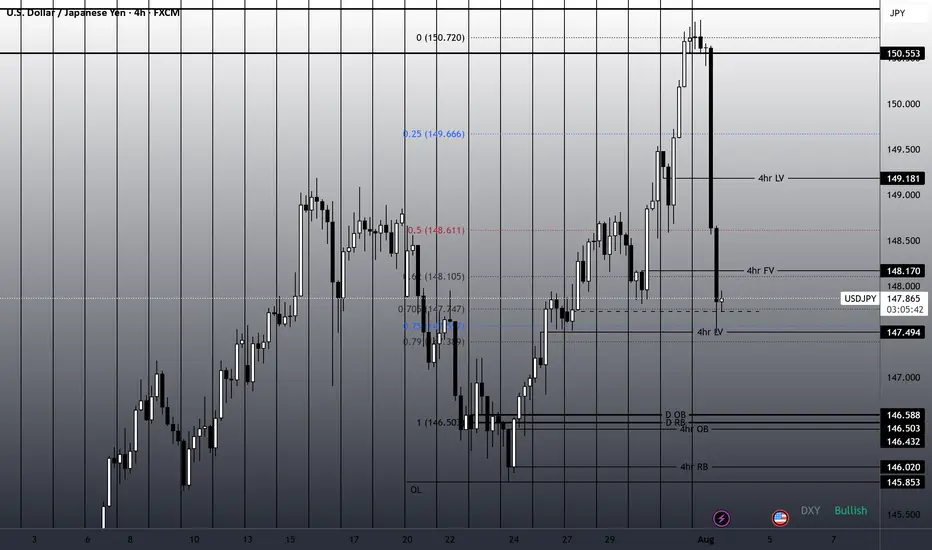
304-PIP Move on USDJPY in One Day - Trading NFP ProfitablyOn August 1st, USDJPY experienced a massive 304-pip drop after a strong impulse into the daily order block. From there, the daily order block was respected, and the retracement was induced by the USD Non-Farm Payrolls news release, leading to a sharp move down to a four-hour liquidity void, hitting the 75% Fibonacci retracement level.
This move highlights the precision of combining institutional levels with news catalysts, capturing a significant move in a short timeframe.
This is Outlier Trading Folks.
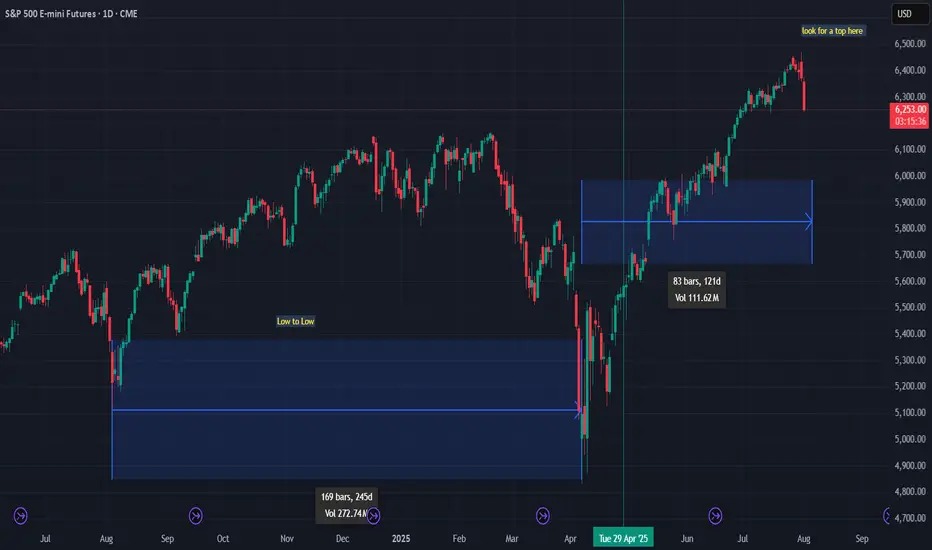
looking for a possible top for SPX500 , cycle highlooking for a possible top for SPX500 , cycle high
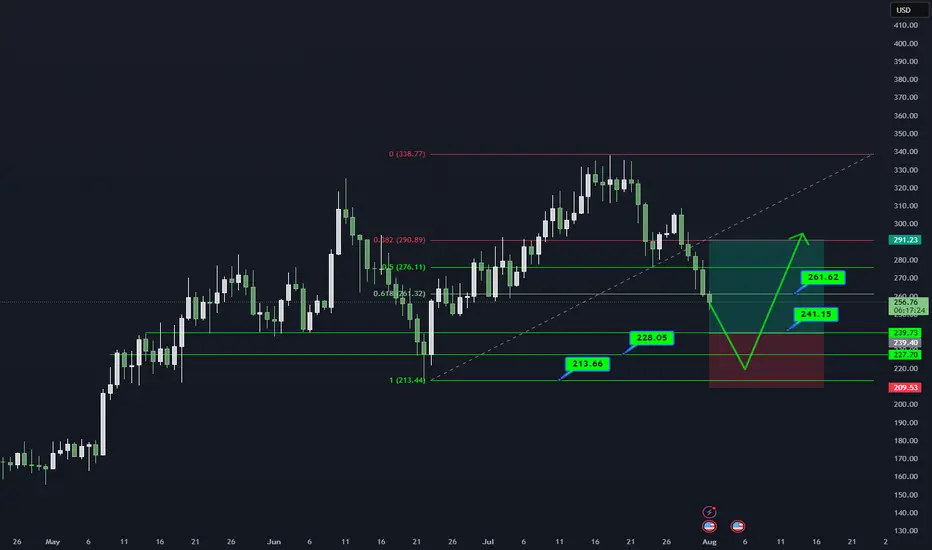
AAVE/USDT DAILY OUTLOOK📊 AAVE/USDT – DAILY TECHNICAL OUTLOOK
🔍 MARKET STRUCTURE
AAVE critical demand zone (241–228) par trade kar raha hai.
Higher timeframe trend bullish jab tak 213 strong base hold karta hai.
📌 KEY LEVELS TO WATCH
Support Zones: 241.15 → 228.05 → 213.66 (Major Base)
Resistance Zones: 261.62 → 291.23
Breakout Confirmation: Daily close above 261 could open path to 291.
🎯 TRADING PLAN (25% SCALING STRATEGY)
Entries ko 25% ke 4 parts me divide karein:
241.15
228.05
220–213 support range
Targets: 261.62 → 291.23
Stop Loss: Daily close below 213
⚠️ RISK MANAGEMENT NOTE
Spot trades safer. Leverage trading = technical gambling.
Capital preservation = long-term survival.
📖 QUOTE
"The big money is made by sitting, not trading." – Reminiscences of a Stock Operator
💬 WHAT’S YOUR VIEW ON AAVE?
Bullish bounce from demand zone or deeper retest ahead?
Share your thoughts in the comments!
#AAVE #CryptoTrading #Altcoins #TradingView #TechnicalAnalysis #CryptoCommunity #RiskManagement #SpotTrading
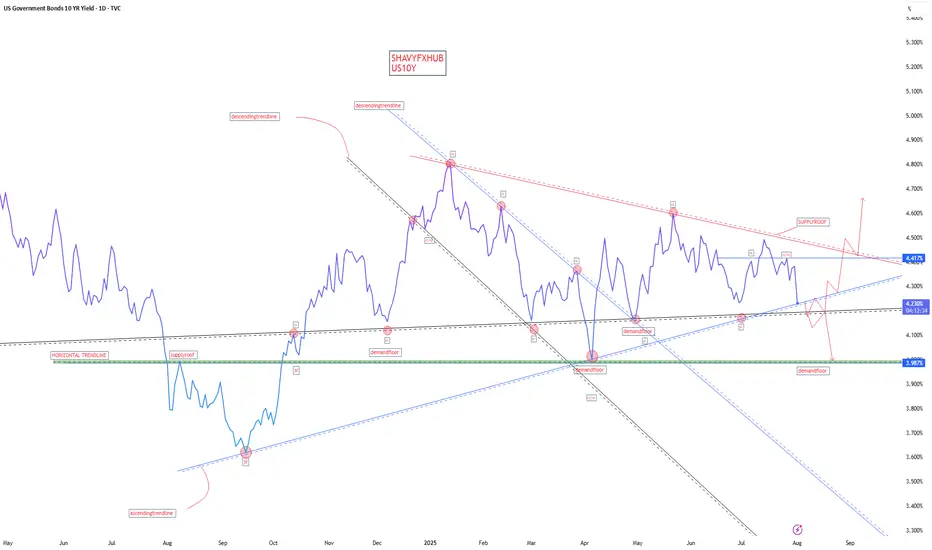
US10Y1. Labor Market Data
Average Hourly Earnings m/m:
Actual: 0.3%
Forecast: 0.3%
Previous: 0.2%
Interpretation: In-line with forecast and slightly above the prior period, indicating stable wage growth. This suggests inflationary pressures from labor costs remain steady, not accelerating unexpectedly.
Non-Farm Employment Change:
Actual: 73,000
Forecast: 106,000
Previous: 14,000
Interpretation: A clear downside surprise; job gains are well below expectations, and while up from a low previous period, this points to softening labor demand—an early sign of slack in the job market.
Unemployment Rate:
Actual: 4.2%
Forecast: 4.2%
Previous: 4.1%
Interpretation: Matches the forecast but marks a slight uptick, reinforcing mild labor market weakness.
Fed View: The Fed will interpret softer than expected job growth and a higher unemployment rate as evidence of easing labor market pressures—a dovish signal that could support future policy easing if the trend continues.
2. Manufacturing and Industry
Final Manufacturing PMI (S&P Global):
Actual: 49.8
Forecast: 49.7
Previous: 49.5
Interpretation: Slightly above forecast but still below the 50 threshold, indicating contraction persists but is less severe.
ISM Manufacturing PMI:
Actual: 48.0
Forecast: 49.5
Previous: 49.0
Interpretation: Below both forecast and prior; contraction in the manufacturing sector is deepening.
ISM Manufacturing Prices:
Actual: 64.8
Forecast: 69.9
Previous: 69.7
Interpretation: Lower than both forecast and previous, signaling input price pressures are easing—positive for the Fed’s inflation outlook.
Fed View: Ongoing contraction in manufacturing and lower input prices support the argument that inflation risks are cooling from the supply side, allowing for a more dovish stance.
3. Consumer and Construction
Revised UoM Consumer Sentiment:
Actual: 61.7
Forecast: 62.0
Previous: 61.8
Interpretation: Slightly below forecast, little change—consumer confidence remains relatively subdued.
Construction Spending m/m:
Actual: -0.4%
Forecast: 0.0%
Previous: -0.4%
Interpretation: Same as previous, misses forecast—ongoing weakness in construction and real estate investment.
Fed View: Weak consumer sentiment and persistent soft construction data reinforce slower demand-side dynamics, an argument in favor of pausing or even cutting rates.
4. Inflation Expectations
Revised UoM Inflation Expectations:
Actual: 4.5%
Forecast: Not directly listed (prior 4.4%)
Interpretation: Ticks up slightly, indicating that consumers expect inflation to remain higher. This could temper the Fed’s willingness to cut rates too soon—if expectations become unanchored, the Fed may have to stay hawkish.
Overall Fed Interpretation
Labor market: Softer than forecast, unemployment up—dovish for rates.
Manufacturing/industry: Slight improvement in PMI, but ISM shows contraction; input prices are easing—dovish.
Consumer/construction: Little improvement, still weak—dovish.
Inflation expectations: Up slightly—potential hawkish caution.
Net result: The data is mostly dovish—except for the higher inflation expectation which remains a concern. The Fed will likely see this data as supporting a “watchful pause” and adopt a more flexible stance: no immediate rate cut, but the case for easing is growing unless inflation expectations keep drifting higher. Sustained weak jobs or further easing in prices would increase the chances of a rate cut in coming months. Elevated inflation expectations will keep the Fed cautious about acting too quickly.
#DOLLAR #US10Y #STOCKS #BONDS #YIELD
HYPEUSDT at Support HYPEUSD is trading in a symmetrical triangle and price has now reached the support trendline the price may reverse from here to reach the upper trendline resistance .
