GBP/NZD POTENTIONAL SHORT OPPORTUNITYThis is an idea for GBPNZD's potential short opportunity based on what the technicals indicate.
The trend has been emphasising its bullish approach for almost three years.
Price respected almost 11 times due to the strong resistance within 150 days between 2.265 & 2.275 and bounced off bullish OB on the daily chart and FVG on the weekly chart.
An institutional sharp decline on the weekly chart, followed by a clear wedge, can support a further drop once swept by bearish daily OB. A breakout to the micro wedge (orange) within a macro wedge can also help further down move.
Given that a bearish pin bar followed by a bearish doji is a strong warning signal of potential reversal or bearish continuation that appears inside the micro wedge.
TP1 is considered the first support at the bottom, where the daily OB and the weekly FVG meet at around 2.22000 or the area close to the trendline. If the price breaks through the trendline, TP2 and TP3 will be expected to be achieved.
TP2 may be located at the micro accumulation around 2.20000, and TP3 at the following major support around 2.15000-2.17000 that previously acted as both support and resistance.
Good luck and have a great weekend.
Chart Patterns

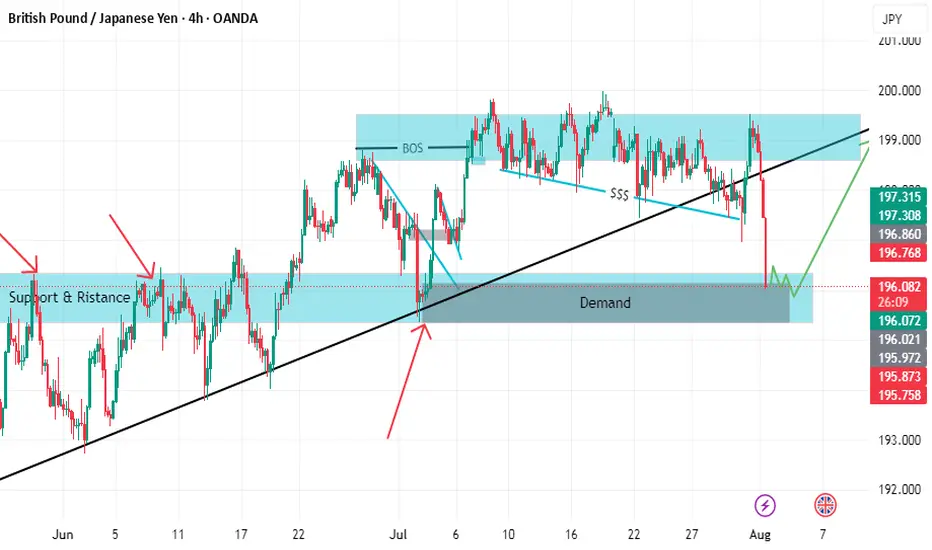
GBPJPY BUY SETUP LOOOOOOOOOOOOONGWELCOME TO YOU
we have support which is strong with retest
and we have demand and before it imbalance if you focus on photo
and the price make bos and take liquidity so i will buy with you .but prefer to be there conformation for buying
ICICI Bank Futures: Eyes on the Reaction ZonePrice is approaching a high-confluence demand zone marked by:
1.50–61.8% Fibonacci retracement
2.Fair Value Gap (FVG)
This also aligns with sell-side liquidity below recent lows — a classic trap zone where smart money might accumulate before reversal.
Expectations:
⚡ Price may wick into this zone → react bullishly → run for buy-side liquidity near 1490.
Confirmation Needed:
Watch RSI reaction + CHoCH on LTF for entry triggers.

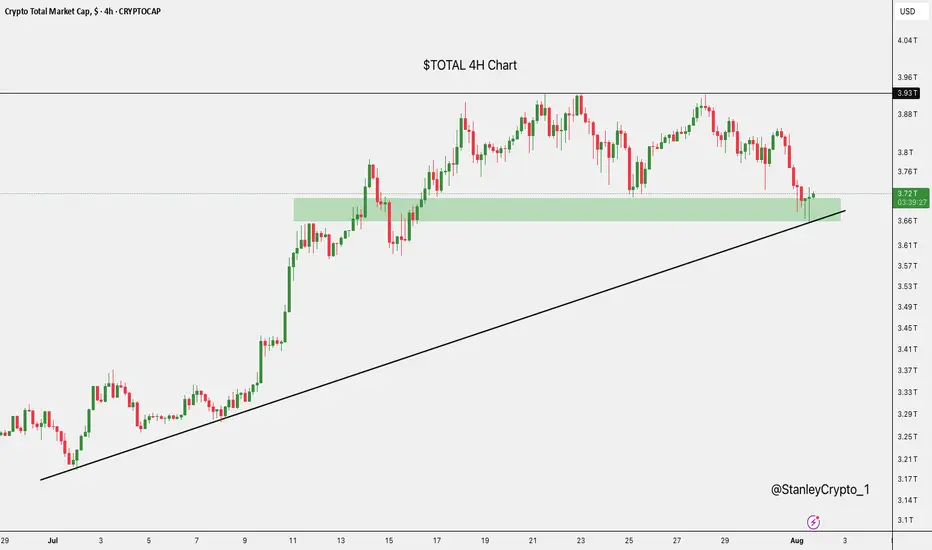
$TOTAL at Key SupportThe crypto market cap has just bounced off a strong support zone around $3.67T, right where it aligns with the rising trendline.
This area has held firm before, and it's doing the same now.
If it continues to hold, we could see a nice recovery.
But if it breaks down, there’s a risk of more downside ahead.
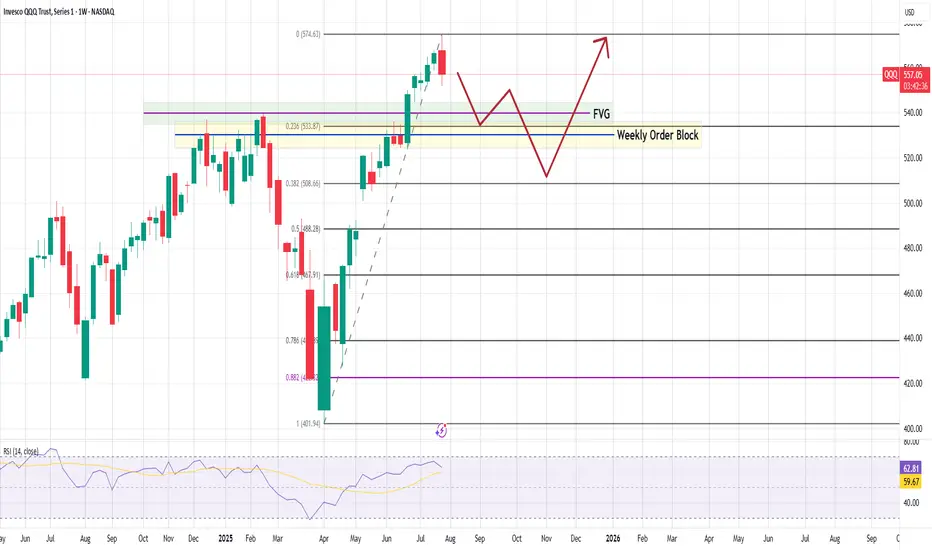
#QQQ Weekly Chart – Technical Breakdown As of August 1, 2025QQQ Weekly Chart – Technical Breakdown
🧠 Key Observations
Bearish Weekly Rejection
A red candle at the recent high ($574.63) suggests buyers are taking profits.
Short-term reversal likely in play.
First Reaction Zone:
0.236 Fib at $533.87 is the first potential bounce zone.
Aligned with:
Fair Value Gap (FVG)
Upper range of the Weekly Order Block (OB)
Deeper Demand Zone:
If $533 fails, the Weekly Order Block becomes critical.
That zone stretches down toward $520–$508 (Fib 0.382).
Strong historical reaction area — may attract long setups if macro aligns.
RSI Divergence Risk:
RSI shows some signs of flattening.
Still above 59, so momentum is intact — but weakening.
📉 Pullback Path (Base Scenario):
Potential move to $533 → $520, consolidating inside the order block
From there, bullish continuation back toward $575+
Invalidated below $500, where structure breaks
📈 Mid-Term Bullish Bias Intact
Strong uptrend, higher lows still in place
Any dip into the OB + FVG zone = buy-the-dip opportunity.
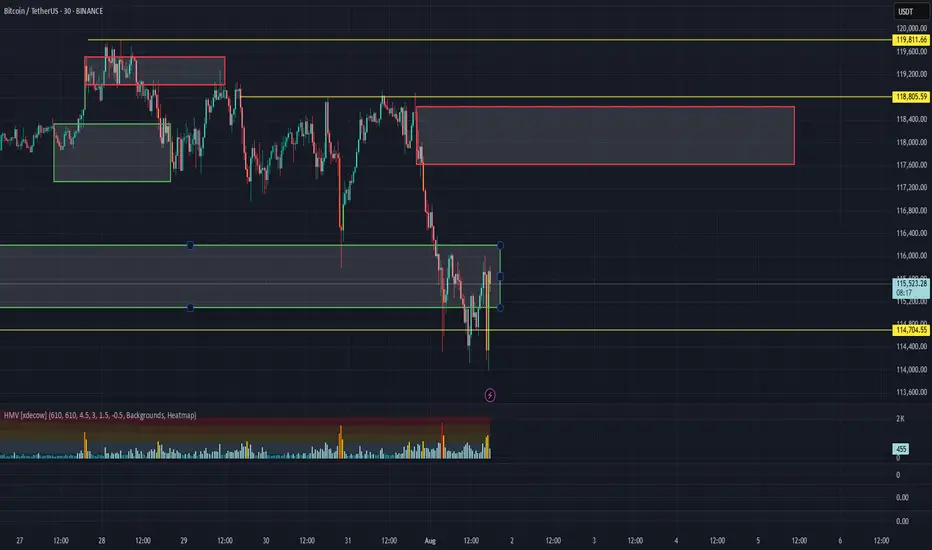
BTC CLS RANGEWaiting for the daily candle to close inside of the range as seen on the graph with the horizontal line.
Then I will be immediatly looking for an entry, either a FVG or a OB or an IFVG. (I will update the entry points asap)
Then I will target 50% of the range as seen on the graph market 0 .5 on the fibonacci retracement where I will take 75% of the position.
Then I will set my SL at my entry price and target the opposing range or LQ which is at 119500-120000K

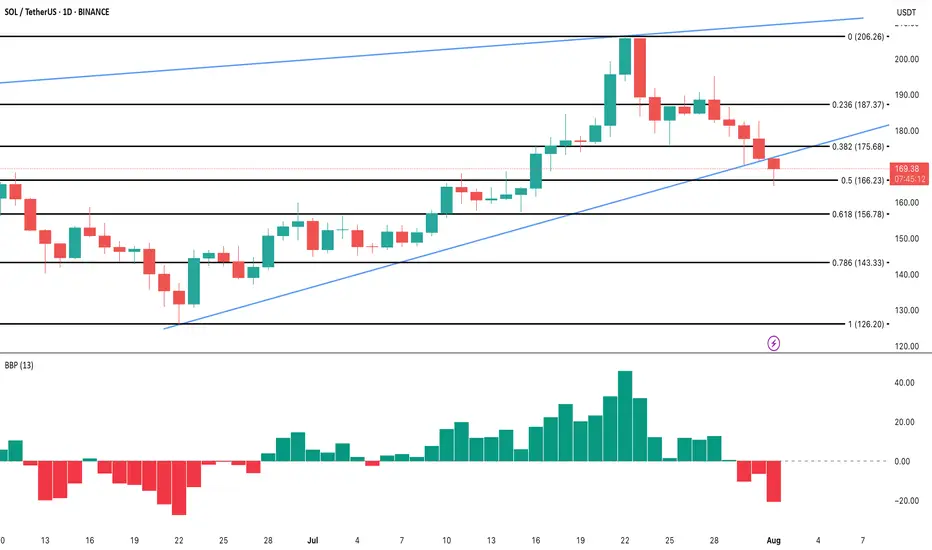
SOL/USDT Analysis – Breakdown or Bear Trap in the Making?The BINANCE:SOLUSDT price has tumbled more than 7.5% in the last 24 hours, breaking below its ascending wedge support on the daily chart. This technical breakdown has shifted market sentiment, with bears now pressing for deeper losses.
The Bull-Bear Power Index has flipped negative for three straight sessions, its longest bearish streak since June. This confirms growing sell-side dominance as BINANCE:SOLUSDT trades around $169, clinging to key support at $166. A clean break below this level could open the way to $156 or even $143, extending the downtrend.
While BINANCE:SOLUSDT price action dominates the picture, network demand has also weakened, with active addresses falling sharply since July’s highs. This dip in participation aligns with the breakdown, hinting that buyers lack the strength to defend key levels. Meanwhile, liquidation data shows that shorts significantly outweigh longs, adding pressure as bearish positions accumulate.
For this to become a classic bear trap , bulls need a swift rebound above $175–$180, forcing shorts to unwind and flipping momentum back positive. Until that happens, the technical setup and order flow favor bears, keeping downside risk firmly in play.
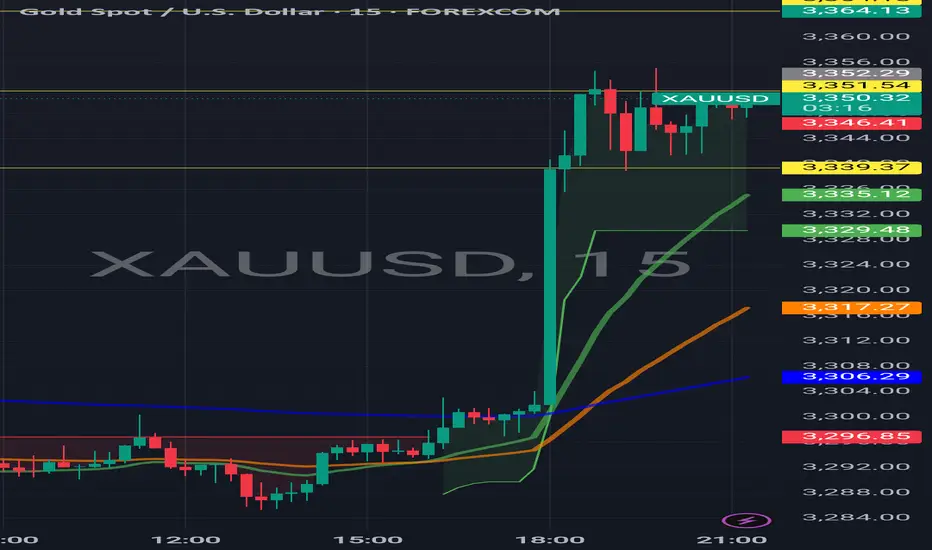
WEAK NFP EFFECTS FOR USA AND DOLLAR#NFP not as expected weakens dollar and shows weaker USA economy growth
Other Currencies and Gold Rising.
Big green candle at 6pm IST exactly when nfp data came
#EURUSD #XAUUSD #USEconomy
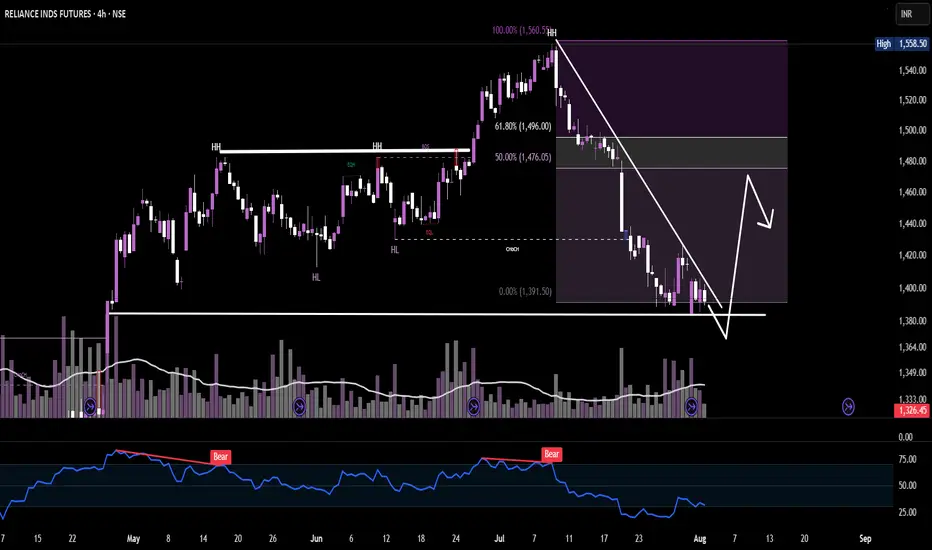
Reliance Futures: Bearish Rally or Relief Bounce Ahead?💬 What’s your take — bounce & dump? Or trend shift incoming?
Type “Bearish bounce” if you see a short setup coming.
CIRCLE Stablecoin Revolution Circle is more than a crypto firm—it’s building infrastructure for a regulated digital dollar economy. With transparent reserves, global licenses, deep financial integrations, and robust blockchain functionality, USDC is rapidly positioning itself as a cornerstone of future finance.
I see a longer term potential for a great investment opportunity given the coming banking revolution involving stable coins.
For a lower risk entry, after a nearly 40% decrease in less than a week, the stock price is currently supported at the VWAP from the original IPO release.
Should the trend continue higher, I would prefer to see a bounce here on the stock.

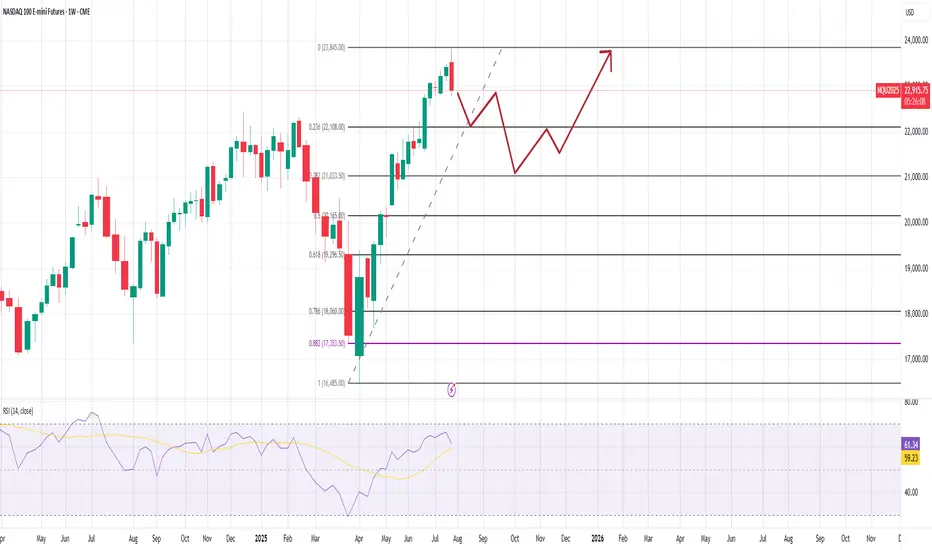
NASDAQ Futures (/NQ) Outlook – Weekly Chart As of August 1,2025NASDAQ Futures (/NQ) Outlook – Weekly Chart
As of August 1, 2025
Current Price: 22,915.75
RSI (14): 61.34 – momentum remains bullish, but cooling off
🧭 Short-Term Outlook:
The recent weekly candle shows strong rejection and a -2.16% drop, suggesting a possible correction phase.
Price is now heading toward the 0.236 Fib retracement zone (~22,120) — a logical short-term support.
If this level doesn't hold, the next major support sits around the 0.382 zone (~21,045), aligning with your second expected zone (~21,000).
🛑 Support Levels to Watch:
~22,120 – Fibonacci 23.6%, prior structure zone
~21,000–21,045 – Confluence with 38.2% Fib + former resistance
~20,175 – 50% retracement, deeper retest if sentiment shifts
Mid-Term Bias (Q4 2025 Outlook):
After this pullback phase, your projected path implies:
A bullish resumption from the support levels (likely from 21k–22k zone)
Consolidation into Q4
A breakout continuation toward new highs above 24,000 into 2026
This outlook remains valid as long as 20,000 holds — a clean invalidation point for medium-term bulls.
Also, whenever the daily Candle closes above high of thid week which is the ~23845 points , this outlook become invalid too.
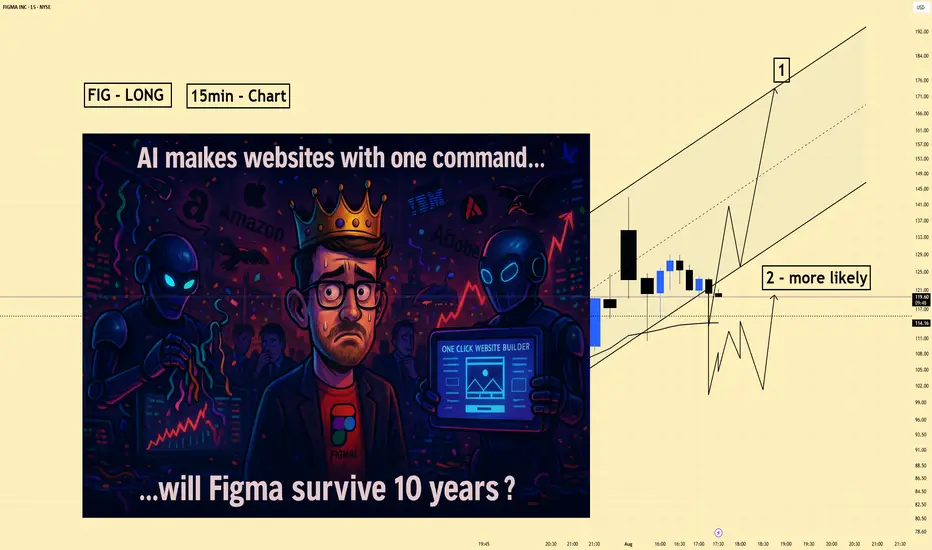
Figma (FIG) | Short Bias | AI Pressure on Design (Aug 2025)Figma (FIG) | Short Bias | AI Pressure on Design Platforms (Aug 2025)
1️⃣ Short Insight Summary:
Figma just went public with a huge IPO pop, but the company faces serious long-term questions. With AI rapidly changing design workflows and tech giants aggressively cutting costs through automation, the design-collaboration market could look very different in a few years.
2️⃣ Trade Parameters:
Bias: Short
Entry: Watching for re-tests near $110–$115 (post-IPO highs)
Stop Loss: Above $120 to protect against strong breakout continuation
TP1: $95
TP2: $80
(These levels can adjust based on broader market reaction and SPX performance)
3️⃣ Key Notes:
Figma is an incredible platform, but it must keep up with AI-powered design tools that can build full websites and products in minutes. We’re already seeing major tech companies (IBM, Amazon, Apple) laying off staff because AI is streamlining operations. If Figma doesn’t stay ahead, its massive IPO valuation could be hard to justify.
S&P 500 reaction is also key—if the index weakens, high-flying IPO names like Figma could see sharper corrections.
4️⃣ Follow-up:
I’ll revisit this trade idea after we see how price reacts around the $110–$115 zone and how broader market sentiment plays out.
Please LIKE 👍, FOLLOW ✅, SHARE 🙌 and COMMENT ✍ if you enjoy this idea! Also share your ideas and charts in the comments section below! This is best way to keep it relevant, support us, keep the content here free and allow the idea to reach as many people as possible.
Disclaimer: This is not financial advice. Always conduct your own research. This content may include enhancements made using AI.
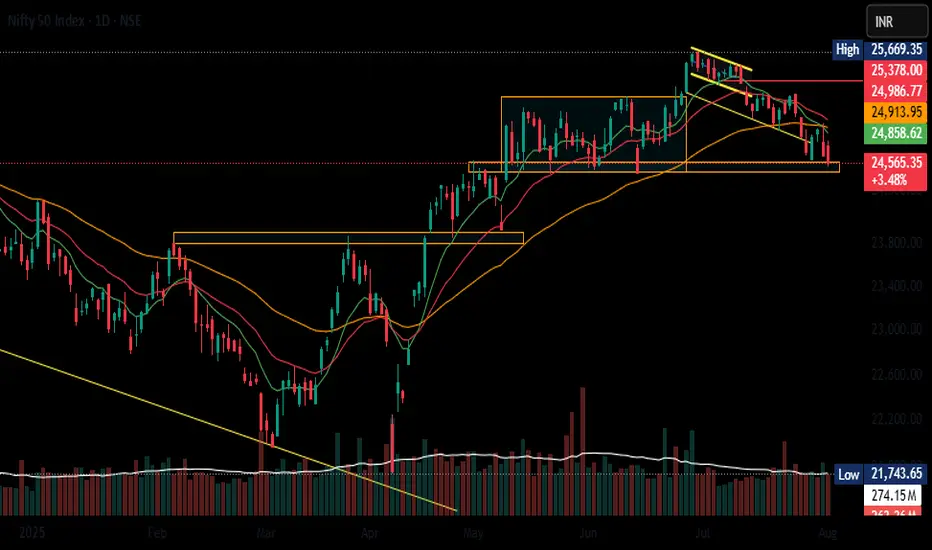
Time to be cautious Nifty is at make or break levels, Be careful about general market trends before jump into any new trades.
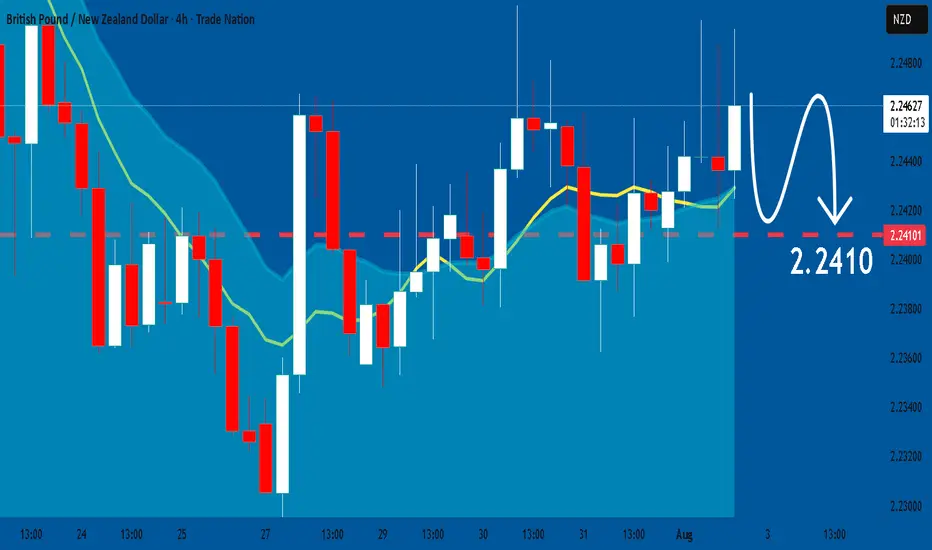
GBPNZD: Will Keep Falling! Here is Why:
The charts are full of distraction, disturbance and are a graveyard of fear and greed which shall not cloud our judgement on the current state of affairs in the GBPNZD pair price action which suggests a high likelihood of a coming move down.
Disclosure: I am part of Trade Nation's Influencer program and receive a monthly fee for using their TradingView charts in my analysis.
❤️ Please, support our work with like & comment! ❤️
$BTC needs a massive diaper change....BTC is crossing key technical points, pointing clearly in an bearish trend. The trend will likely accelerate and potentially aggressively. I have been through several turns, not financial advise and always do your due diligence, but for those who are up: sell and and don't get emotional about BTC, unless there is a clean / clear support levels. Crypto bros will be eating rice and beans very soon and still be trying to FOMO crypto. This could be way worse than FTX!
Stay safe and for signal support levels use UltraAlgo to avoid wasting time trying to find support / resistance levels.....best of luck!

A2ZUSDT?
Heavy Sells at 0.005000
We would want to see heavy buy and break this 0.005000
I hope to see prints of 0.010000
Wish me luck
All the best
NOt a guru

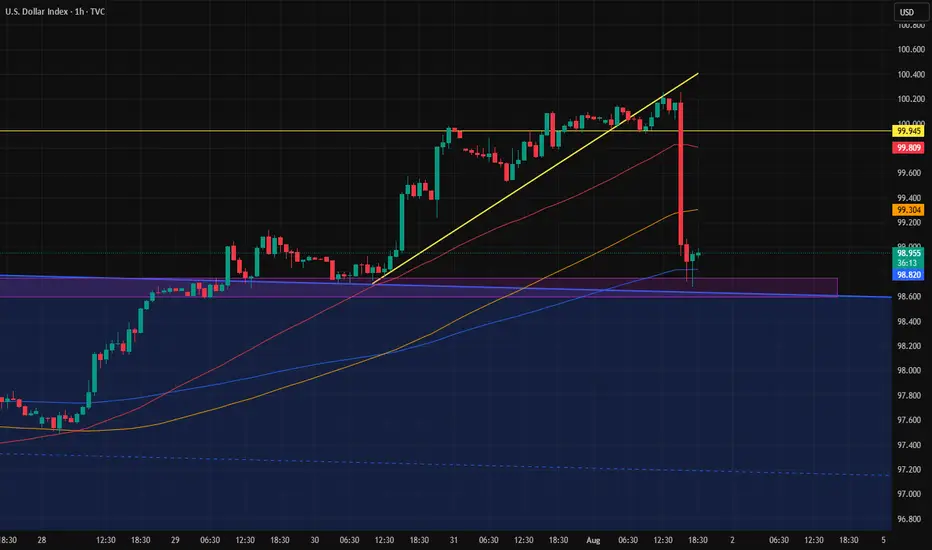
The strength of the PMI reportWe all saw how a large and strong candle formed right after the news, hitting the top of the previous channel.
So now that channel top zone has proven to be valid.
Now we have to see whether this candle leads to another drop in the dollar, or if the dollar recovers and slowly starts moving back toward 100.
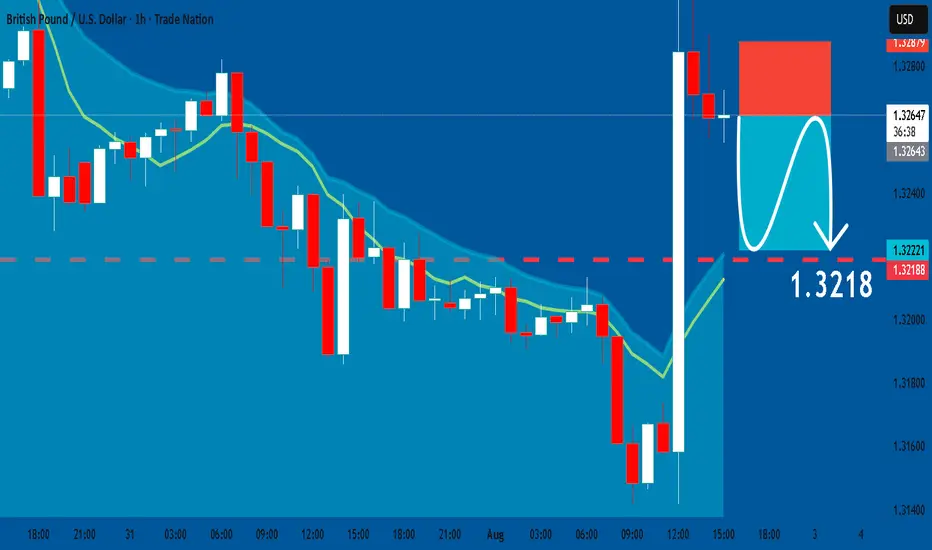
GBPUSD: Bearish Continuation & Short Signal
GBPUSD
- Classic bearish setup
- Our team expects bearish continuation
SUGGESTED TRADE:
Swing Trade
Short GBPUSD
Entry Point - 1.3264
Stop Loss - 1.3287
Take Profit -1.3218
Our Risk - 1%
Start protection of your profits from lower levels
Disclosure: I am part of Trade Nation's Influencer program and receive a monthly fee for using their TradingView charts in my analysis.
❤️Please, support our work with like & comment! ❤️
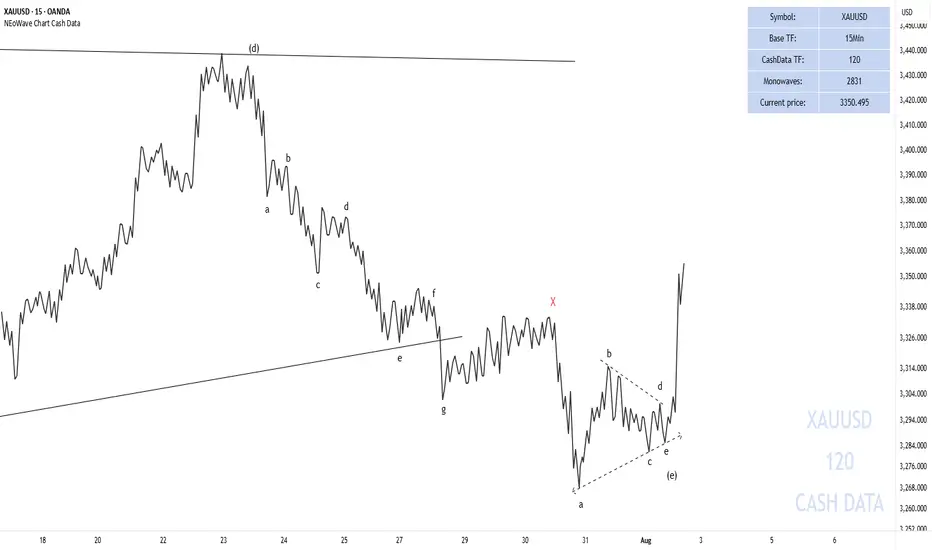
End of GOLD correction#GOLD #XAUUSD
UPDATE
As I mentioned earlier, gold was forming a contracting triangle.
The wave-(e) of the triangle has formed a double pattern diametric-X-triangle and has moved beyond my expectations (the post-pattern movement has passed ), breaking the trendline of (a)-(c). However, since it did not exceed the end of wave-(c), the contracting triangle has not been invalidated.
We expect gold to gradually rise from this range and surpass $3,500.
Good luck
NEoWave Chart
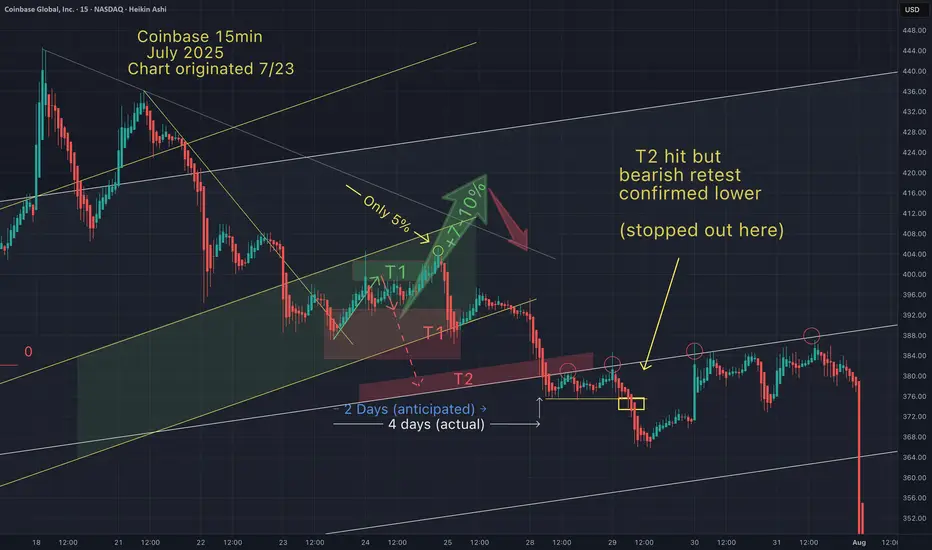
Coinbase - T2 hit (but stopped out)We can't win them all, but I can limit my losses by knowing where are the best entry points, and quickly understanding how/when my strategy gets invalidated. So I know where to set my stop losses and minimize risk. Proper risk management is key.
I'm more focused on Btc and alts, but if anyone is interested in more of my Coinbase trading ideas let me know.
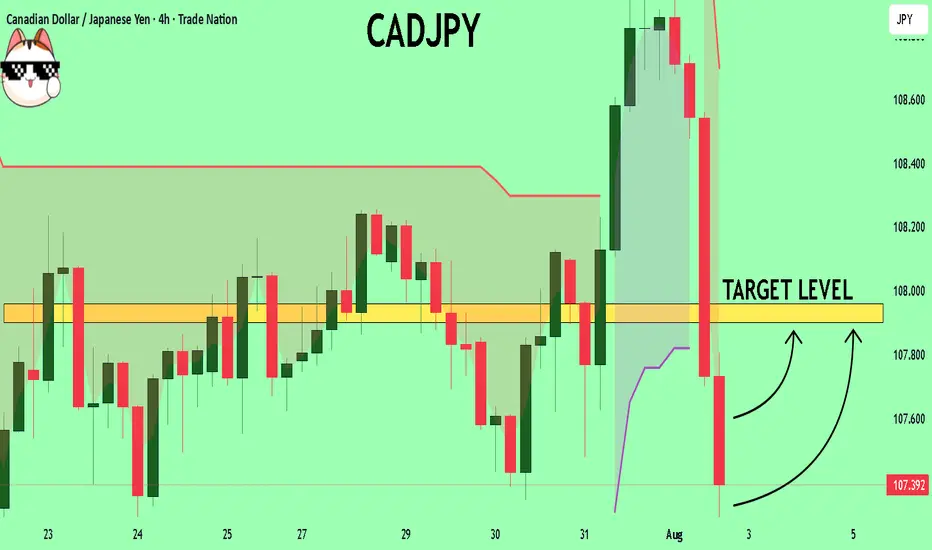
CADJPY Expected Growth! BUY!
My dear friends,
CADJPY looks like it will make a good move, and here are the details:
The market is trading on 107.35 pivot level.
Bias - Bullish
Technical Indicators: Supper Trend generates a clear long signal while Pivot Point HL is currently determining the overall Bullish trend of the market.
Goal - 107.90
About Used Indicators:
Pivot points are a great way to identify areas of support and resistance, but they work best when combined with other kinds of technical analysis
Disclosure: I am part of Trade Nation's Influencer program and receive a monthly fee for using their TradingView charts in my analysis.
———————————
WISH YOU ALL LUCK
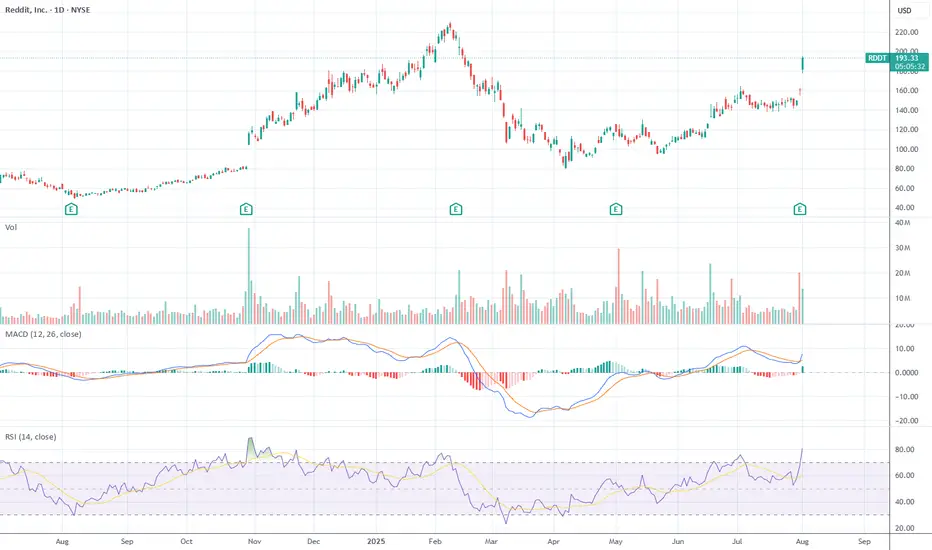
Reddit (RDDT) – Technical + Earnings + Macro Breakdown Just finished breaking down Reddit (RDDT) after today’s big move, and I think it’s worth laying out the full picture — technicals, earnings, macro — because this one’s got real substance underneath the headline jump.
TL;DR: this is a real breakout, not meme hype, but it's happening in a fragile macro context, and you absolutely shouldn't chase it blindly.
Let’s start with the chart. Today’s candle, so far, is textbook bullish — almost marubozu-style — opening near the lows and closing near the highs, up 4.74% on serious volume. No upper wick, which means buyers were in control all day. This came right after earnings and broke out of a multi-month range that had been holding since April. Price smashed through the $170–175 zone, which was the prior swing high from March. That’s a legitimate breakout. And the volume confirms it’s not retail FOMO. Technically, it’s a continuation move, not a reversal, but it’s also coming at the tail end of a very sharp thrust. This is a bullish continuation pattern, but one where you start looking for digestion, not acceleration.
Momentum-wise, everything is flashing green — but maybe too green. MACD just made a fresh bull cross with an expanding histogram, and RSI is screaming at 88.69. That’s extreme, no two ways about it. But when you get this kind of breakout on strong earnings, RSI can stay overbought for days or even weeks. The trend since May has been a clean stair-step move higher — no parabolic blow-off yet — but today might be the first sign of euphoria starting to creep in.
If you’re a box fan, this move also fits the mold. The $110 to $175 range held from April through July, and we just broke out of that box with volume confirmation. Logic would project a target by adding the range width (~$65) to the breakout level — that puts a rough upside target at $240. Of course, these moves rarely go straight up — you usually see a break, a retest, and then a continuation. So don't expect a clean shot to $240. Still, the technical structure is legit.
Now let’s zoom in on some Fib levels from the May swing low at $110 to today’s high of $191. If we get a pullback, the first dip zone is the 23.6% retracement at $171.52. That’s close to today’s breakout level, so watch that carefully. Below that, $157.27 (38.2%) is the major reload zone, and $150.50 (50%) is where trend-followers should probably stop out if it breaks with volume. On the upside, the 127.2% extension sits at $215.76, then 161.8% at $241.39, and finally 200% at $272. Realistically, $191 is acting as the first resistance cap, since it's the full 100% extension from the move.
Now here’s where things get even more interesting — fundamentals. This earnings print was strong. No massaging, no fancy adjustments — just raw numbers. Revenue was up 78% year-over-year, hitting $500M. Net income? $89M GAAP. Yes, actual profits. And Reddit’s positioning in the AI narrative is no joke — they’re now the most cited domain for AI model training across the board. Wall Street is obsessed with “data moats” right now, and Reddit has one of the deepest UGC data pools available. Ads are booming too — ad revenue up 84% YoY. CFO basically said they’ve found the balance between growth and profitability, which ticks boxes for both value and growth investors. Bottom line: this is the quarter where Reddit starts getting re-rated from “weird social media” to “AI-leveraged data platform with real margins.”
But — and this is important — macro risk is back. Today wasn’t just a feel-good market day. We got downward payroll revisions (which makes the labor picture look worse in hindsight), and tariffs are being reintroduced, which is never good for risk appetite — especially in tech. If yields spike or markets start pricing in more Fed tightening, high-growth names like Reddit will feel it. You can't ignore that RSI is already 88 — meaning if the macro starts rolling over, Reddit is at real risk of a fade purely due to liquidity rotation.
So tactically, this is a setup where you respect the breakout, but you don’t chase it. First support is $171.52 — that’s your first pullback buy zone. Then $157.27 is your deeper dip/reload level. On the upside, $191 is resistance. If it breaks cleanly above and holds with volume, $215 is the next stop. If it slices below $157 with volume, that’s a red flag and probably invalidates the trend for now.
Final take? RDDT is one of the best fundamental stories this quarter, and today’s move was backed by structure and volume. But we’re late in the thrust, macro is fragile, and sentiment is stretched. Be patient. Wait for a pullback or tight consolidation above $171. If that holds, $215+ is on deck. If it doesn’t, sit back and wait for the dust to settle — this trend isn’t dead, but it’s not invincible either.
BTC/USDT Analysis – Negative Sentiment Returns
Hello everyone! This is the daily analysis from the trader-analyst at CryptoRobotics.
Yesterday, Trump officially imposed tariffs on 68 countries, which are set to take effect on August 7. The legality of these tariffs is already being challenged in court. The market reacted extremely negatively to this development — despite the overall positive technical setup and volume distribution, Bitcoin dropped to $114,000, deeply testing the volume zone and local lows.
Despite all of this, the bullish scenario should not be ruled out. The price action during the decline has been weak: while selling pressure is high, it has not led to a full breakdown of the lows. At this stage, it’s better to avoid opening new positions. Consider long setups only after a test of the $117,600–$118,600 supply zone, and watch for a buyer’s reaction on the retest.
If negative momentum continues, the price could drop further to the next support zone.
Buy zones:
• $110,000–$107,000 (accumulated volumes)
Sell zones:
• $117,600–$118,600 (accumulated volumes)
This publication is not financial advice.