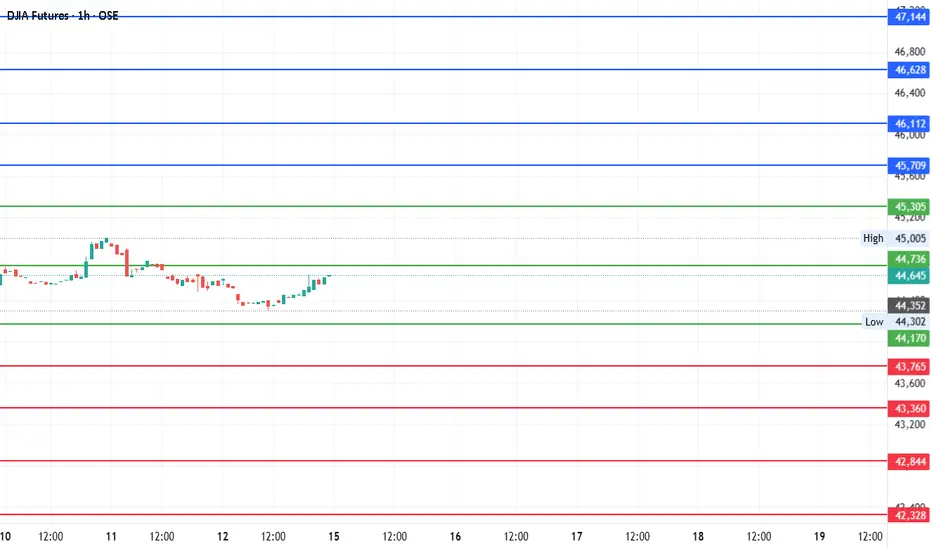
#DJI Futures Outlook: Key Levels to Watch Around Pivot 44,736Date: 14-07-2025
📊 Current Price: 44,645
📍 Pivot Point: 44,736.00
🔼 Upside / Bullish Scenario
If the price sustains above the pivot point (44,736), it could target the following resistance and bullish targets:
Immediate Resistance: 45,305.40
Target 1: 45,708.70
Target 2: 46,112.00
Target 3: 46,628.00
Target 4: 47,144.00
Bullish Bias Trigger: A break and hold above 45,305.40 increases confidence in these targets.
🔽 Downside / Bearish Scenario
If the price moves and holds below the pivot, the focus shifts to support levels and bearish targets:
Immediate Support: 44,170.04
Target 1: 43,765.02
Target 2: 43,360.00
Target 3: 42,844.00
Target 4: 42,328.00
Bearish Bias Trigger: A break below 44,170.04 opens the door to these downside levels.
#DowJones #TradingView #StockMarket #Investing #Trading #DJIFutures
#PivotPoints #DowJones #MarketOutlook #FuturesTrading
Chart Patterns
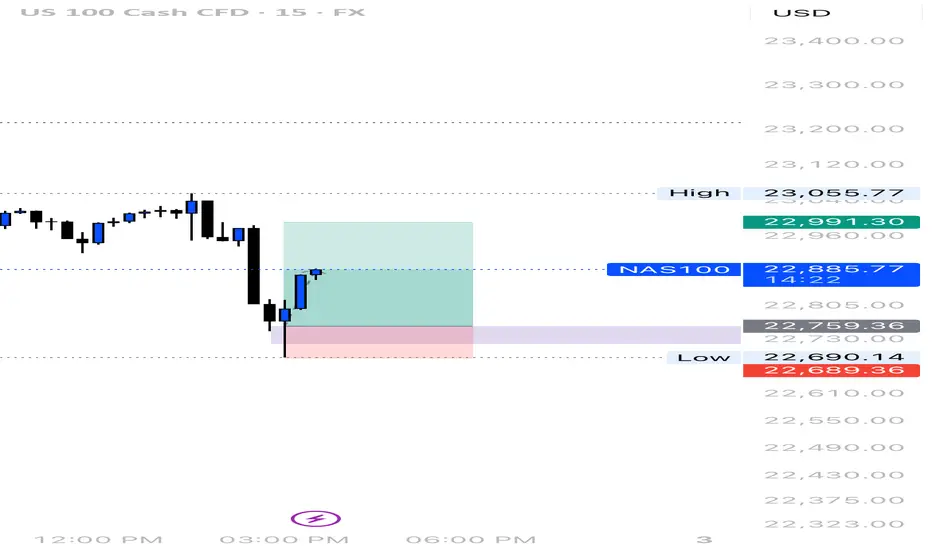
OUR TRADE TODAY ON NASDAQBeen a while since I last posted here, today I’m sharing with you our trade we took 15min ago with an RR of 3
Follow for more
GOLD: Target Is Down! Short!
My dear friends,
Today we will analyse GOLD together☺️
The market is at an inflection zone and price has now reached an area around 3,353.10 where previous reversals or breakouts have occurred.And a price reaction that we are seeing on multiple timeframes here could signal the next move down so we can enter on confirmation, and target the next key level of 3,335.20..Stop-loss is recommended beyond the inflection zone.
❤️Sending you lots of Love and Hugs❤️

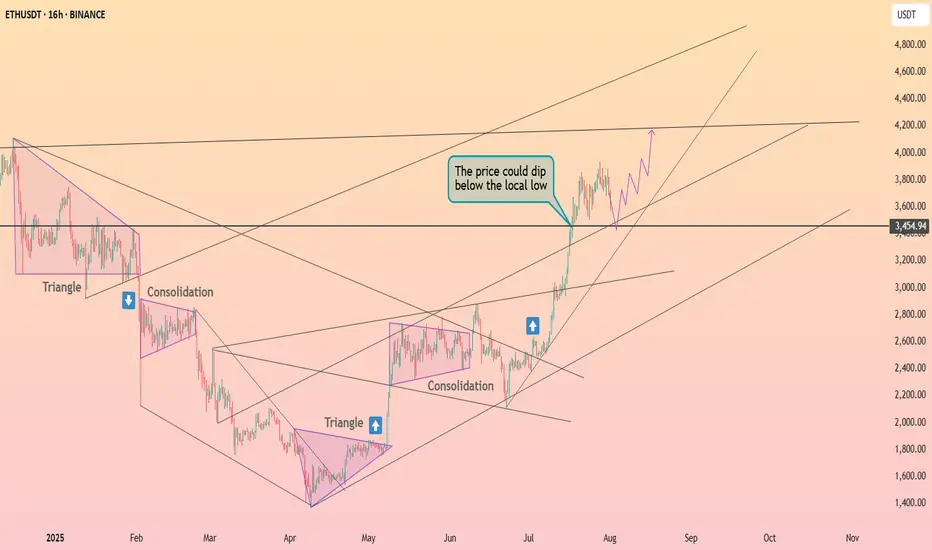
Ethereum will fix above the $2450 ┆ HolderStatBINANCE:ETHUSDT is stabilizing above $3,450 after a strong parabolic move. A minor dip beneath local lows is possible, but the structure remains bullish. If the level holds, expect continuation toward $4,200 as momentum builds.
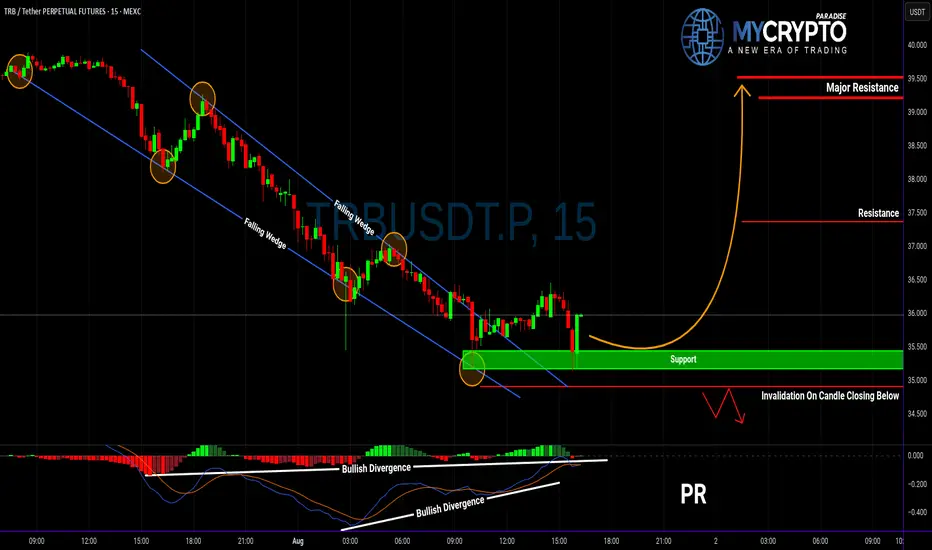
Is TRBUSDT About to Explode or Fake Out Everyone Again?Yello Paradisers! After weeks of quiet price action, is TRBUSDT finally gearing up for a real breakout—or is this just another trap before the next leg down? Let’s break it all down, because the next move could catch many traders on the wrong side.
💎TRBUSDT has recently broken out of a falling wedge pattern, accompanied by a clear bullish divergence—an encouraging sign that momentum may be shifting in favor of buyers. This type of setup historically carries a higher probability of a bullish move, especially if the breakout holds above key support levels. However, the entry strategy here is critical.
💎Ideally, we want to see a minor pullback. If that happens, it could offer a solid bounce opportunity from well-defined support zones, giving a favorable risk-to-reward setup. This is the scenario where patient traders will find the highest probability entries. On the other hand, aggressive traders might consider entering from current levels, but they must understand that doing so offers a less favorable risk-to-reward ratio. Jumping in too early without a clear confirmation could expose you to unnecessary risk, especially if the market reverses quickly.
💎More importantly, we have a clearly defined invalidation level. If TRBUSDT breaks below that level and closes a candle beneath it, this would invalidate the current bullish setup completely. In such a case, the best course of action would be to step aside and wait for a new structure or more reliable price action to form. Forcing trades in uncertain territory is how capital is lost and confidence shaken.
Strive for consistency, not quick profits. Treat the market as a businessman, not as a gambler. Protecting your capital and waiting for high-probability opportunities is what separates professional traders from the rest. Patience here could be the difference between a calculated win and a costly mistake.
MyCryptoParadise
iFeel the success🌴
BITCOIN CME GAP IS FILLING RIGHT NOW!#Bitcoin CME Futures
Bitcoin is dipping — and all signs point to the CME gap getting filled.
Historically, these dips have been aggressively bought, so a strong bounce from here looks likely.

Range again $ETHDue to typical ETH behavior we can form a range
Can be identified without any lines where I suppose will stay for a month or so consolidating

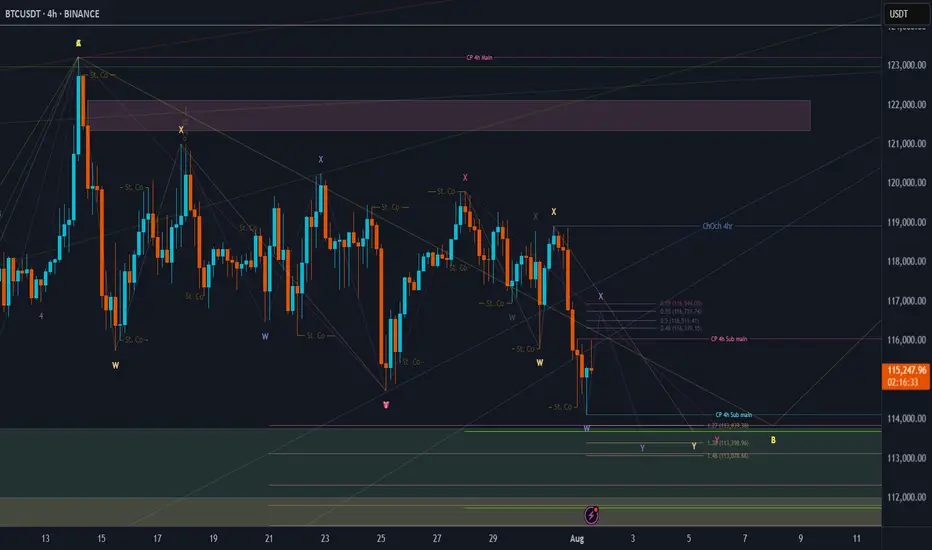
BTC Price Prediction and Elliott Wave AnalysisHello friends,
>> Thank you for joining me in my analysis. We have finished the pink X wave directly, then we have gone to the final pink Y wave, which consists of wxy in orange counting. Now we are moving into the final Orange Y wave.
>> our confirmations:
* 4Hr TF: Breaking 118990 for the next hours, we will end the whole Yellow B "correction" wave successfully. .
Keep liking and supporting me to continue. See you soon!
Thanks, Bros
More Pullback=Further Launch!!The structure has morphed
once again but the direction expectation
is still 100% in tact. In fact, all
we're doing right now is pulling
the bow string back a little more to
allow the arrow to fly up that
much further and faster! BTFD!!!!

TradeUSAsignals RecommendationsLong (5% of your portfolio) GLXY (Order filled @ 29.57)
We have an up trend under Time traders control (brown arrow) with a correction more than 38.2%.


Xlm -Just hit my T2 target7/23- My first post
-Xlm was $.42
7/24- T2 (top of range) hit $.4
7/27-Pumped 15%
as anticipated
8/1 -T2 bottom Hit (WT)
Could go lower and hit WT Low...
But I love it when a plan comes together.
I hope my T3 doesn't get hit (after this bounce).
May the trends be with you.

Binance coin around $760 ┆ HolderStatBINANCE:BNBUSDT has retraced from its recent high and is consolidating just above $770, a former resistance now acting as support. A bounce from this level would reinforce the uptrend and open the door for a potential push toward $860, continuing the bullish structure.

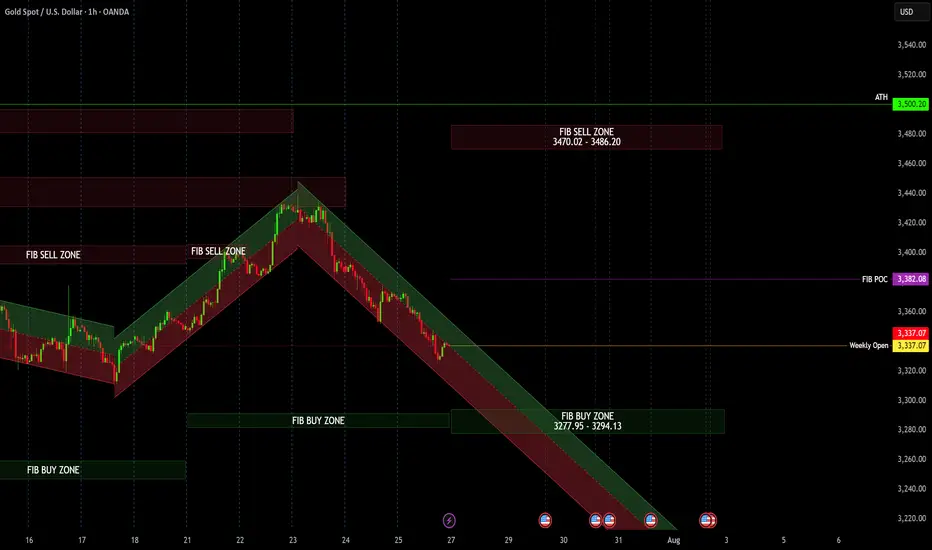
Gold weekly outlookFib Buy and Sell zones for the week ahead. Pay attention to a change in trend. Mondays are usually no trade days and just to watch the market decides.
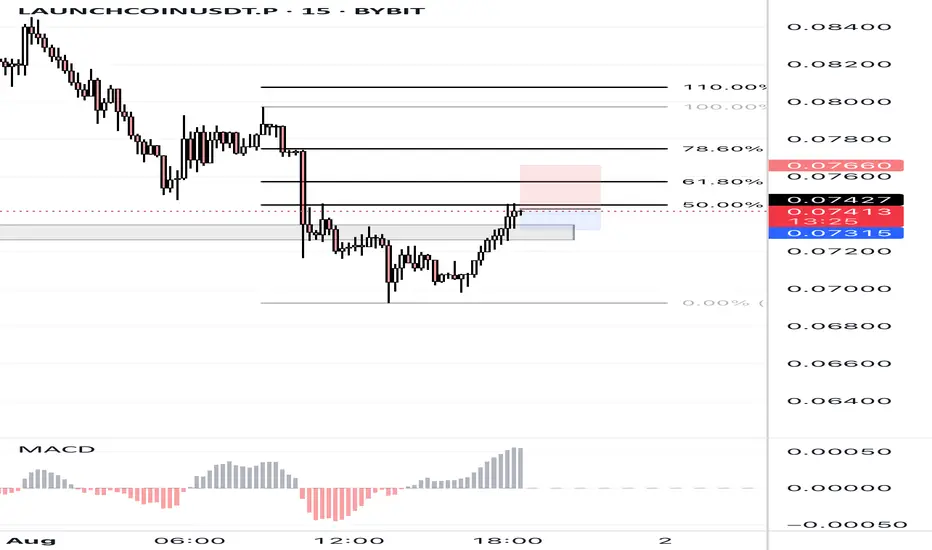
LAUNCHCOINUSDT.P | 50% Fibonacci Rejection – Bearish Reaction LiLAUNCHCOINUSDT.P is showing signs of exhaustion after a clean pullback to the 50% Fibonacci level (0.07427). Price is rejecting the key resistance zone, aligning with the broader downtrend structure.
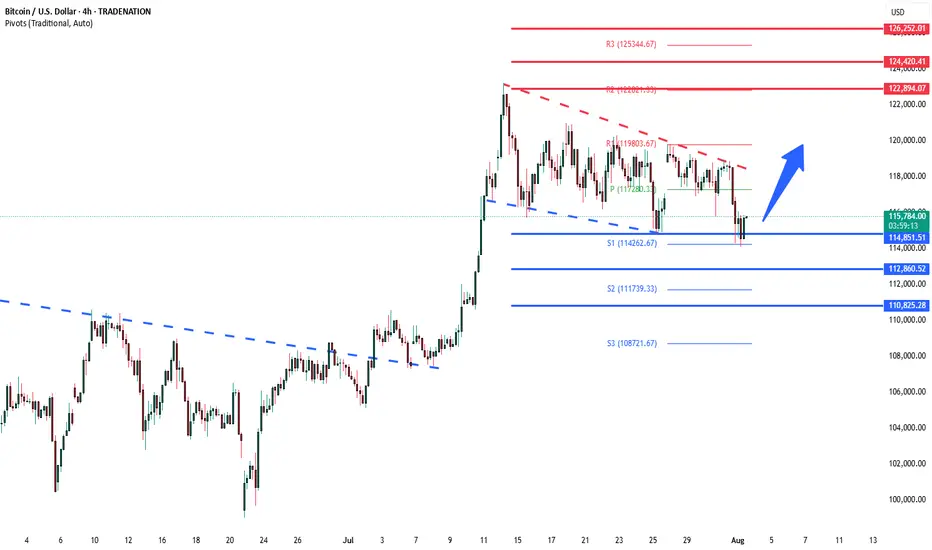
BTCUSD consolidation support at 114,850The BTCUSD remains in a bullish trend, with recent price action showing signs of a corrective pullback within the broader uptrend.
Support Zone: 114,850 – a key level from previous consolidation. Price is currently testing or approaching this level.
A bullish rebound from 114,850 would confirm ongoing upside momentum, with potential targets at:
122,900 – initial resistance
124,420 – psychological and structural level
126,250 – extended resistance on the longer-term chart
Bearish Scenario:
A confirmed break and daily close below 114,850 would weaken the bullish outlook and suggest deeper downside risk toward:
112,860 – minor support
110,825 – stronger support and potential demand zone
Outlook:
Bullish bias remains intact while the BTCUSD holds above 114,850. A sustained break below this level could shift momentum to the downside in the short term.
This communication is for informational purposes only and should not be viewed as any form of recommendation as to a particular course of action or as investment advice. It is not intended as an offer or solicitation for the purchase or sale of any financial instrument or as an official confirmation of any transaction. Opinions, estimates and assumptions expressed herein are made as of the date of this communication and are subject to change without notice. This communication has been prepared based upon information, including market prices, data and other information, believed to be reliable; however, Trade Nation does not warrant its completeness or accuracy. All market prices and market data contained in or attached to this communication are indicative and subject to change without notice.
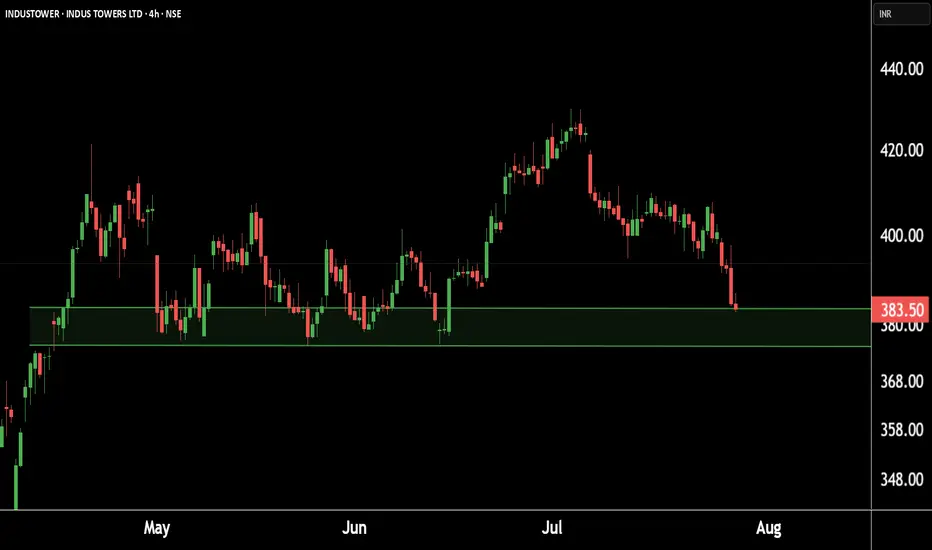
Indus Towers showing strength at key levels!Eyes on a potential.This is the 4 hour chart of INDUSTOWER.
INDUSTOWER having a good Support level near at 370-375.
if this level is sustain , then we may see higher prices in INDUSTOWER.
Thank You !!
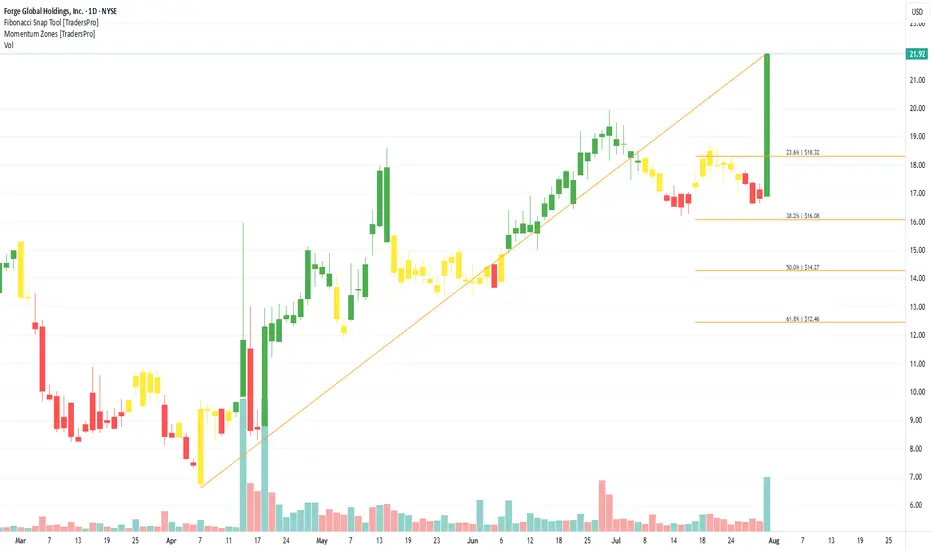
Forge Global Holdings, Inc. (FRGE) Unlocks Pre-IPO AccessForge Global Holdings, Inc. (FRGE) is a leading marketplace for trading private company shares, connecting investors and institutions to pre-IPO opportunities. The platform provides access to data, insights, and trading solutions that help investors navigate the private market space. Forge Global’s growth is fueled by increasing demand for alternative investments, more companies staying private longer, and a rising interest in unlocking liquidity from private equity holdings.
On the chart, a confirmation bar with rising volume indicates strong buyer momentum. The price has moved into the momentum zone after breaking above the .236 Fibonacci level. A trailing stop can be set just below this Fibonacci level using the Fibonacci snap tool, allowing traders to secure profits while leaving room for further gains.
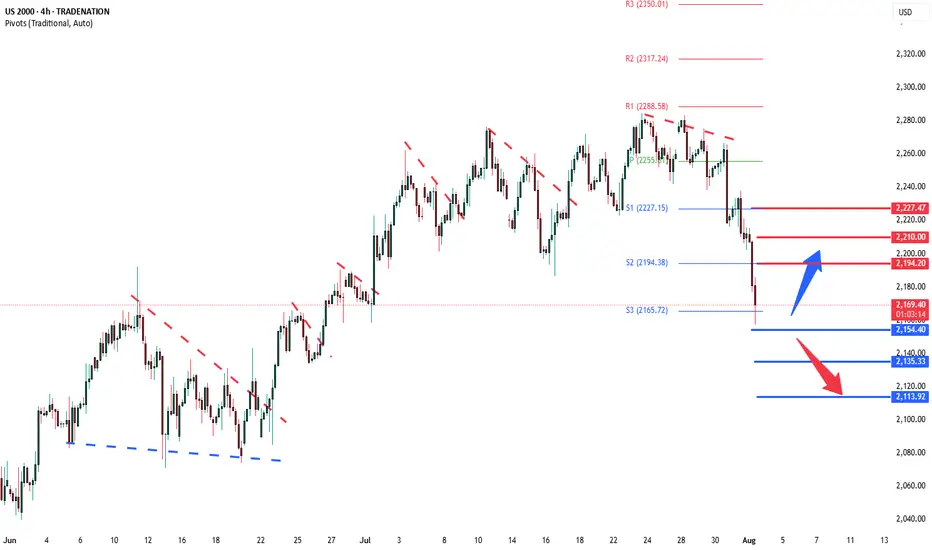
Russell2000 Key Trading LevelsKey Support and Resistance Levels
Resistance Level 1: 2194
Resistance Level 2: 2210
Resistance Level 3: 2227
Support Level 1: 2154
Support Level 2: 2135
Support Level 3: 2113
This communication is for informational purposes only and should not be viewed as any form of recommendation as to a particular course of action or as investment advice. It is not intended as an offer or solicitation for the purchase or sale of any financial instrument or as an official confirmation of any transaction. Opinions, estimates and assumptions expressed herein are made as of the date of this communication and are subject to change without notice. This communication has been prepared based upon information, including market prices, data and other information, believed to be reliable; however, Trade Nation does not warrant its completeness or accuracy. All market prices and market data contained in or attached to this communication are indicative and subject to change without notice.
Gold Rejected 3280… What’s Next?Price tapped into the key demand zone and bounced hard—exactly what we wanted to see.
Now the question is.
Is Gold ready to reclaim the highs?

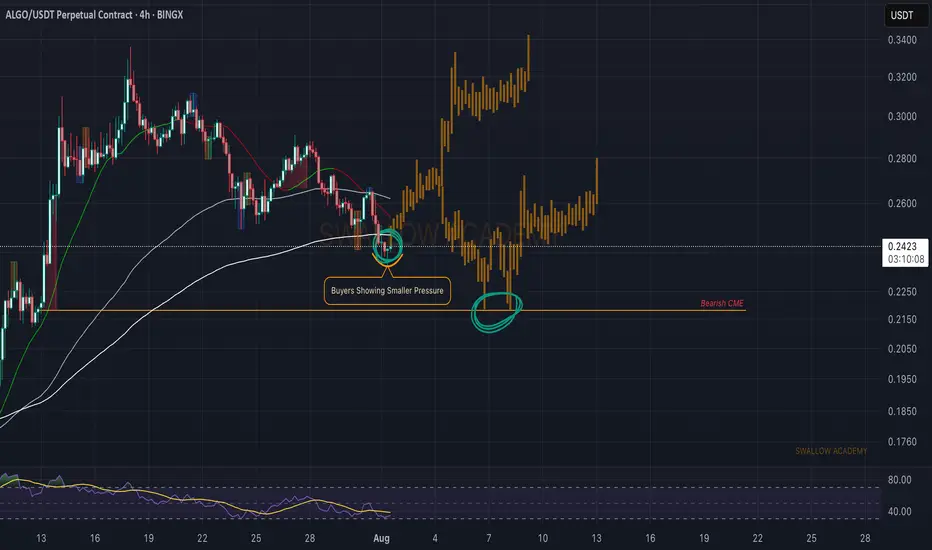
Algorand (ALGO): Seeing Signs of RecoveryAlgorand has made a market structure break (MSB) on smaller timeframes, which is indicating a potential trend switch here.
Now in the current timeframe we are looking for a break of that 200 EMA, as once we see the buyers take full control over it, we will look for buyside movement so eyes on it!
If for any reason we see further movement to lower zones, and we break local low on small timeframes, we are going to aim for that bearish CME, but for now, we are bullish.
Swallow Academy

DAX - potential buyPotential buy on the German index as we are coming out of the 30min correction that followed a first small impulse to the upside. Conservative target is a move equivalent to the first 30 min setup. Optimal target are the break of the top and even better the 24.85 area. Levels on the chart. Trade with care.
