Chart Patterns
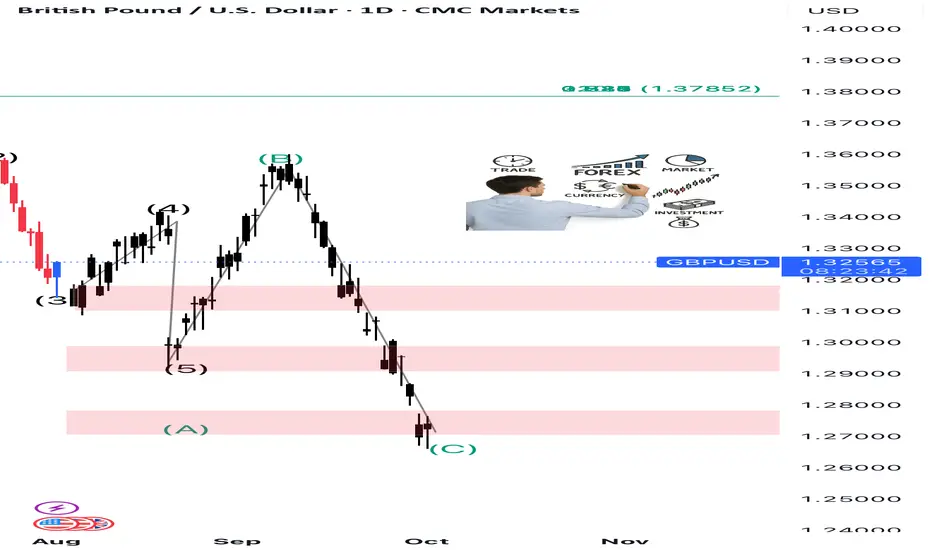
Exciting GBP/USD
🚨 **We’re currently deep in wave (2) correction**
What’s unfolding? Most likely a zigzag — or even a double zigzag. Volatility is cooking up something big!
💥 But here’s the real thrill… once this phase wraps up:
📈 **Brace for a fiery wave (3) rally** — a breakout move that could shake up the market 💸
🎯 Ready to ride the next wave? This is not the time to sit back — smart analysis and timely action could make all the difference.
#Forex #TechnicalAnalysis #GBPUSD #OpportunityIsComing

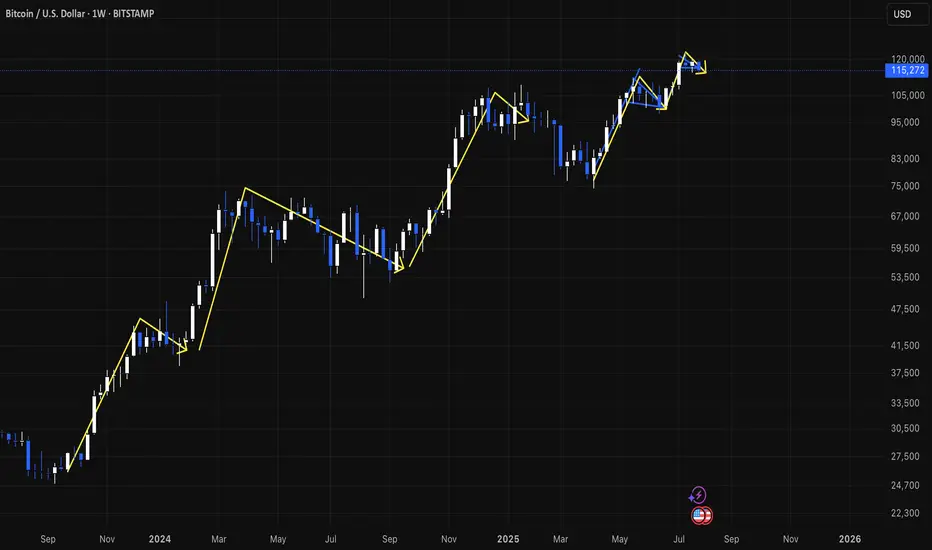
btc consolidation and downentire bull market has been big impulse move up then consolidation and slightly more down than would be expected with typical bull flag
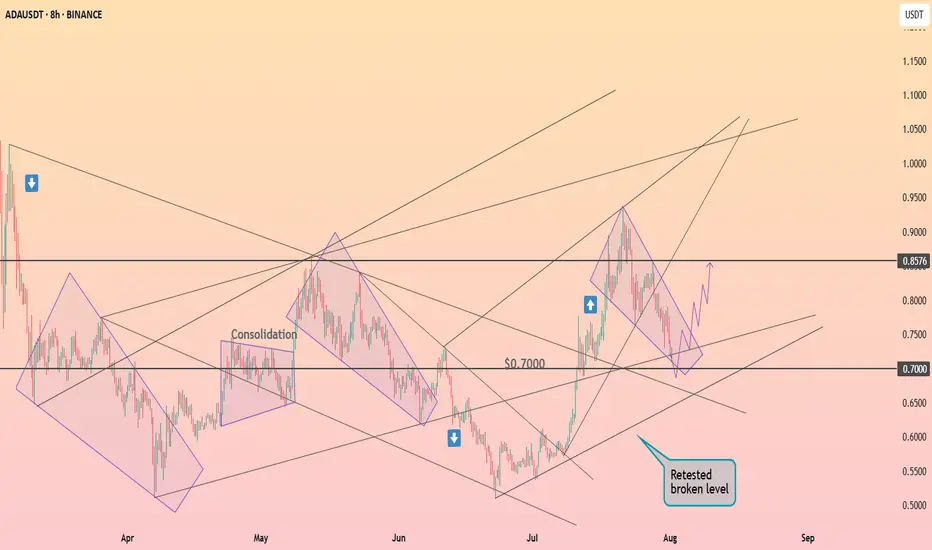
Cardano is forming the falling wedge ┆ HolderStatBINANCE:ADAUSDT is testing the $0.70 level after a clean breakout from previous consolidation. The current retracement channel indicates a controlled pullback, likely to flip into bullish continuation if $0.70 holds. Watch for a move toward $0.8576 once the pattern breaks upward.
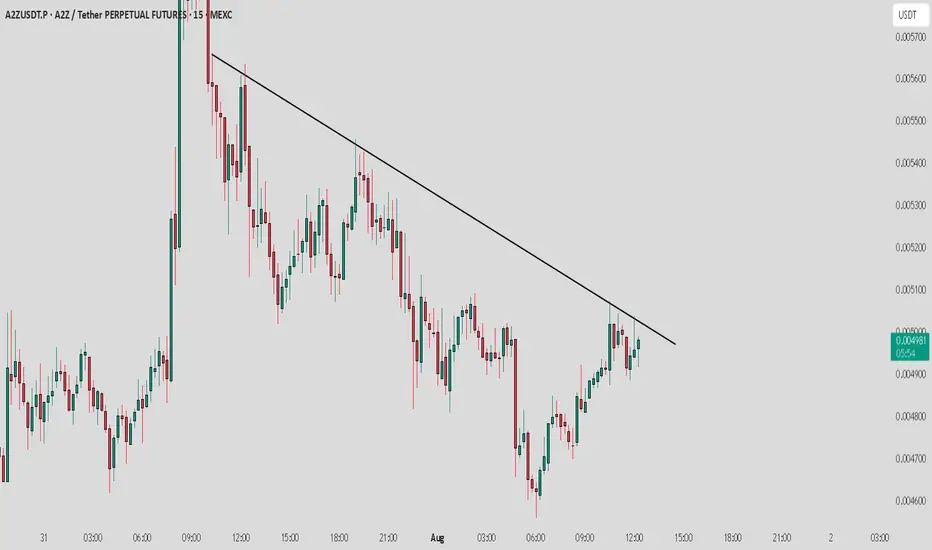
A2Z / USDT : Near Trendline resistance , Keep a close watch A2Z/USDT - Nearing Trendline Resistance
A2Z/USDT is approaching a crucial trendline resistance. Although it looks weak at the moment, a successful breakout could trigger a short-term rally of 10-15%.
Bullish Scenario:
If the price breaks above the trendline, we could see a sharp move upwards, with potential gains of 10-15%. Watch for confirmation of the breakout with higher volume and momentum.
Bearish Scenario:
Failure to break the resistance could lead to further consolidation or a potential reversal, testing lower support levels.
Keep an eye on the trendline and volume for the next key move.
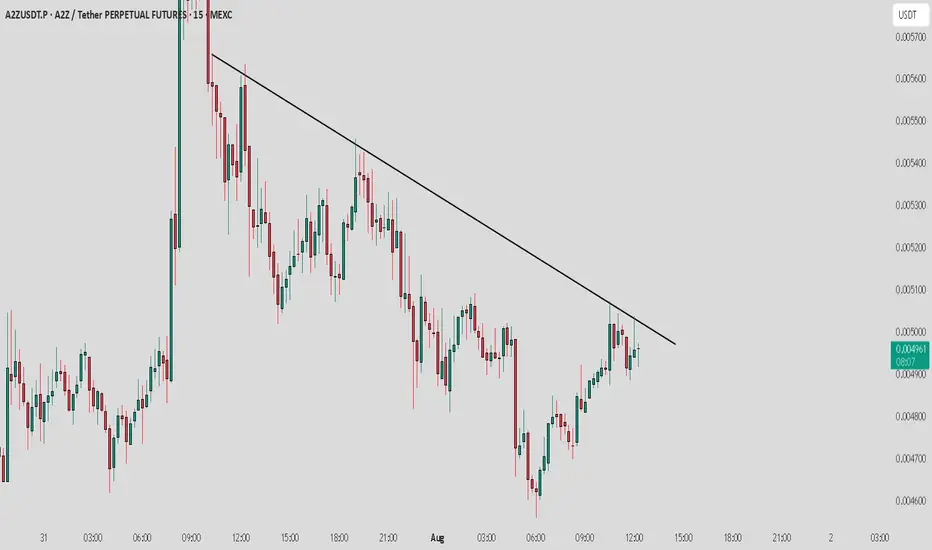
A2Z / USDT : Near trendline and showing weakness, Avoid long A2Z/USDT - Nearing Trendline Resistance
A2Z/USDT is approaching a crucial trendline resistance.
Bearish Scenario:
Failure to break the resistance could lead to further consolidation or a potential reversal, testing lower support levels.
Keep an eye on the trendline and volume for the next key move.
Gold is now buy position 40 to 50 pipsGold is now buy position 40 to 50 pips
If you wanted to learn about this analysis system fell free contrect with me .

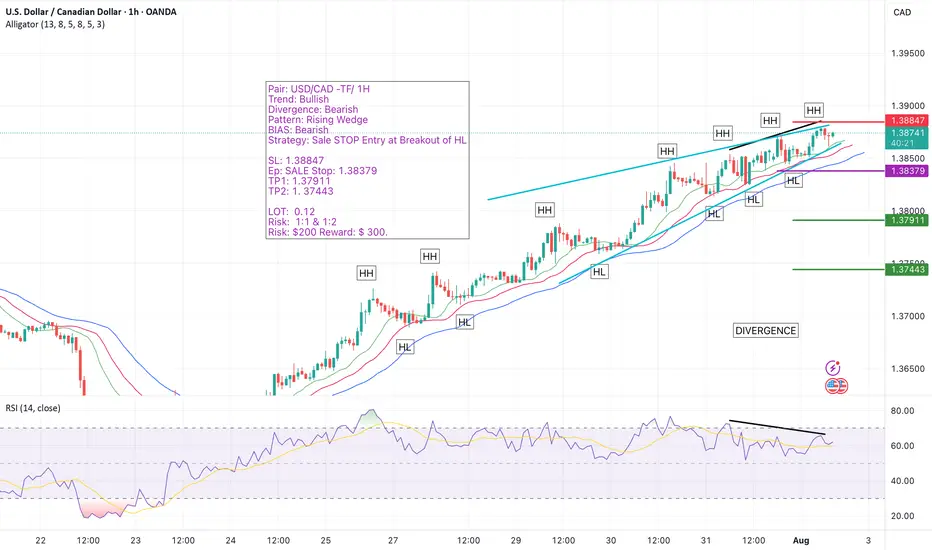
USD/CAD 1H Setup – Bearish Reversal Incoming? We’re closely watching the USD/CAD pair on the 1-hour timeframe, and the chart is flashing multiple high-probability reversal signals.
🔹 The trend has been bullish, but momentum is weakening.
🔹 A clear bearish divergence has formed on the oscillator.
🔹 A rising wedge — one of the most reliable reversal patterns — is fully developed and ready to break.
🔹 All signs point toward an imminent bearish shift, and we're preparing to catch the move early with a Sell Stop below the key Higher Low (HL).
📌 Trade Setup at a Glance:
Pair: USD/CAD
Timeframe: 1H
Trend: Bullish (for now)
Divergence: Bearish
Pattern: Rising Wedge
Bias: Bearish
Strategy: Sell Stop at HL Breakout
🟡 Entry: 1.38379 (Sell Stop)
🔴 Stop Loss: 1.38847
🟢 Take Profit 1: 1.37911 (R:R 1:1)
🟢 Take Profit 2: 1.37443 (R:R 1:2)
📊 Position Sizing & Risk Management
🔹 Lot Size: 0.25
🔹 Risk Per Trade: $200
🔹 Total Reward Target: Up to $300
🔹 Executing two trades – one targeting TP1, the second targeting TP2.
📈 Why This Setup Matters:
✅ Bearish divergence shows clear loss of bullish strength
✅ Rising wedge pattern aligns perfectly with reversal expectations
✅ Well-structured entry with favorable risk-to-reward
✅ Using a split-target strategy to lock in profits smartly
📣 Let’s Discuss!
💬 Drop your thoughts and analysis in the comments — how are you trading USD/CAD?
🔔 Follow me for more high-probability trade setups, chart breakdowns, and real-time analysis. Let’s trade smart and grow together! 🚀
#USDCAD #ForexSetup #RisingWedge #BearishDivergence #PriceActionTrading #SmartMoney #TrendReversal #FXSignals #SellSetup #TradingStrategy #ChartPatterns #BreakoutStrategy #TradeSmart #1HourChart #RiskReward #ForexTrade #TechnicalSetup #TradeIdeas #TradingCommunity #ForexEducation #TradersOfTradingView #SmartEntry #SwingTrading #TradingMindset #TradingViewSetup #ForexAnalysis
Bearish Sentiment For GoldGold breaks daily trendline leaving a bearish engulfing pattern last Wednesday July 30, Expecting the price go down for correction. In my opinion, Gold will be BEARISH this coming August up to October. This is just my theory.

USD/CHF: Swiss Rally Ignited?FX:USDCHF is setting up for a potential rally on the 4-hour chart, with an entry zone between 0.79878-0.80167 near a strong support. First take profit at 0.81485, with a second target at 0.81671 aligning with key resistance. Set a stop loss on a daily close below 0.796 to limit risk. A break above 0.802 with volume could spark this move. Monitor USD strength and CHF economic data. Trade smart!
Share your opinion with me in the comments.
#USDCHF #ForexTrading #TechnicalAnalysis #TradingView #CurrencyPairs #DayTrading #MarketSignals

DowJones ahead of US Employment dataKey Support and Resistance Levels
Resistance Level 1: 44390
Resistance Level 2: 44720
Resistance Level 3: 45100
Support Level 1: 43580
Support Level 2: 43360
Support Level 3: 43140
This communication is for informational purposes only and should not be viewed as any form of recommendation as to a particular course of action or as investment advice. It is not intended as an offer or solicitation for the purchase or sale of any financial instrument or as an official confirmation of any transaction. Opinions, estimates and assumptions expressed herein are made as of the date of this communication and are subject to change without notice. This communication has been prepared based upon information, including market prices, data and other information, believed to be reliable; however, Trade Nation does not warrant its completeness or accuracy. All market prices and market data contained in or attached to this communication are indicative and subject to change without notice.

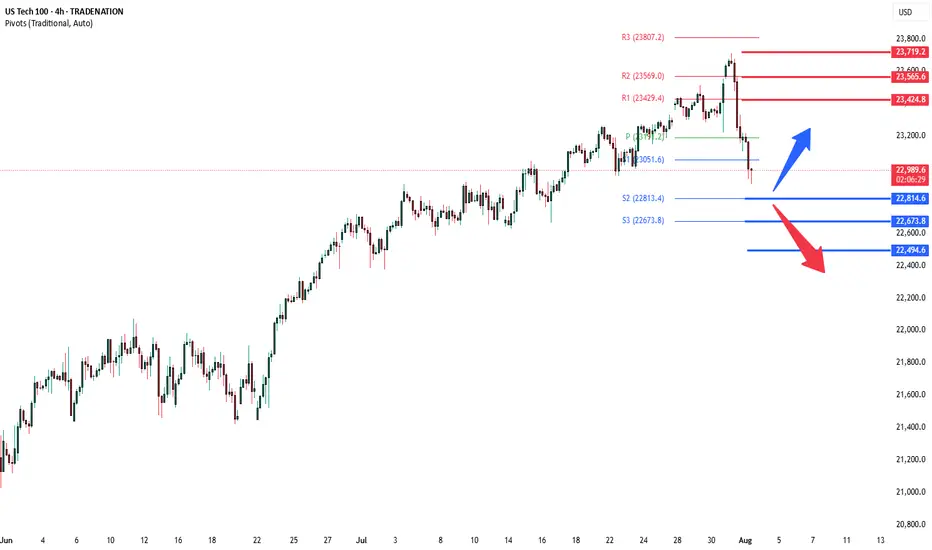
NSDQ100 ahead of US Employment data After the US close, Apple and Amazon posted mixed results:
Apple rose ~2% after-hours on a strong revenue beat ($94bn vs $89.3bn est.) and broad-based growth, especially in China — its first sales increase there in two years.
Amazon fell after projecting weaker Q3 operating profits ($15.5–$20.5bn vs $19.4bn est.) and showing slower cloud growth than competitors, raising concerns over its AI strategy.
These results pulled NASDAQ 100 futures down by -0.20%, as investors digested disappointing Amazon guidance despite Apple’s strength.
Additional Drivers:
US July Jobs Report due today may add volatility. Slower payroll growth (+75k est.) and a rise in the unemployment rate (to 4.2%) could support a dovish Fed narrative.
Trump’s Global Tariff Announcement added macro uncertainty, with sharp tariff hikes on countries with trade surpluses, including a 35% hit to Canada and 39% to Switzerland. This weighs on global trade sentiment.
Pharma Pressure: Trump is also targeting drugmakers on pricing. AstraZeneca hinted at unsustainability, suggesting regulatory risk may be rising for the sector.
Conclusion for NASDAQ 100 Trading:
The tech-heavy NASDAQ 100 faces near-term downside pressure, driven by Amazon’s weak outlook, broader macro headwinds from tariffs, and potential labor market softness. However, Apple's strong China rebound and stabilizing consumer trends (e.g., Target) offer some support. Expect choppy trade as markets await clarity from the jobs report and tariff policy impact.
Key Support and Resistance Levels
Resistance Level 1: 23424
Resistance Level 2: 23565
Resistance Level 3: 23720
Support Level 1: 22815
Support Level 2: 22673
Support Level 3: 22500
This communication is for informational purposes only and should not be viewed as any form of recommendation as to a particular course of action or as investment advice. It is not intended as an offer or solicitation for the purchase or sale of any financial instrument or as an official confirmation of any transaction. Opinions, estimates and assumptions expressed herein are made as of the date of this communication and are subject to change without notice. This communication has been prepared based upon information, including market prices, data and other information, believed to be reliable; however, Trade Nation does not warrant its completeness or accuracy. All market prices and market data contained in or attached to this communication are indicative and subject to change without notice.
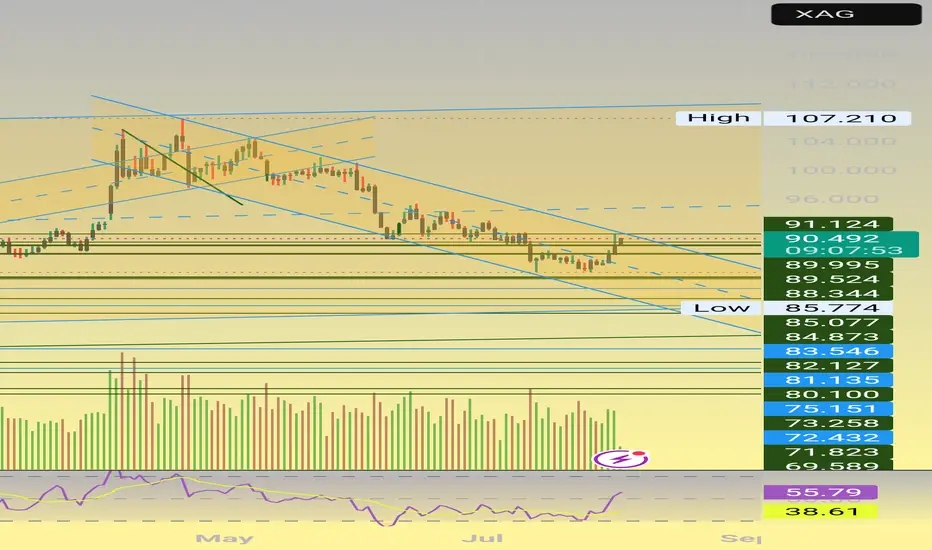
GOLD/SILVER RATIO TESTING CHANNEL BOUNDARYReasonable chance for ratio to turn lower here i.e. Silver to outperform Gold on a retracement. However, close to breaking the channel i.e. all collapses, Silver tanks.
LINKUSDT 12H#LINK has broken below the neckline of the double top pattern on the 12H timeframe.
📌 Place your buy orders near the key support levels:
$15.90 – $15.42
If the price reclaims the neckline and breaks above it, the potential upside targets are:
🎯 $18.96
🎯 $20.28
🎯 $21.54
⚠️ As always, use a tight stop-loss and apply proper risk management.

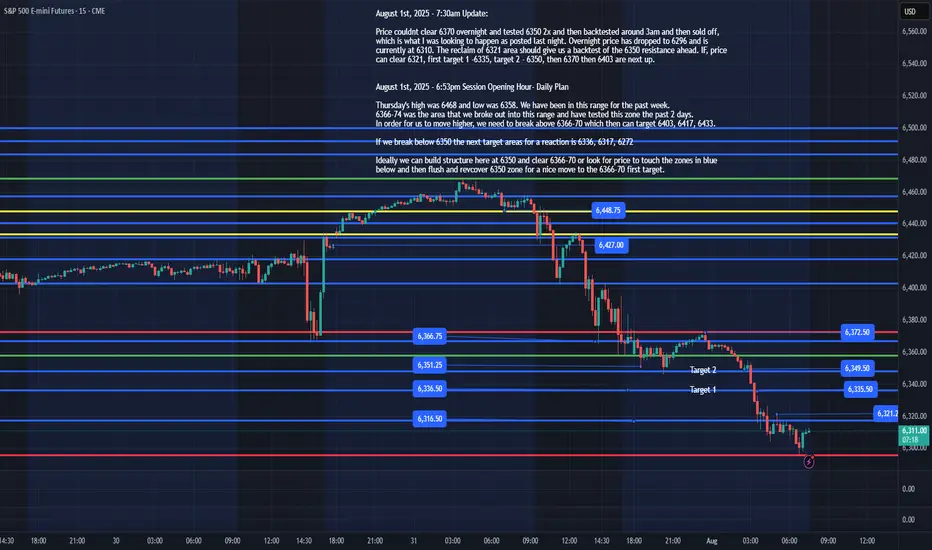
ES - August 1st Daily Plan Update - 7:35amAugust 1st, 2025 - 7:35am Update:
Price couldn't clear 6370 overnight and tested 6350 2x and then back tested around 3am and then sold off, which is what I was looking to happen as posted last night. Overnight price has dropped to 6296 and is currently at 6310. The reclaim of 6321 area should give us a back test of the 6350 resistances ahead. IF, price can clear 6321, first target 1 -6335, target 2 - 6350, then 6370 then 6403 are next up.
IF, we lose 6296, we would want to see a reclaim of it to enter a trade. IF, ES sells off today, better to get out the way and wait for price to reclaim 6296.
August 1st, 2025 - 6:53pm Session Opening Hour- Daily Plan
Thursday's high was 6468 and low was 6358. We have been in this range for the past week.
6366-74 was the area that we broke out into this range and have tested this zone the past 2 days.
In order for us to move higher, we need to break above 6366-70 which then can target 6403, 6417, 6433.
If we break below 6350 the next target areas for a reaction is 6336, 6317, 6272
Ideally, we can build structure here at 6350 and clear 6366-70 or look for price to touch the zones in blue below and then flush and recover 6350 zone for a nice move to the 6366-70 first target.
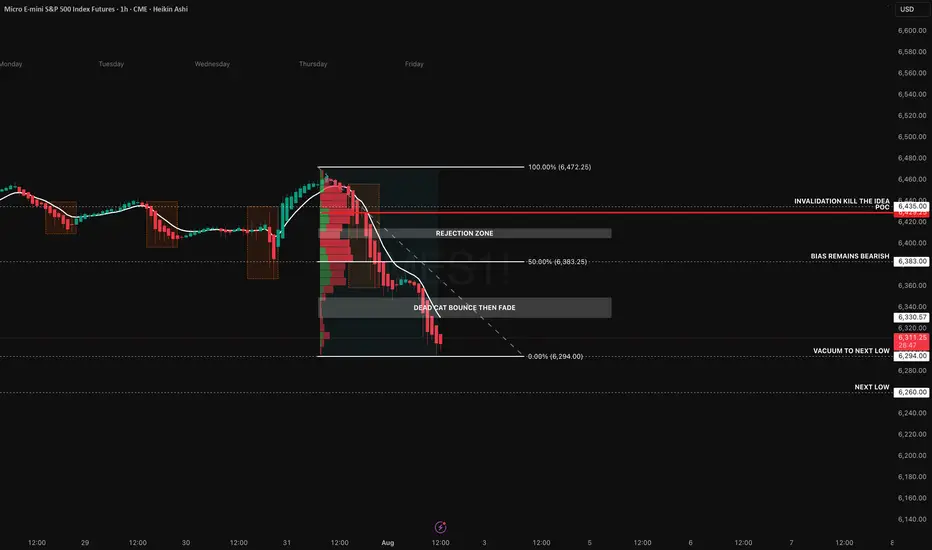
Structure Says Short… But Will News Flip the Script?Price continues to unwind following Thursday’s distribution, where we saw clear seller control above the 6420–6430 zone. Heikin Ashi candles show strong trend conviction with no upper wicks, and the EMA stack remains fully bearish. We're now pressing into the 0% Fibonacci extension at 6294, with the next low sitting around 6260 a clean vacuum zone that could fill quickly if the trend accelerates.
The volume profile from the breakdown range highlights 6429.25 as the point of control, acting as our primary rejection zone. Any pop into the 6383–6420 area will likely meet resistance. That’s our “dead cat bounce then fade” zone a textbook retracement rejection setup. Unless we reclaim 6435+ with conviction, the short bias remains intact.
We’re already short from 6306, targeting 6260. Stops are invalidated on a strong reclaim above the 6435 level.
However, today brings serious macro risk:
Trump has announced sweeping new tariffs on 92 countries, including 35% on Canada and 39% on Switzerland, triggering equity market anxiety. These surprise trade actions could cause intraday spikes or violent reversals, especially if retaliatory news drops intraday.
Amazon’s Q2 earnings missed cloud revenue expectations, putting pressure on tech futures.
U.S. Non farm Payrolls (NFP) are due at 8:30 AM ET, with expectations at +110K and unemployment ticking up to 4.2%. A strong jobs print could derail September rate cut hopes and add fuel to downside continuation or completely reverse sentiment.
We’re aware of this news risk and will adjust intraday. No stubborn bias here. But structurally, price is still in a trend, and this setup favours continuation unless macro flips the table.
My Setup Summary:
- Bias: Bearish (Trend Continuation)
- Entry: 6306 (Short)
- Target: 6260
- Invalidation: 6435 reclaim
- Confluence: POC rejection, Fib retrace, bearish EMAs, weak retrace structure
- News Risk: Tariffs, Amazon earnings miss, NFP at 8:30 AM ET
Good luck today and hope that we end the week profitable.
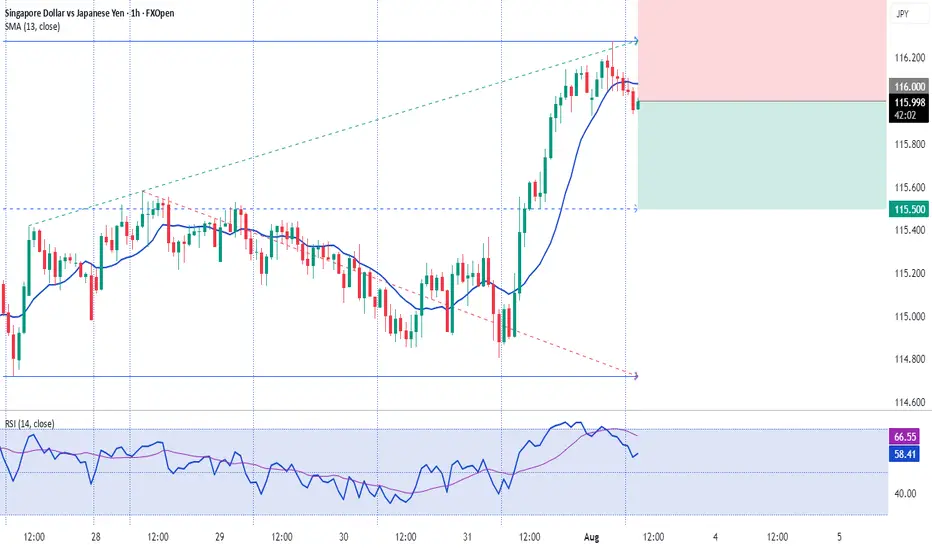
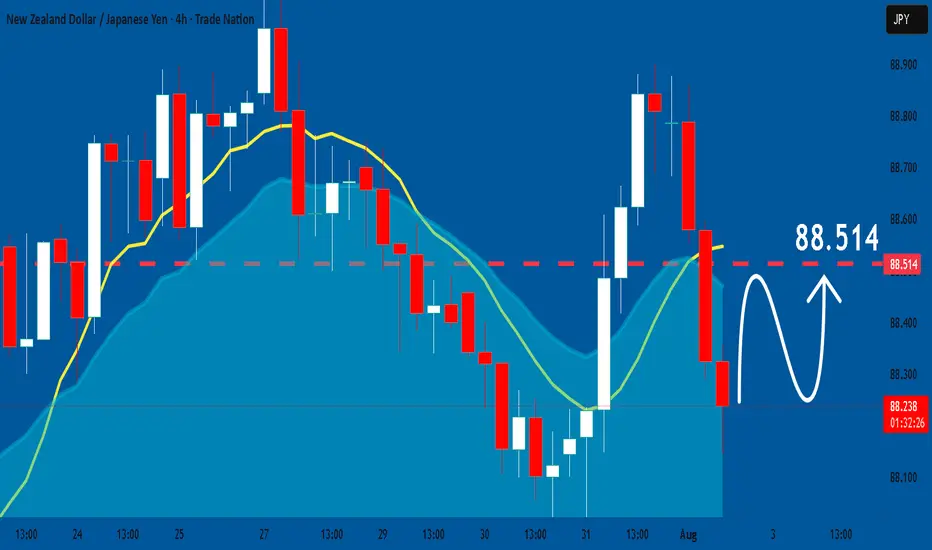
NZDJPY: Bullish Continuation
The recent price action on the NZDJPY pair was keeping me on the fence, however, my bias is slowly but surely changing into the bullish one and I think we will see the price go up.
Disclosure: I am part of Trade Nation's Influencer program and receive a monthly fee for using their TradingView charts in my analysis.
❤️ Please, support our work with like & comment! ❤️

BTC is likely to resist falling below $112000BTC is likely to resist falling below $112000
If the confluence between the yellow trendline and the top green horizontal support level dont hold strong, we are likely to see BTC retrace to $100K
Please trade with care.
My thoughts are shown on the chart technically
I hope to connect with you.
Please like, share, comment and follow me.

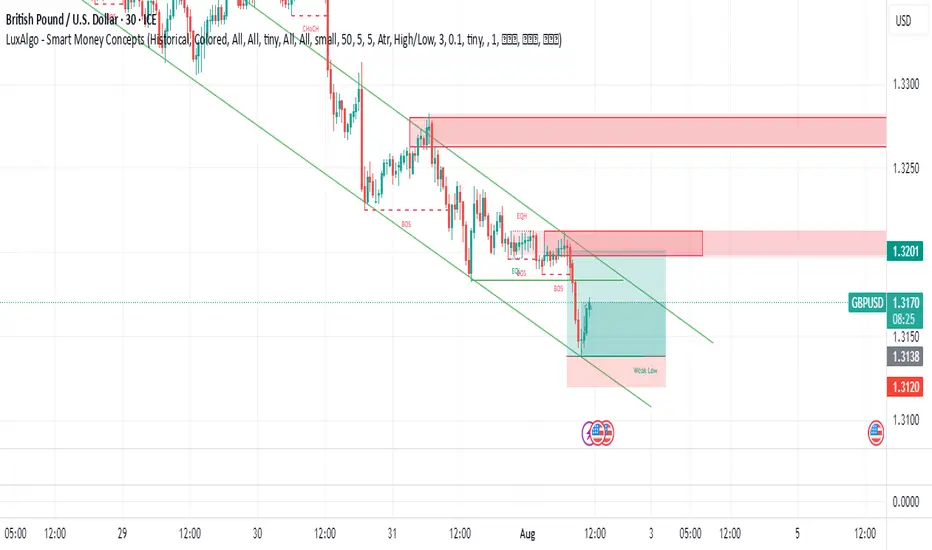
BIG MOVE UP FOR GBPUSDI was able to enter the trade at the lower low of the downtrend. The reason behind the entry is that the previous candlesticks respected the trend line. I was certain price would reject and retrace.
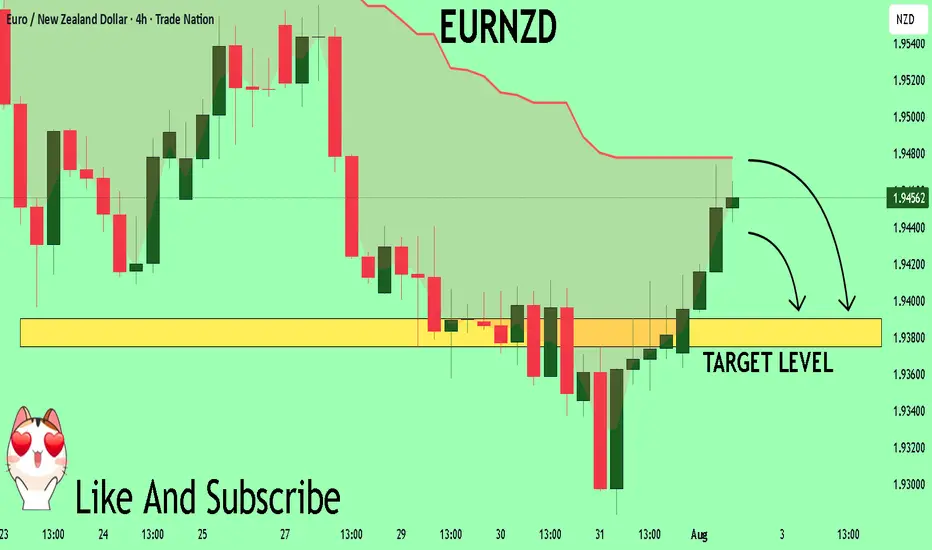
EURNZD Set To Fall! SELL!
My dear subscribers,
This is my opinion on the EURNZD next move:
The instrument tests an important psychological level 1.9459
Bias - Bearish
Technical Indicators: Supper Trend gives a precise Bearish signal, while Pivot Point HL predicts price changes and potential reversals in the market.
Target - 1.9390
About Used Indicators:
On the subsequent day, trading above the pivot point is thought to indicate ongoing bullish sentiment, while trading below the pivot point indicates bearish sentiment.
Disclosure: I am part of Trade Nation's Influencer program and receive a monthly fee for using their TradingView charts in my analysis.
———————————
WISH YOU ALL LUCK