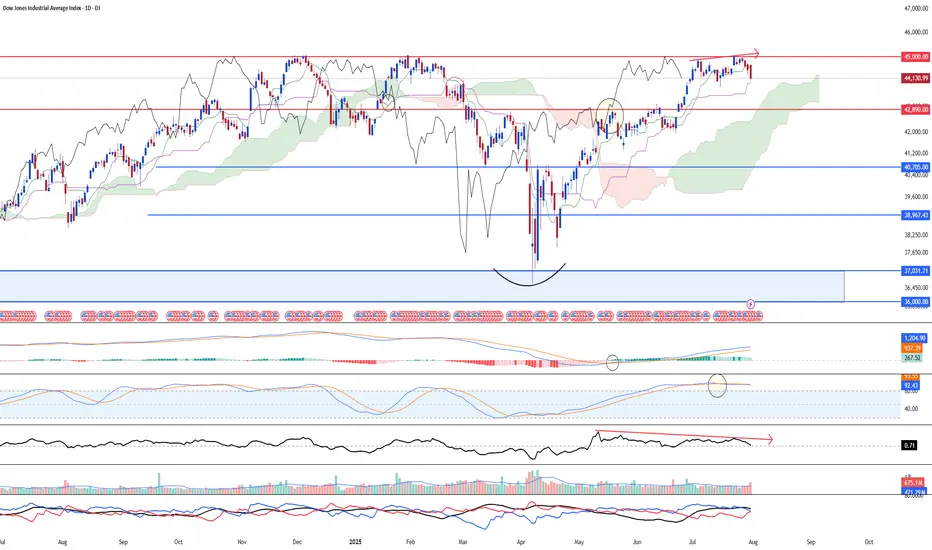
Correction ahead for DJIA, attributed to weak momentumDJ:DJI saw strong potential of a larger degree correction targeting 42,890 or lower support at 41,935. Reason being that there's a bearish divergence between the price chart and 23-period ROC. Furthermore, mid-term stochastic has shown bearish overbought signal. Another worthy price action signal showing weakness is that the index has fail to break above the high at 45,000 psychological level.
Despite the weak outlook, we are looking at a long-term upside targeting 46,200 (6 months and beyond)
Chart Patterns
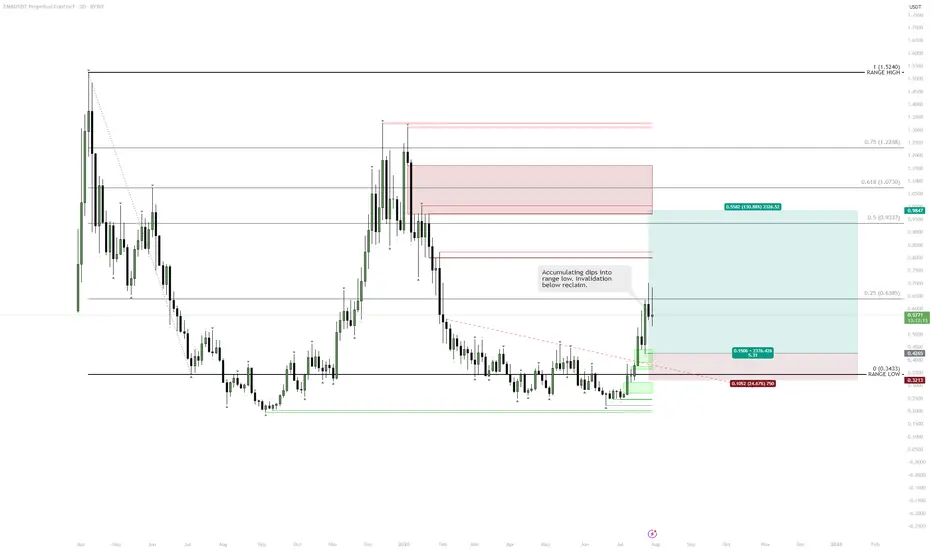
ENA | Range Low Reclaim — Targeting Midrange and AboveClear reclaim of the range low and a strong daily close confirm a bullish market structure shift.
Printing a higher high signals potential for continuation.
Dips toward the reclaimed range low are healthy, providing buy-the-dip opportunities.
Accumulation at the range low with invalidation below keeps risk tight.
Plan:
Accumulate pullbacks toward the range low.
Hold for midrange ($0.83) and upper range/major resistance.
DOLLAR INDEXDepartments Responsible for Each Economic Report
Indicator Responsible Department/Source
Average Hourly Earnings m/m U.S. Bureau of Labor Statistics (BLS), part of the Department of Labor
Non-Farm Employment Change BLS (Establishment Survey)
Unemployment Rate BLS (Household Survey)
Final Manufacturing PMI S&P Global/Markit (private company)
ISM Manufacturing PMI Institute for Supply Management (ISM, private sector)
ISM Manufacturing Prices Institute for Supply Management (ISM)
Revised University of Michigan (UoM) Consumer Sentiment University of Michigan (private/public university)
Construction Spending m/m U.S. Census Bureau, Department of Commerce
Revised UoM Inflation Expectations University of Michigan
How the Federal Reserve Interprets “Greater Than” or “Lower Than” Forecast
1. Average Hourly Earnings,
2.Non-Farm Payrolls,
3. Unemployment Rate
Higher than forecast (stronger labor market):
Tight labor markets (higher wages, more jobs, lower unemployment) suggest inflationary pressure.
The Fed may view this as a signal to keep rates higher for longer, as wage and job growth could fuel inflation.
Lower than forecast (weaker labor market):
Signals cooling in employment and wage growth, reducing upward pressure on inflation.
The Fed may see this as justification to consider easing policy or at least pausing further rate hikes.
2. Manufacturing PMIs (ISM, S&P)
Above 50: Signals expansion in manufacturing; below 50 indicates contraction.
Higher than forecast: Points to stronger economic momentum; the Fed may see upside risks to inflation.
Lower than forecast: Indicates weaker manufacturing activity; a possible sign of slowing demand, which could support rate cuts or dovish policy if persistent.
3. ISM Manufacturing Prices
Higher than forecast: Suggests inflationary pressures in manufacturing input costs; Fed interprets this as a reason for vigilance on inflation.
Lower than forecast: Implies easing input price pressures, supporting a dovish outlook if inflation remains subdued.
4. University of Michigan Consumer Sentiment & Inflation Expectations
Stronger than forecast sentiment: Consumers are more optimistic, often a sign of solid spending potential. May amplify inflation if this leads to greater demand.
Higher inflation expectations: If consumers expect higher future inflation, this can become self-fulfilling and the Fed may maintain tighter policy.
Weaker sentiment/lower inflation expectations: Reduces inflation risk, gives the Fed more flexibility to ease if needed.
5. Construction Spending
Higher than forecast: Indicates resilient investment and demand in the real economy.
Lower than forecast: Suggests cooling real estate and infrastructure spending; may support a dovish Fed outlook if sustained.
Summary Table
Data Surprises Interpretation for Fed Policy
Higher-than-forecast More hawkish; raises risk of persistent inflation
Lower-than-forecast More dovish; reduces pressure to hold rates higher
The Fed looks at the overall pattern across these data. Persistent upside surprises heighten concerns about inflation, supporting tighter policy. Downside surprises suggest cooling economic momentum and may encourage future rate cuts or pauses. The relative impact depends on which indicators surprise and the broader economic context.
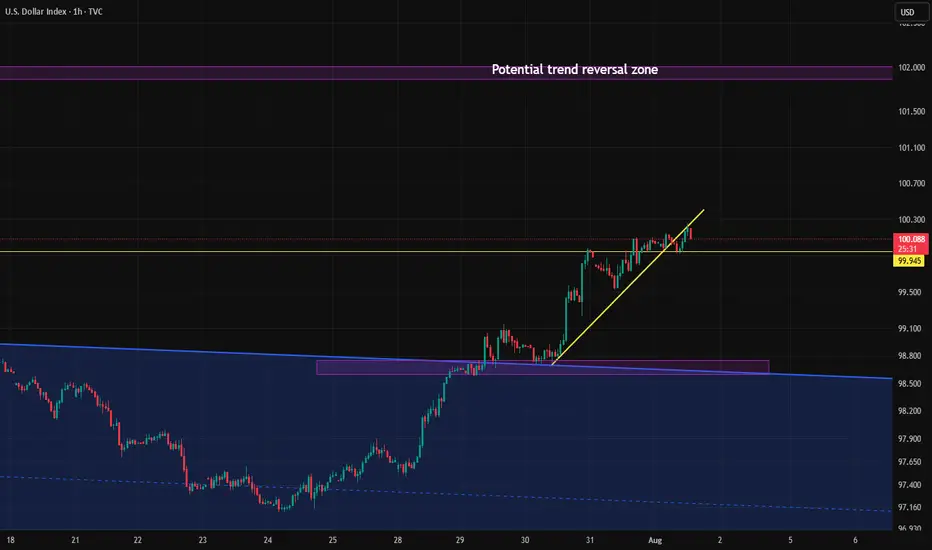
#DXY #DOLLAR

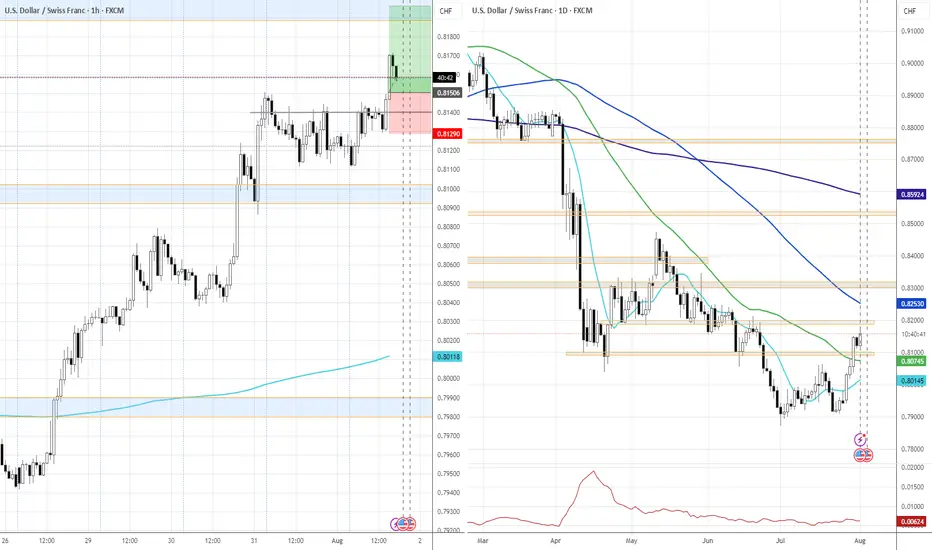
Candle close above 100 after 2 months.If the Dollar Index manages to close above the 100 level today, following the important news release, there's a chance the upward move could continue toward the key 101 zone next week.
However, unless it breaks above the 101 level with strong momentum, the overall trend in the higher timeframes still remains bearish.
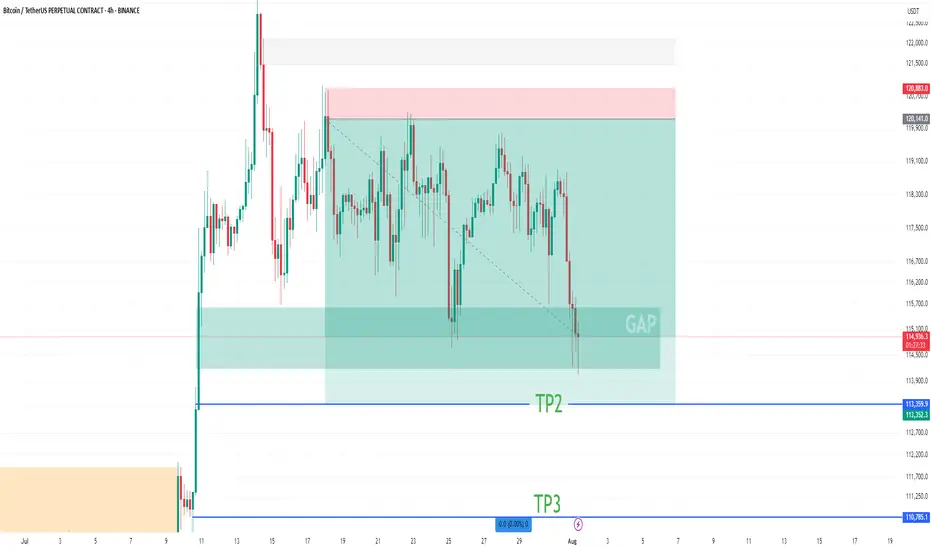
BTC Short Update Hello ❤️
Bitcoin
Let's have an update on Bitcoin analysis
💁♂️ First Target 🔥
Near Second Target
According to the analysis I posted on the page, Bitcoin touched the first target and is now near the second target
It is a good place to save profits. The price gap is filled
Please don't forget to like, share, and boost so that I can analyze it for you with more enthusiasm. Thank you. 💖😍
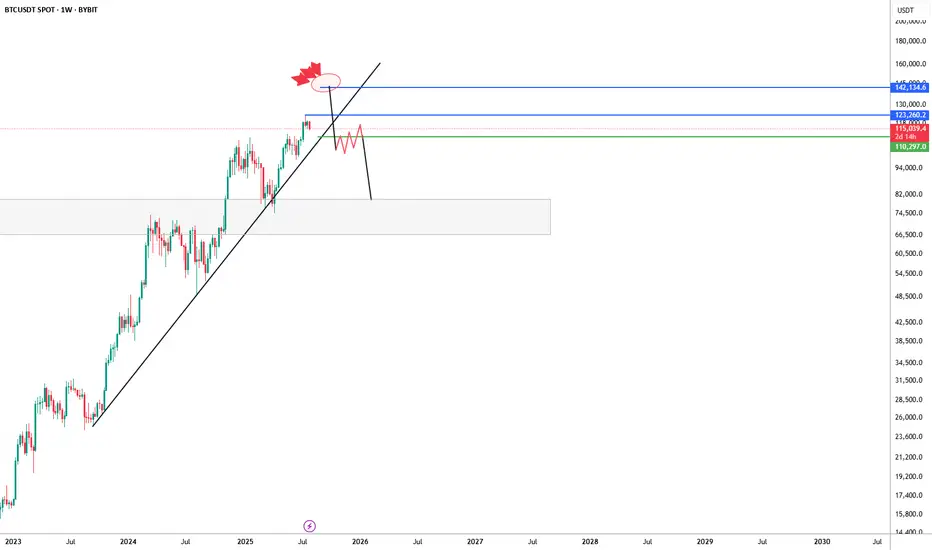
BTC/USDT Weekly – Bearish Rejection Brewing?Bitcoin has been riding a strong uptrend supported by a long-term ascending trendline, but recent price action is showing signs of exhaustion near the $123K–$142K supply zone.
The chart suggests a potential deviation above resistance, marked by a fakeout wick and aggressive rejection (highlighted with red blast icon). If price fails to reclaim and hold above $123K, the structure risks breaking down below trendline support — opening the door to a larger correction.
🔹 Key Resistance Zone: $123,260–$142,134
🔹 Critical Trendline Support: Recently broken — watch for retest/failure
🔹 Bearish Confirmation: Clean break & lower high formation under $109K
🔹 Next Major Demand Zone: $75K–$85K region
This setup leans bearish unless bulls can reclaim the upper blue range and re-establish control. If not, we could be looking at a significant macro retest of previous breakout levels.
#Bitcoin #BTC #BTCUSDT #CryptoChart #TrendReversal #BearishScenario
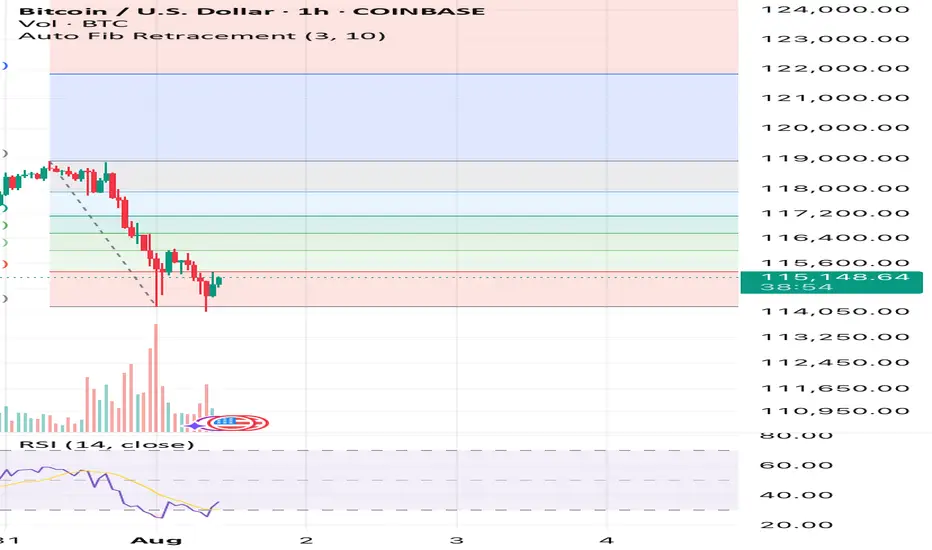
Bitcoin has an upside to it if we hold above $14,900See what you think it’s simple Auto Fib Retracement and RSI. That’s all I’m using here and also past times and other data outside of this image but inside the CRYPTOCAP:BTC market.
What you think? Up to $118k again before down or sideways? Or will this be the end of the large bull flag formation? We’ll soon find out!
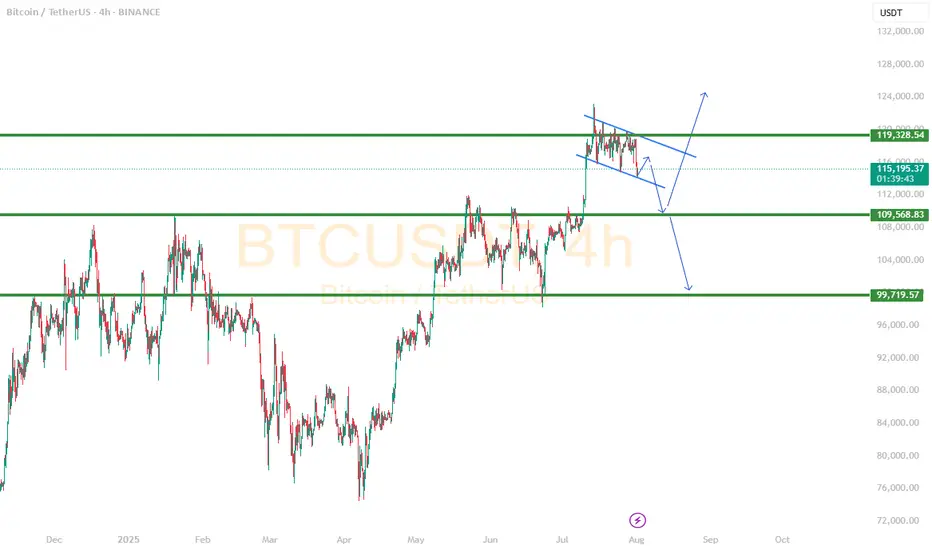
Two simple scenarios could playing out The buying pressure has been slightly less over the last week, I see a small improvement today but later this weekend, it is still likely to head downward towards the 110k area.
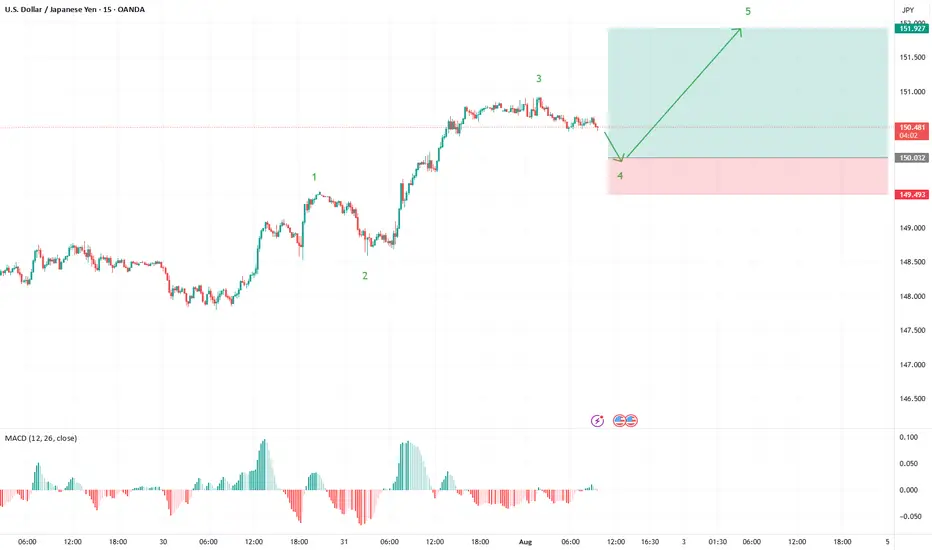
USD/JPY: Fifth Wave Target in SightUSD/JPY is painting a textbook five-wave impulse structure from the recent lows, and we're now positioned for what could be the final act of this motive sequence.
Current Wave Count
✅ Waves 1-3 Complete: Clean impulsive structure with wave 3 showing strong extension
✅ Wave 4 in Progress: Currently correcting from the 150.94 high
🎯 Wave 5 Setup: Targeting completion around 151.95 - 152.20
Key Levels to Watch
Support Zone: 150.00 area (ideal wave 4 retracement)
This aligns with wave principle fourth-wave correction parameters
Provides a healthy pullback without threatening wave 1 overlap
Target: 151.95 - 152.20 zone for wave 5 completion
Classic 5 vs 1+3 projection
Trade Strategy
Monitor for supportive price action near 150.00
Look for an impulsive price action to confirm wave 5 beginning
Structure suggests one more leg higher before a larger correction
The beauty of Elliott Wave: when the count is this clean, the roadmap becomes crystal clear. Let's see if USD/JPY delivers this final push to complete the sequence.
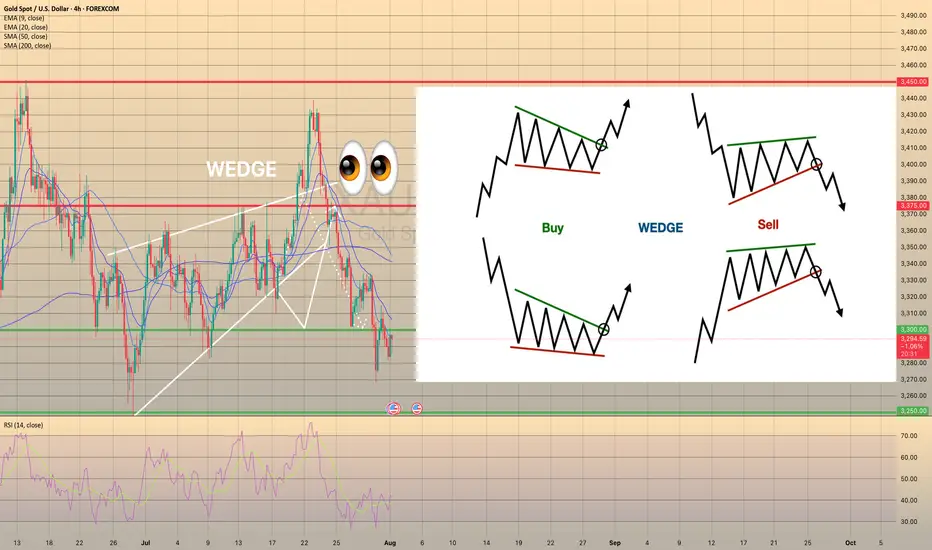
Wedge Pattern: A Key to Trend Reversals and Continuations📈 Wedge Pattern: A Key to Trend Reversals and Continuations
A wedge pattern is a technical chart formation that signals a potential reversal or continuation in the market. It’s formed when price moves between two converging trendlines — either sloping upward or downward — creating a narrowing range over time.
There are two main types of wedge patterns:
🔻 Falling Wedge (Bullish)
Formed during a downtrend or as a correction in an uptrend.
Characterized by lower highs and lower lows, with the slope of the support line steeper than the resistance line.
Typically signals a bullish reversal as momentum builds for a breakout to the upside.
✅ Confirmation: Break above the resistance line with volume surge.
🔺 Rising Wedge (Bearish)
Appears during an uptrend or as a correction in a downtrend.
Shows higher highs and higher lows, but the support line is steeper than the resistance line.
Often leads to a bearish reversal, especially when volume declines into the pattern.
⚠️ Confirmation: Break below the support line with increasing volume.
🧠 Key Characteristics
Volume tends to decrease as the pattern forms, indicating a pause in momentum.
The breakout direction (up or down) determines whether it’s a continuation or reversal signal.
Wedges can appear on any time frame and are useful for both day traders and long-term investors.
📊 Trading Tip
Always wait for confirmation of the breakout before entering a trade. False breakouts can be common, especially in low-volume environments
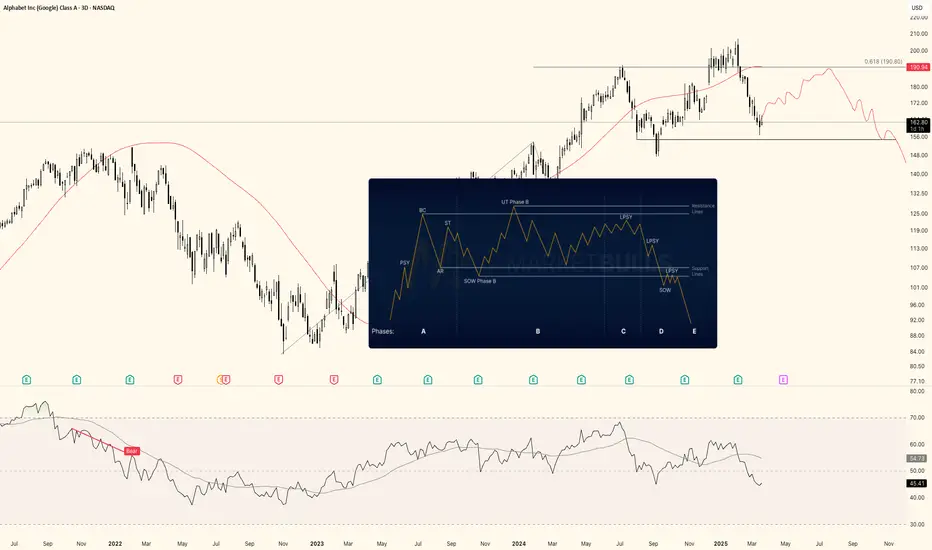
Google in a distributive phase?Could be printing a distribution here. Early signs, so very early on this idea. Would need to see PA evolve like showed in the graph. Alternatively if it makes a HH, it could be printing a UTAD. Either way, I'll be looking for signs whether Wyckoff Distribution does indeed play out.
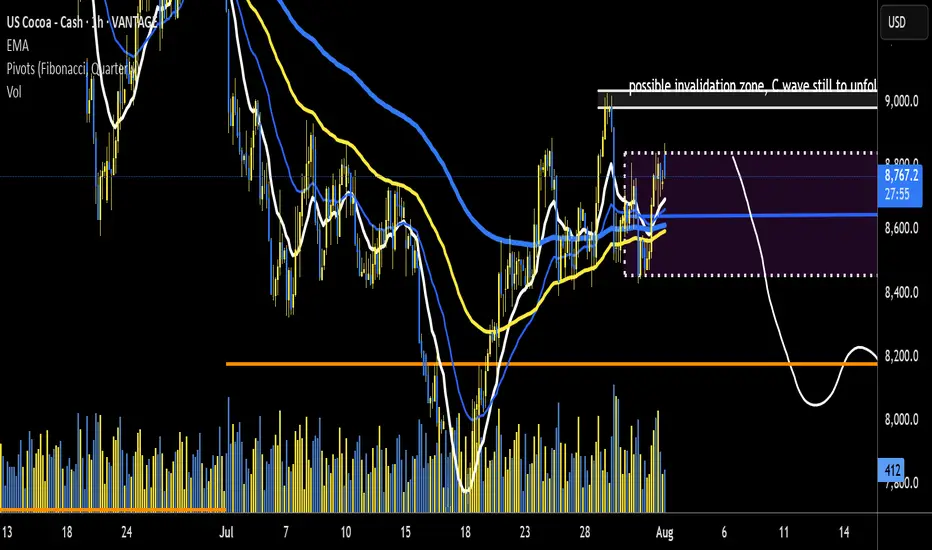
US Coco potential leg downRoad map laid. impulsive wave down - looking for entry signal and SL zone 15 and 5 min chart. a break of recent highs a good zone for SL a break above SL ZONE is possibly C in ABC structure unfolding. could imply even higher on cards. current risk ratio of min 1:5 ROI.
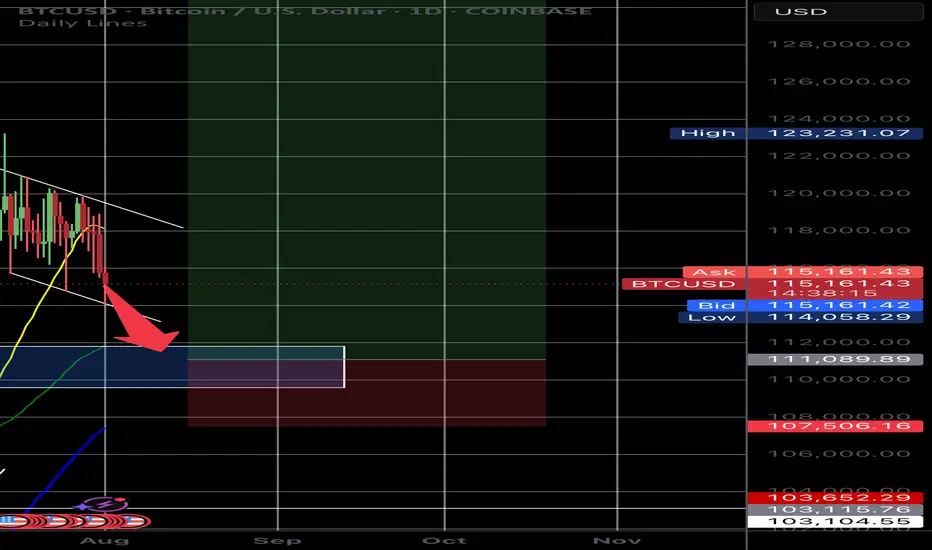
Liquidity sweep to $111,000 then bounce to new ATHBTC must see a liquidity sweep down to the previous resistance level of around $111k wiping out the over leveraged longs before a push to new highs. We are seeing this slowly unfolding now where a push down to $114k has just happened. Soon a momentary push down to $111k hitting old resistance levels and the currently 50 day moving average will occur with a quick bounce back to $114-$115k.
THIS IS WHEN WE WILL SEE NEW ATH’s🚀🚀
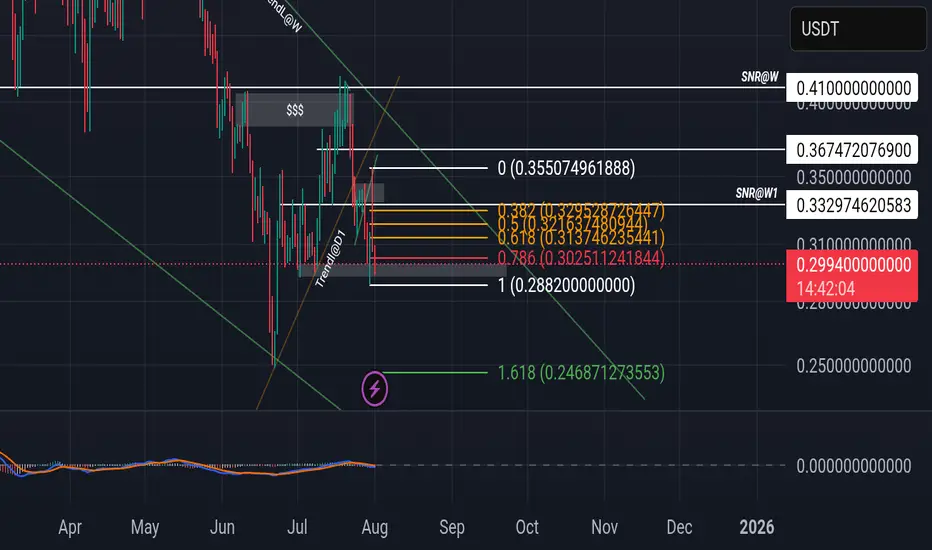
Sonic is creating wedge pattern in higher timeframeOn our current market structure, sonic is creating wedge bullish pattern.
If you check the current price using Fibonacci there's a possibility that it will goes to 0.24 or worst 0.1552 before it will break its current weekly structure.
You can accumulate within the pattern but if you're planning to make position and do long...please avoid that.
Point of interest is 0.24 to make create double bottom on it. If it's break, 0.1552.
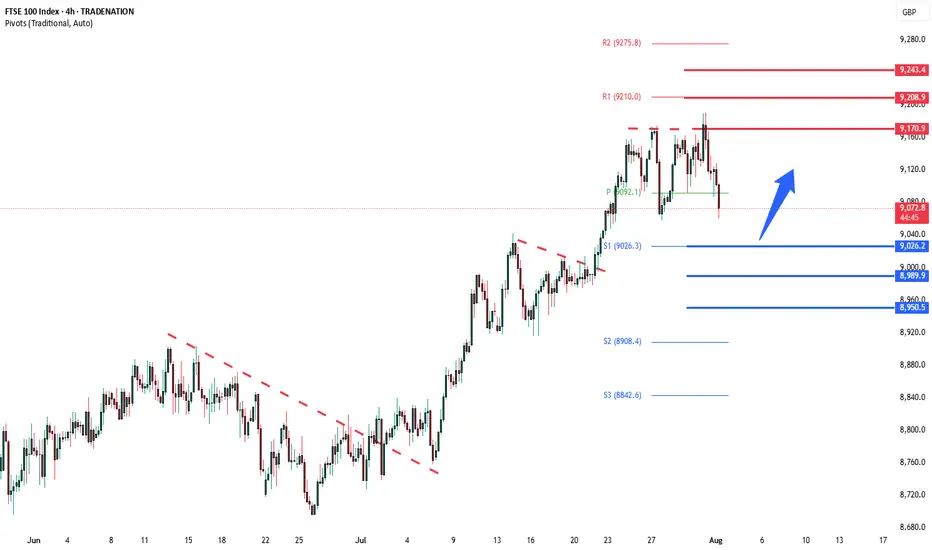
FTSE deeper corrective pullback supported at 9026The FTSE remains in a bullish trend, with recent price action showing signs of a corrective pullback within the broader uptrend.
Support Zone: 9026 – a key level from previous consolidation. Price is currently testing or approaching this level.
A bullish rebound from 9026 would confirm ongoing upside momentum, with potential targets at:
9170 – initial resistance
9208 – psychological and structural level
9245 – extended resistance on the longer-term chart
Bearish Scenario:
A confirmed break and daily close below 9026 would weaken the bullish outlook and suggest deeper downside risk toward:
8990 – minor support
8950 – stronger support and potential demand zone
Outlook:
Bullish bias remains intact while the FTSE holds above 9026. A sustained break below this level could shift momentum to the downside in the short term.
This communication is for informational purposes only and should not be viewed as any form of recommendation as to a particular course of action or as investment advice. It is not intended as an offer or solicitation for the purchase or sale of any financial instrument or as an official confirmation of any transaction. Opinions, estimates and assumptions expressed herein are made as of the date of this communication and are subject to change without notice. This communication has been prepared based upon information, including market prices, data and other information, believed to be reliable; however, Trade Nation does not warrant its completeness or accuracy. All market prices and market data contained in or attached to this communication are indicative and subject to change without notice.
The Day AheadWeekly Summary – Key Data & Earnings (Week Ending August 2, 2025):
Economic Data:
US Jobs Report: Job growth slowed slightly; unemployment ticked up. Supports Fed holding rates steady.
US Manufacturing (ISM): Sector still shrinking, showing weakness.
US Car Sales & Construction: Car sales rose; construction spending up, led by infrastructure.
China Manufacturing: Still contracting due to weak demand.
Japan Jobs Data: Job market remains tight and stable.
Italy: Manufacturing down, car sales slightly up, budget and retail sales steady.
Eurozone Inflation: Inflation slowed, increasing chances of ECB rate cuts.
Canada Manufacturing: Slipped into contraction.
Earnings Highlights:
Exxon & Chevron: Mixed—refining strong, but oil prices hurt results.
Linde: Solid growth from healthcare and clean energy demand.
Nintendo: Strong game and digital sales boosted profits.
AXA: Insurance strong, but investment income dipped.
Regeneron: Beat forecasts, thanks to strong drug sales.
Ares: Private credit demand lifted earnings.
Engie: Renewables helped balance weaker thermal output.
Daimler Truck: Demand steady, but profit margins hit by costs.
LyondellBasell: Missed targets due to weak chemicals demand.
Moderna: COVID sales down; focus now on future drug pipeline.
Takeaway:
The global economy is slowing, but US jobs and spending remain resilient. Companies reported mixed earnings. Central banks are likely to stay cautious, with possible rate cuts ahead if weakness continues.
This communication is for informational purposes only and should not be viewed as any form of recommendation as to a particular course of action or as investment advice. It is not intended as an offer or solicitation for the purchase or sale of any financial instrument or as an official confirmation of any transaction. Opinions, estimates and assumptions expressed herein are made as of the date of this communication and are subject to change without notice. This communication has been prepared based upon information, including market prices, data and other information, believed to be reliable; however, Trade Nation does not warrant its completeness or accuracy. All market prices and market data contained in or attached to this communication are indicative and subject to change without notice.
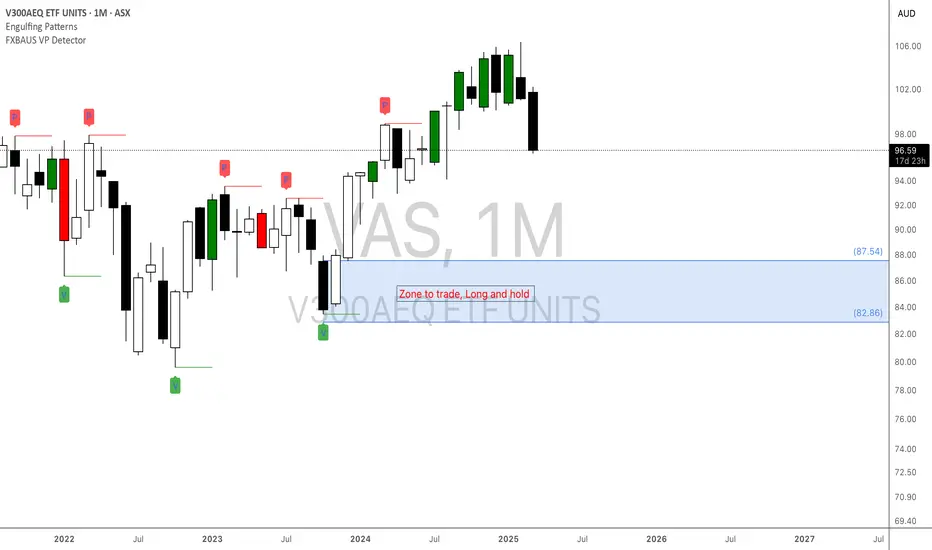
Vanguard Australian Shares Index ETF (VAS) Vanguard Australian Shares Index ETF (VAS)
EFT Info :
Vanguard Australian Shares Index ETF (VAS) is an investment fund traded on the Australian stock exchange that allows investors to buy shares in approximately 300 of Australia's largest companies with a single purchase.
Chart Analysis
The Monthly zone is promising, entry is at 87.54 however thats the lowest timeframe i could use here.
Conc:
1.As this is monthly timeframe movement is in months and hence the long wait.
2. The zone is risky and would require a confirmation kind of trade to get into
Prop:
The Vanguard is well established and an entry would not require a target as its a wait and hold
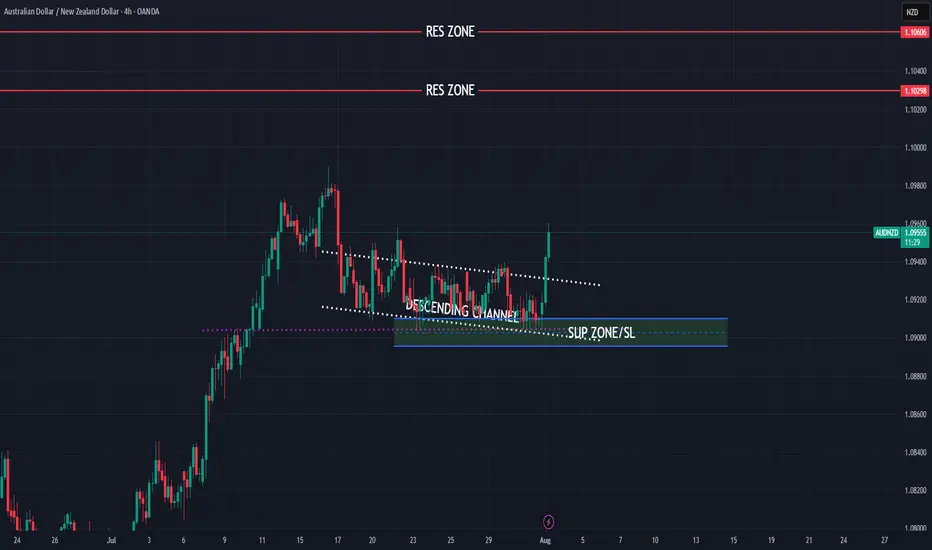
AUDNZD still bullish trend expecting
OANDA:AUDNZD last five analysis accurate (attached), here is new view on AUDNZD, still bullish expecting, price is not break strong zone, bouncing - pushing strongly from same, looks like DESCENDING CHANNEL is breaked.
Here still bullish expectations having.
SUP zone: 1.09100
RES zone: 1.10300, 1.10600
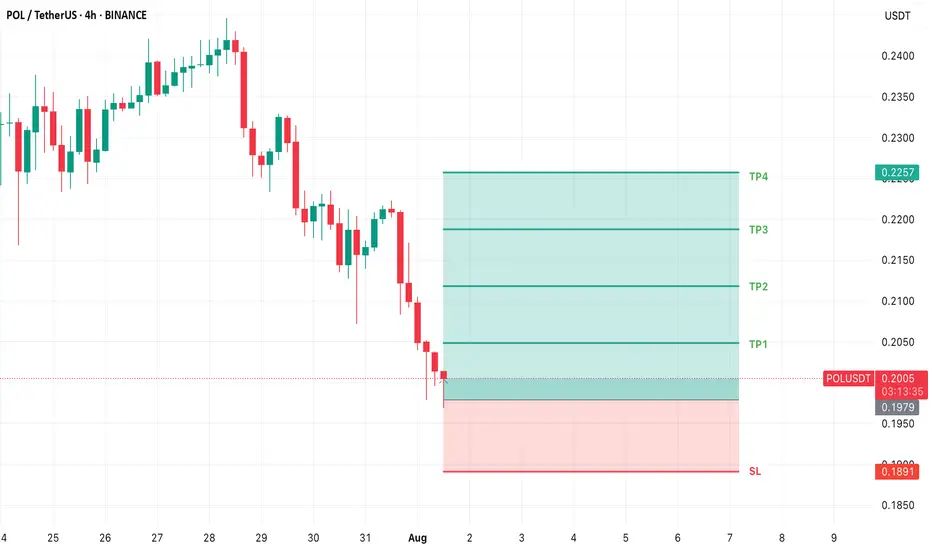
POL USDT LONG TRADE SETUPNew Trade Setup: POL-USDT
LONG
Entry: 0.1979 OR CMP
Target: TP1: 0.2049, TP2: 0.2118, TP3: 0.2188, TP4: 0.2257
Stoploss: 0.1891
Leverage: 1X
Technical Analysis: POL/USDT has been facing strong resistance, and a price reversal may occur soon in the short term.
Smart Liquidity in TradingIntroduction: What Is Smart Liquidity in Trading?
Liquidity is the backbone of financial markets—it refers to how easily assets can be bought or sold without causing drastic price changes. But as markets have evolved with the rise of algorithmic trading, decentralized finance (DeFi), and AI, a more sophisticated concept has emerged: Smart Liquidity.
Smart Liquidity isn’t just about having buyers and sellers in a market. It’s about efficient, dynamic, and intelligent liquidity—where technology, data, and algorithms converge to improve how trades are executed, how markets function, and how risks are managed. Whether in traditional stock markets, forex, or blockchain-based platforms, smart liquidity is now central to modern trading strategies.
Chapter 1: Understanding Traditional Liquidity
Before diving into smart liquidity, let's revisit the basics of traditional liquidity:
Bid-Ask Spread: A narrow spread indicates high liquidity; a wide one shows low liquidity.
Market Depth: The volume of orders at different price levels.
Turnover Volume: How frequently assets are traded.
Price Impact: How much a large order moves the price.
In traditional finance, liquidity providers (LPs) include:
Market makers
Banks and financial institutions
High-frequency trading firms
Exchanges
Liquidity ensures:
Stable pricing
Smooth trade execution
Lower transaction costs
Chapter 2: The Evolution Toward Smart Liquidity
What Changed?
Algorithmic Trading: Algorithms can detect, provide, or withdraw liquidity in milliseconds.
Decentralized Finance (DeFi): Smart contracts offer on-chain liquidity pools without intermediaries.
AI & Machine Learning: Predictive models can identify where liquidity is needed or likely to shift.
Smart Order Routing (SOR): Optimizes trade execution by splitting orders across multiple venues.
These technologies gave rise to “smart liquidity,” where liquidity is not static but adaptive, context-aware, and real-time optimized.
Chapter 3: Components of Smart Liquidity
1. Liquidity Intelligence
Advanced analytics track:
Market depth across exchanges
Order flow trends
Latency and slippage statistics
Arbitrage opportunities
This helps institutions dynamically manage their liquidity strategies.
2. Smart Order Routing (SOR)
SOR systems:
Automatically split large orders across venues
Route based on fees, liquidity, latency, and execution quality
Reduce market impact and slippage
SOR is key in both equity and crypto markets.
3. Algorithmic Liquidity Providers
Market-making bots adjust quotes in real-time based on:
Volatility
News sentiment
Volume spikes
Risk exposure
They enhance liquidity without manual intervention.
4. Automated Market Makers (AMMs)
Used in DeFi:
No traditional order book
Prices determined algorithmically via a liquidity pool
Traders interact with pools, not people
Popular AMMs: Uniswap, Curve, Balancer.
Chapter 4: Use Cases of Smart Liquidity
1. HFT Firms and Institutions
Use predictive liquidity models
Deploy SOR to reduce costs and slippage
Balance exposure across markets
2. Retail Traders
Benefit from tighter spreads and faster execution
Use platforms with AI-driven order matching
3. Decentralized Finance (DeFi)
Anyone can provide liquidity and earn fees
Smart liquidity enables 24/7 trading with no intermediaries
New protocols optimize capital allocation via auto-rebalancing
4. Stablecoin & Forex Markets
Smart liquidity ensures 1:1 peg stability
Algorithms prevent arbitrage imbalances
Chapter 5: Key Metrics to Measure Smart Liquidity
Metric Description
Slippage Difference between expected and actual execution price
Spread Efficiency How close bid-ask spreads are to theoretical minimum
Fill Rate How much of an order is filled without delay or rerouting
Market Impact Price movement caused by a trade
Liquidity Utilization How efficiently capital is allocated across pairs/assets
Latency Time taken from order input to execution
These metrics help evaluate the quality of liquidity provided.
Chapter 6: Risks and Challenges of Smart Liquidity
Despite its benefits, smart liquidity isn’t perfect.
1. Flash Crashes
Caused by sudden withdrawal of liquidity bots
Example: 2010 Flash Crash in U.S. equities
2. Manipulation Risks
Predatory algorithms can spoof or bait other traders
"Liquidity mirages" trick algorithms
3. Smart Contract Failures (DeFi)
Vulnerabilities in AMMs can drain entire liquidity pools
Hacks like those on Curve and Poly Network show smart liquidity can be fragile
4. Impermanent Loss (DeFi)
LPs may lose value if asset prices diverge significantly
Complex math and simulations needed to manage it
5. Regulatory Uncertainty
Especially in crypto, regulators still debating on decentralized liquidity protocols
Conclusion
Smart liquidity represents the next evolution of market infrastructure. It's not just about having capital in the market—it's about how that capital moves, adapts, and executes.
From hedge funds deploying intelligent routing systems to DeFi users earning yields through AMMs, smart liquidity touches every corner of modern finance. As technology continues to mature, expect liquidity to become even more predictive, responsive, and intelligent—unlocking a new level of speed, precision, and access for traders around the world.
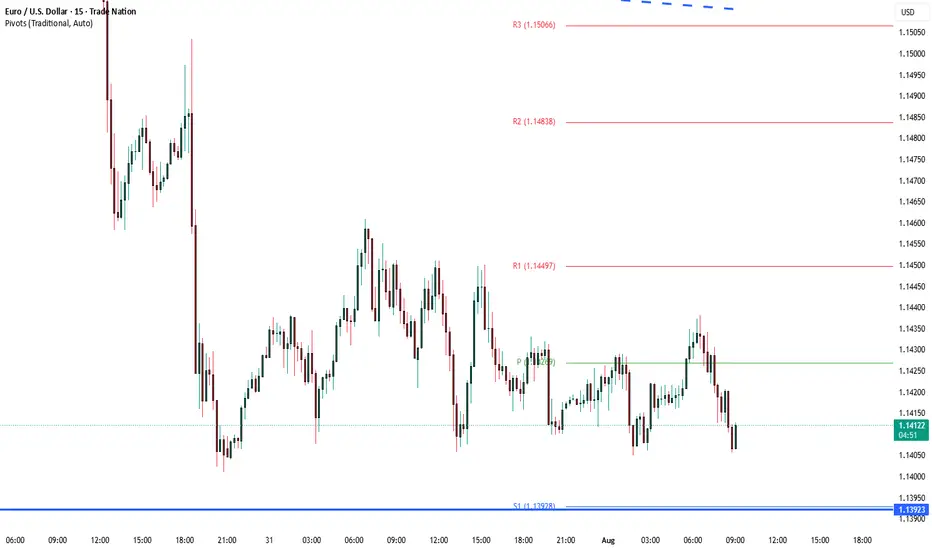
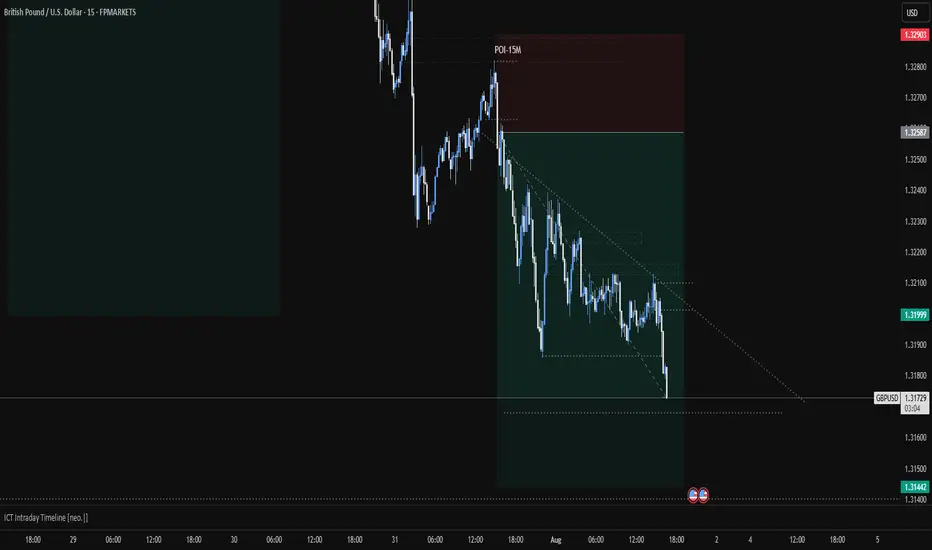
GBPUSDAs the USD continues to rise, the GBP is expected to drop further, possibly reaching the previous support at 1.31448.
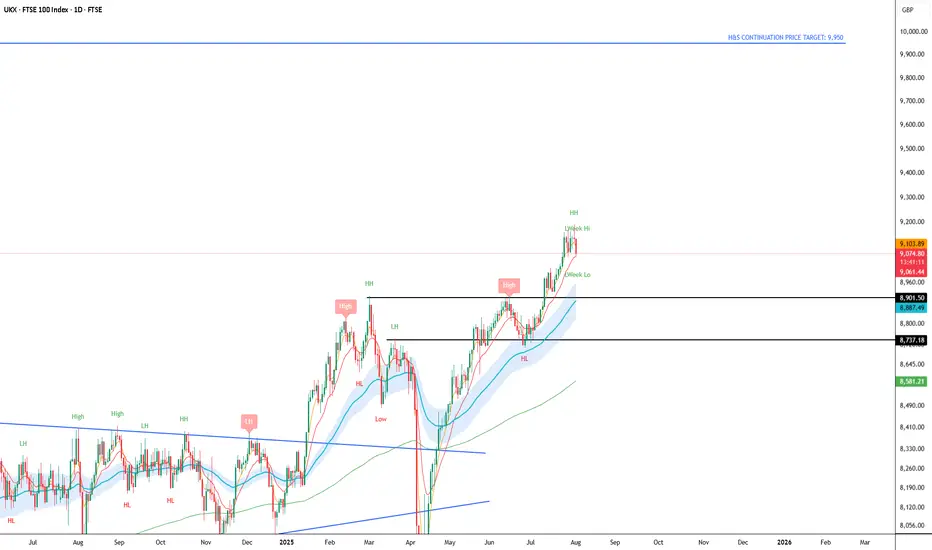
UKX Trending UpUKX bullish continuation.
It could pull back to 8900 and continue with the Head and Sholder pattern on the weekly time scale with a price target of 9975.
Pattern and breakout confirmed.