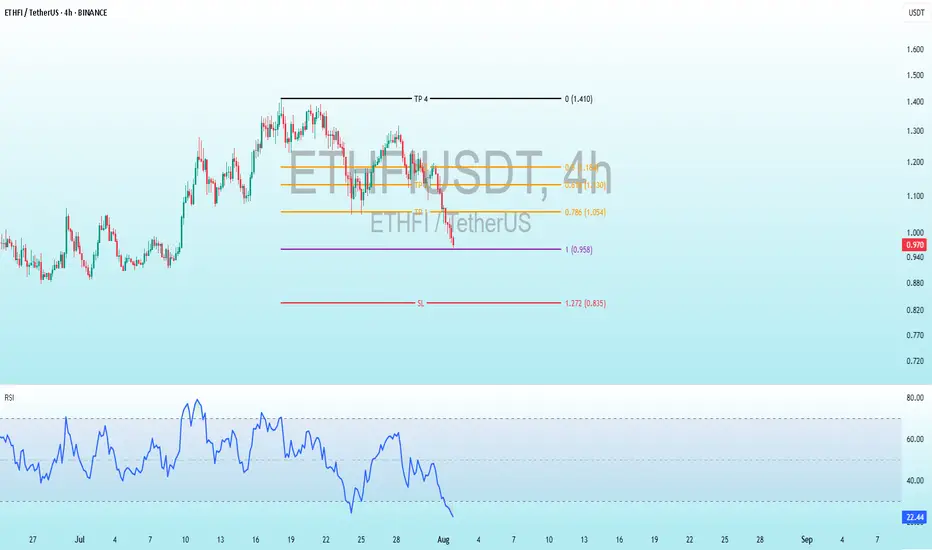
ETHFI Bullish DivergenceBINANCE:ETHFIUSDT
Trade Setup:
Target 1: 1.054 (0.786 Fibonnaci Golden Zone).
Target 2: 1.130 (0.618 Fibonnaci Golden Zone).
Target 3: 1.184 (0.786 Fibonnaci Golden Zone).
Target 4: 1.410 (0 Fibonnaci).
Stop Loss: 0.835 (1.272 Fibonnaci).
RSI Analysis: The RSI is showing a bullish divergence, suggesting potential bullish momentum. The current RSI is around 22.36, approaching oversold territory, so caution is advised.
Chart Patterns
Bitcoin longBitcoin retracement at 113.000 - 114.000 range, testing the support, 1H timeframe.
Liquidating positions on the level. Then long after testing the support.

#DATA (SPOT) BINANCE:DATAUSDT
#DATA/ USDT
Entry range (0.01500- 0.01600)
SL 4H close below 0.00.01498
T1 0.0180
T1 0.0198
_______________________________________________________
Golden Advices.
********************
* collect the coin slowly in the entry range.
* Please calculate your losses before the entry.
* Do not enter any trade you find it not suitable for you.
* No FOMO - No Rush , it is a long journey.

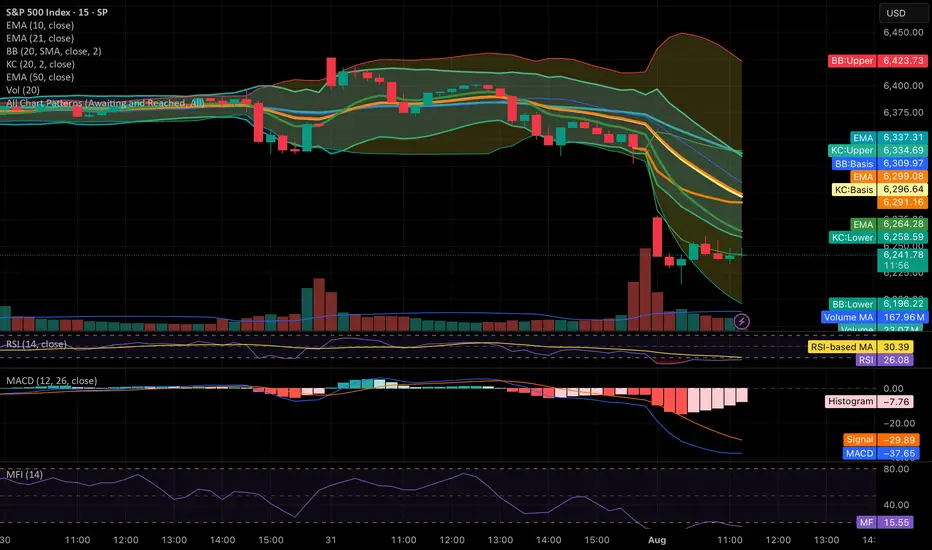
Price breakout below Keltner bandThe price has shown a breakout after the squeeze below the keltner band and may signal a more bullish trend.
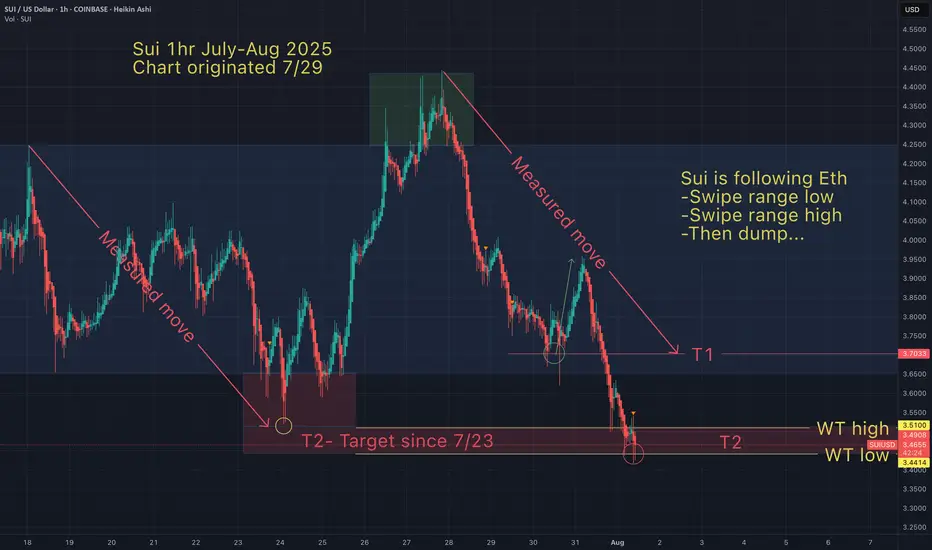
Sui - Target 2 just hit (alternate view)I love it when a plan comes together.
I hope my T3 doesn't hit (after this next bounce).
May the trends be with you.
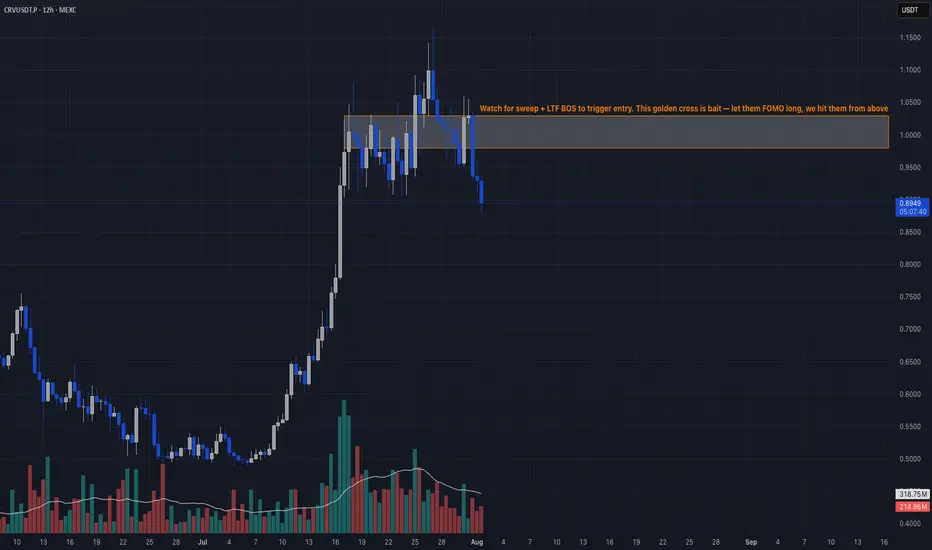
Retail Trap at Resistance📣 Team, get this…
CRV printed 5 green candles, triggered a golden cross, and suddenly every YouTube thumbnail said “TO THE MOON.” 🌝 That’s exactly the kind of retail trap we love to fade. This ain’t DeFi summer, it’s just overheated spaghetti. 🍝
🔥 TRADE SETUP
Bias: Short
Strategy: Retail Trap at Resistance
Entry: $0.98 – $1.03
SL: $1.10
TPs: $0.78, $0.65, $0.50
Why?
– RSI 83 + MACD maxed out = overcooked
– LTF CHoCH after sweeping $1.03
– Positive funding across exchanges → ripe for short squeeze reversal
– Retail buying golden cross = premium exit liquidity
Candle Craft | Signal. Structure. Execution.
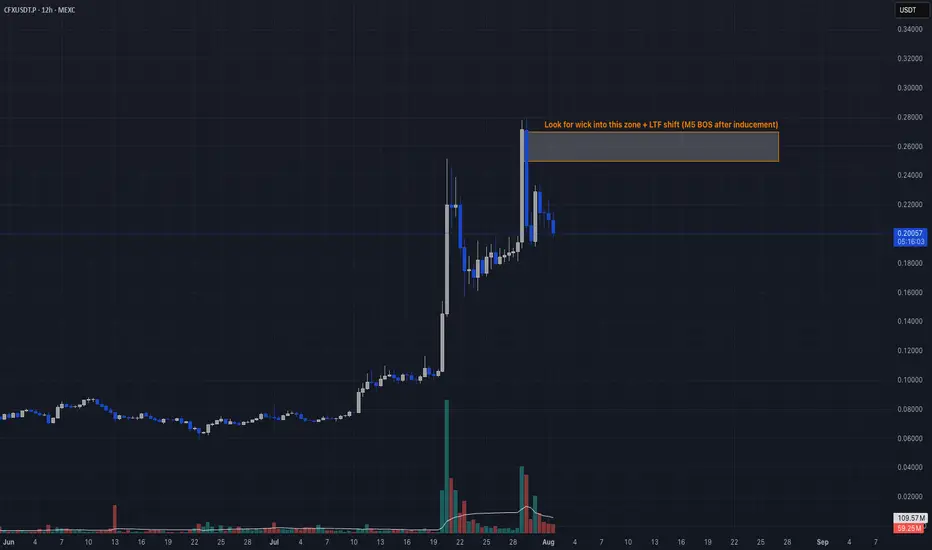
Sell-the-News Reversal📣 What’s up traders!
CFX just got injected with hopium from a pharma deal, a China stablecoin rumor, and the Conflux 3.0 upgrade… but here’s the thing: when price flies 119% and RSI hits 94, smart money starts reaching for the eject button. 🚨
🔥 TRADE SETUP
Bias: Short
Strategy: Sell-the-News Reversal
Entry: $0.25 – $0.27
SL: $0.29
TPs: $0.186, $0.145, $0.120
Why?
– HTF rally straight into resistance
– RSI 94 + $11M in short liquidations = exit liquidity confirmed
– OI and funding surged, now showing early cracks
– LTF BOS + failed continuation at highs.
Candle Craft | Signal. Structure. Execution.
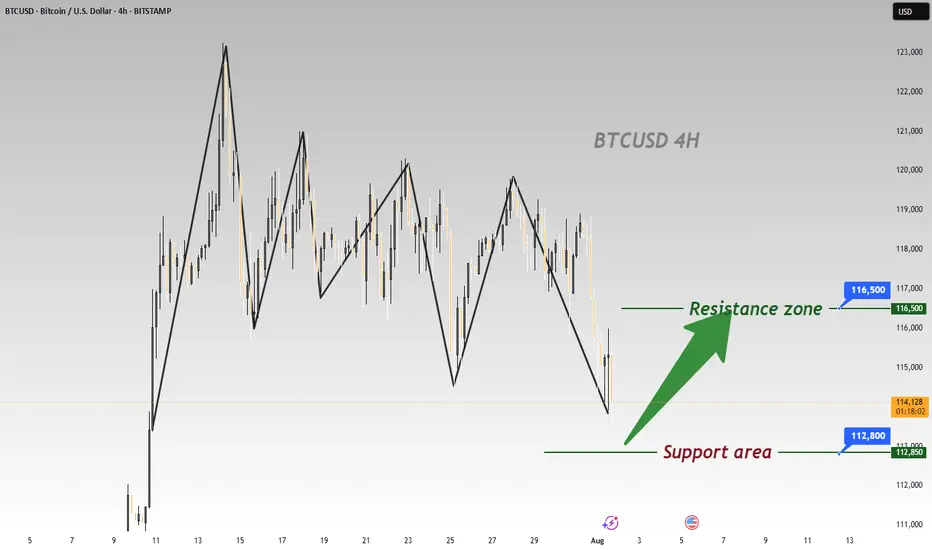
BTC Plummets Post-NFP; Go Long for Rebound to 116500BTC has plummeted significantly under the influence of the non-farm payroll data 📉, and now is an excellent opportunity to go long. Its Support level is around 112800, and according to the current trend, we can wait for a rebound to around 116500.
⚡️⚡️⚡️ BTCUSD ⚡️⚡️⚡️
🚀 Buy@ 113000 - 113800
🚀 TP 114500 - 115500 - 116500
Daily updates bring you precise trading signals 📊 When you hit a snag in trading, these signals stand as your trustworthy compass 🧭 Don’t hesitate to take a look—sincerely hoping they’ll be a huge help to you 🌟 👇
Xausd techinical analysis.Xausd techinical analysis next move posibale at h1 time frame not finchinical advice.
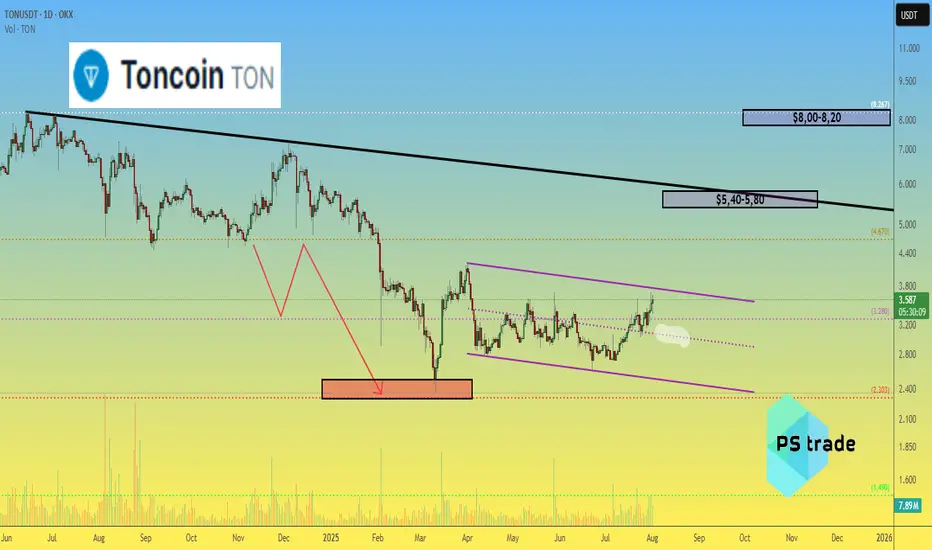
Toncoin TON price analysis💎 CRYPTOCAP:TON didn’t become a legend over the past 9 months — but at least our correction target of $2.30–2.50 played out with precision.
While most of the crypto market is currently going through a correction, #Toncoin keeps pushing upward. Still, we remain realistic:
🎯 First target: $5.40–5.80
🎯 Second target: $8.00–8.20
🚀 It’s not a “to the moon” scenario, but a potential 2x–3x from current levels is attractive.
The key support level OKX:TONUSDT remains at $3.00 — as long as it holds, the bullish trend remains valid.
BTCUSD Possible scenario BTCUSD is trading in range bound way and soon may breakout of again go down. Enter buy only on breakout and retest til then bearish will continue.
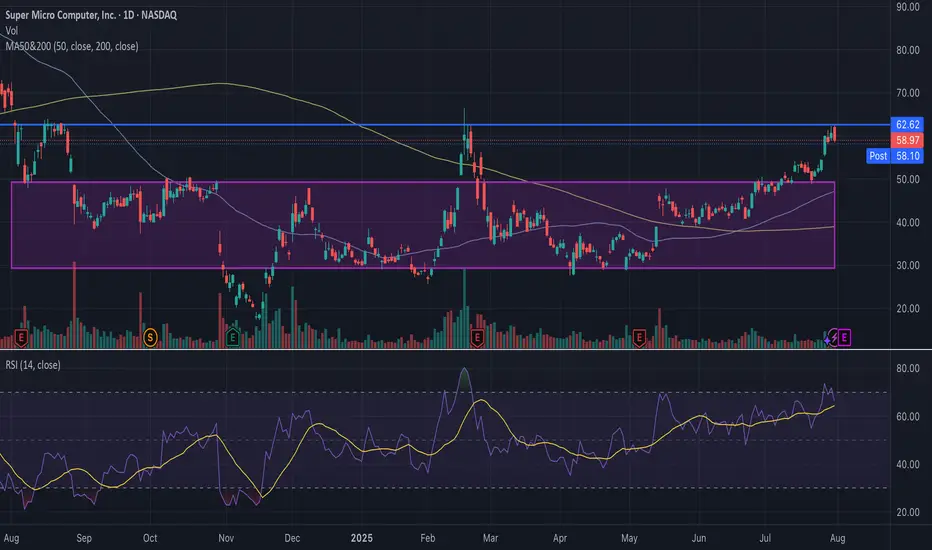
SMCI Short-Term Put PositionSMCI is currently struggling to break past a key historical trend line around $62–$63, a level that acted as resistance multiple times over the past year. The stock briefly broke above $60, but failed to hold the breakout, signaling potential exhaustion. Price is approaching overbought territory with RSI nearing 70. This move is also extended from both the 50-day (blue) and 200-day (yellow) moving averages. Additionally, volume was not exceedingly high during the breakout. I have strong conviction that it will drop to ~50. SMCI spent nearly 9 months trading between ~$33 and ~$50, as shown in the purple consolidation box. If this breakout fails, $50 becomes a natural target, as its the resistance line in the consolidation box where SMCI has been trading at for 9 months. A close below $58 (today’s low) would confirm rejection and likely accelerate selling. A put position could be highly profitable.
MNMD Weekly consolidation underway. What will earnings do?MNMD has started weekly consolidation by 2c right as ATAI and possibly CMPS end their weekly consolidations. Earnings after hours tonight had no real effect on the charts, so here are the levels I'm looking at into tomorrow. Click to watch the free video for more details
I provider regular chart analysis of the psychedelics sector. Be sure to Like and Follow, and Subscribe to future updates so you don't miss a post!
Support: 8.94, 8.79
Resistance: 9.40, 9.44

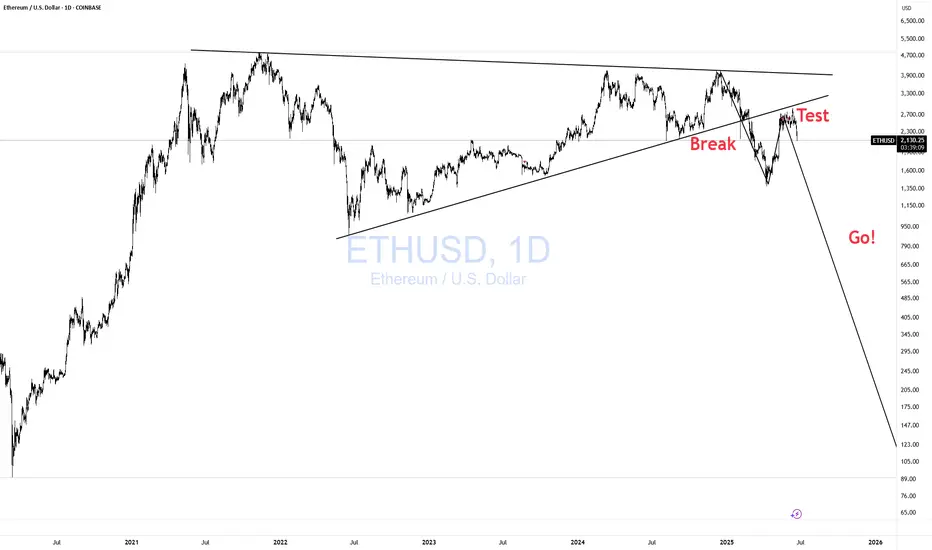
ETHUSD Break- Test- GO!!! Nothing Changed! 3rd EditionI have been warning about this for some time. Please visit my previous two posts for more info and updates.
Magic!
Click boost, follow, and subscribe for more. Let's get to 5,000 followers ))
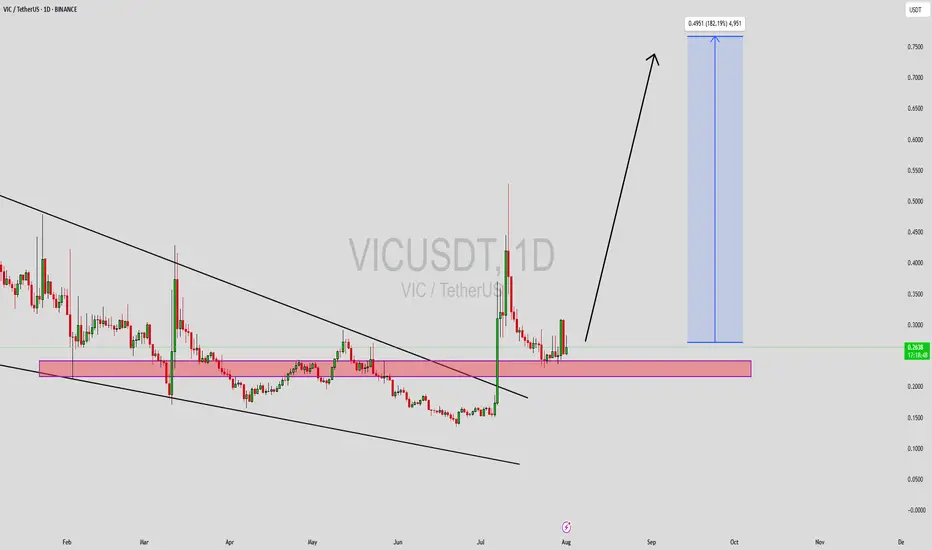
VICUSDT Forming Descending WedgeVICUSDT is currently displaying a classic descending wedge pattern, which is often recognized as a bullish reversal signal in technical analysis. This pattern typically emerges after a prolonged downtrend, and when paired with good volume — as we’re now seeing — it suggests that selling pressure is weakening and a breakout to the upside could be imminent. VIC has respected its wedge boundaries well, and now it's approaching the breakout zone, making this an ideal time for technical traders to watch closely.
Volume has been steadily increasing, which supports the idea of accumulation at the current levels. This convergence of price and volume dynamics signals that smart money may be positioning itself ahead of a potential rally. Based on the measured move from this wedge pattern, a 140% to 150% gain could be on the horizon once confirmation of breakout is secured. The price is also hovering near historical support, which adds another layer of confluence to the bullish outlook.
With investor interest rising and sentiment shifting, VICUSDT has the potential to outperform in the coming sessions. Altcoins that consolidate in well-defined reversal patterns and attract volume are often primed for explosive moves. Traders looking for setups with strong technical structure, breakout confirmation, and momentum alignment may find VICUSDT to be one of the top candidates for mid-term gains.
This is a high-reward opportunity for patient and disciplined traders. Keep an eye on resistance breakout levels and volume surges, as they may trigger the start of a powerful trend reversal.
✅ Show your support by hitting the like button and
✅ Leaving a comment below! (What is You opinion about this Coin)
Your feedback and engagement keep me inspired to share more insightful market analysis with you!
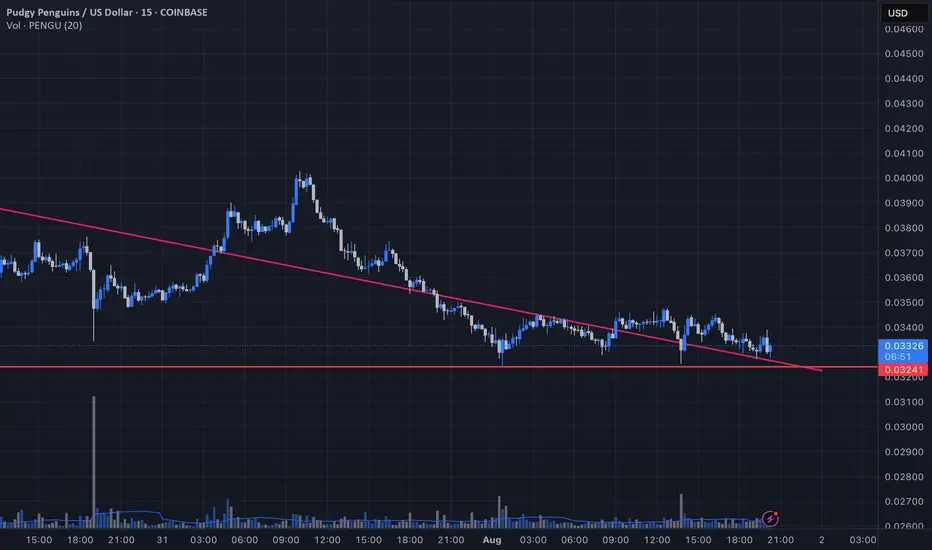
Pengu supportLooks like we have had a few runs to the highs from breaks of downward channels. Ended up forming a double top but have found some seemingly strong support levels here at the top end of a previous pennant break.
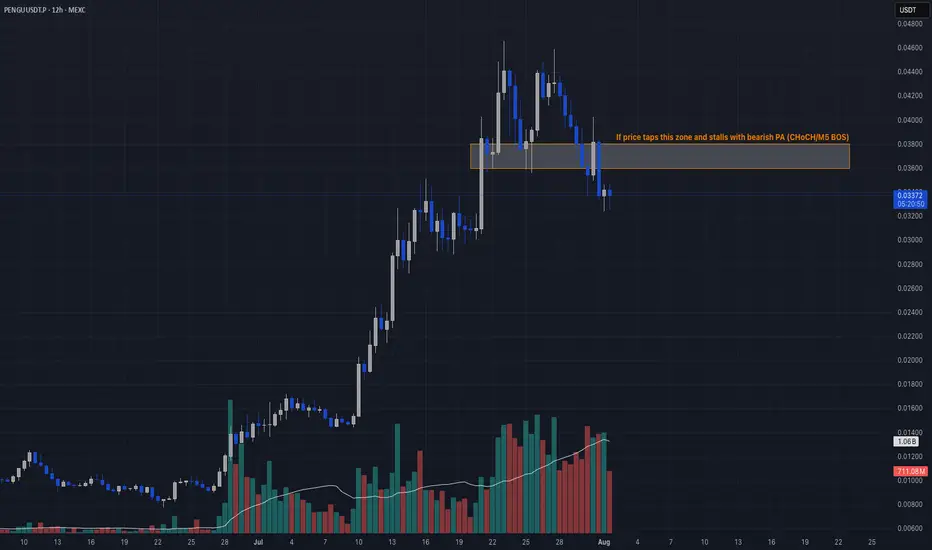
Insider Selloff + Liquidity Sweep🔻 PENGU/USDT TRADE IDEA 🔻
📣 Hey CandleCraft crew!
Today we’re diving into a chilly little bird that flew a bit too close to the heat. 🐧 PENGU pumped hard — but when team wallets start dumping $17M worth of tokens, that’s not bullish, that’s suspicious. Think iceberg ahead.
🔥 TRADE SETUP
Bias: Short
Strategy: Insider Selloff + Liquidity Sweep
Entry: $0.036 – $0.038
SL: $0.041
TPs: $0.030, $0.025, $0.018
Why?
– HTF sweep of liquidity above $0.04
– Insider wallet moved 485M tokens to exchanges
– LTF CHoCH + RSI breakdown
– Price hovering under 20-day EMA with weakening volume.
Candle Craft | Signal. Structure. Execution.
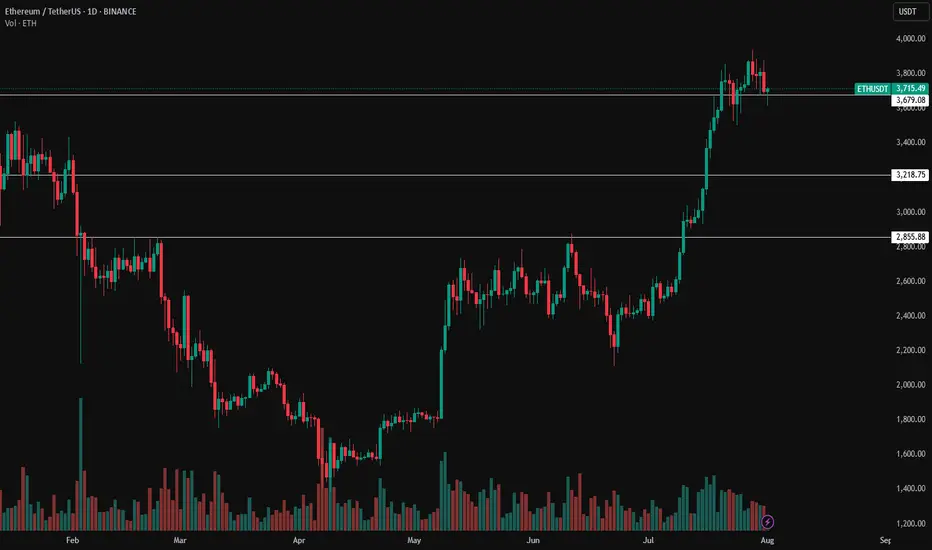
ETH Still Holding Key LevelDespite the recent pullback following the FOMC meeting, Ethereum is still trading above a key daily level that previously acted as resistance ($3,865). As long as we don't see a daily close below this zone, the market structure remains intact, and my bias stays bullish.
Support holding here could set the stage for another leg up and potentially reignite altseason, going below will cause me to shy away from the idea of an altseason in the short future.
For now, I’m watching daily close closely and staying patient
XRPUSDT → Range formation. Retest of resistanceBINANCE:XRPUSDT.P , after a false breakout of the daily resistance level of 3.352 and the elimination of traders, has entered a correction phase. The trading range shown below has been formed, with an emphasis on resistance...
XRP previously formed a false breakout of the daily resistance level of 3.352, as indicated in the idea above. After changing its market character, the price entered a correction phase. Focus on the range of 3.00 - 3.264. A retest of resistance (zone of interest and liquidity) is possible before falling to 3.161, 3.05 or to the liquidity zone of 3.00. There are no technical or fundamental reasons for exiting the consolidation; most likely, a retest of the zone of interest may end in manipulation and a pullback to support...
Resistance levels: 3.1609, 3.264, 3.352
Support levels: 3.05, 3.00
I do not rule out the fact that a retest of the 3.264 resistance level may have a breakout structure and the price will continue to rise, but based on the price behavior pattern on D1, the market structure, and market stagnation, I conclude that at the moment, the chances of seeing a correction from resistance are higher. Further developments will need to be considered after the retest of key zones on the chart...
Best regards, R. Linda!

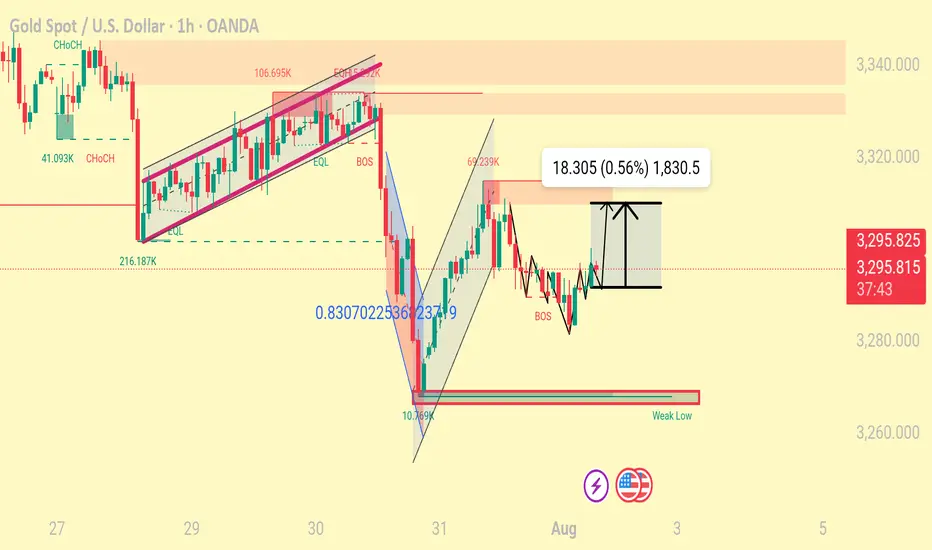
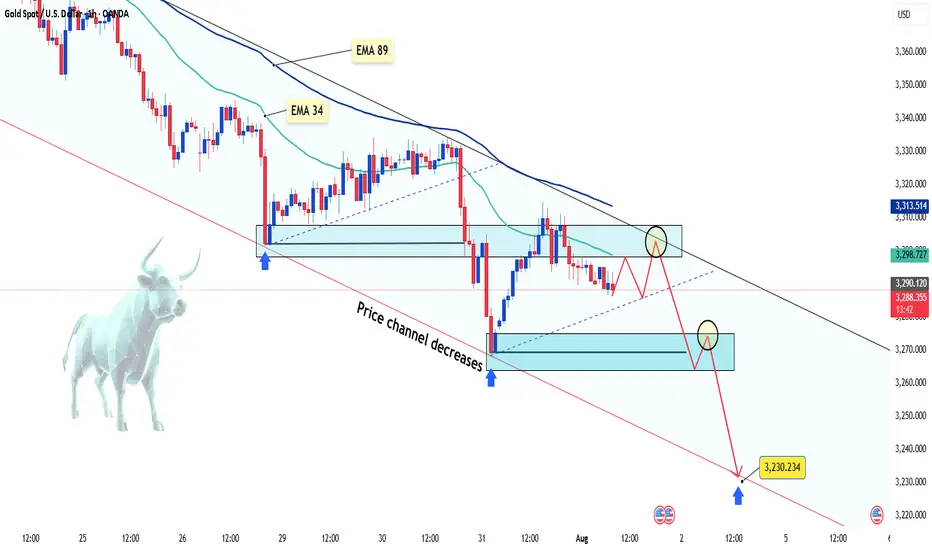
Gold keeps falling – is there more to come?Hello everyone, great to see you again!
Today, gold remains under pressure following a series of strong U.S. economic data releases, which have reinforced expectations that the Federal Reserve will keep interest rates elevated for longer. As a result, the U.S. dollar has strengthened, Treasury yields have climbed, and gold has lost its footing.
On the H1 chart, XAUUSD is clearly trading within a descending price channel. Both the EMA 34 and EMA 89 are acting as dynamic resistance zones. Recent attempts to rally have consistently failed at these levels, mirroring the bearish setup seen before July 29.
Currently, price is retesting a minor resistance area. If this retest fails, the next downside targets lie near 3,270 – and potentially down to 3,230 USD, which aligns with the lower boundary of the price channel.
From my perspective, the bearish momentum is likely to continue.
What about you? How do you think gold will close the day?
Meme Coin Liquidity Trap📣 Hey CandleCraft fam, remember this one?
We nailed the previous BONK long — while it didn’t tag the absolute top, it delivered us a clean, sharp profit right out of the gate. Now? The story has flipped. Meme energy is fading, funding flipped, and the structure’s screaming reversal. Let’s see how this short idea plays out. 🐶💨
The dog barked loud — BONK went full meme mode with a 203% pump… but now it’s giving off that “walk of shame” energy. 🐶 RSI tanked, funding flipped, and it’s bleeding liquidity. Who let the dogs out? Probably market makers.
🔥 TRADE SETUP
Bias: Short
Strategy: Meme Coin Liquidity Trap
Entry: $0.0000355 – $0.0000370
SL: $0.0000400
TPs: $0.000030, $0.000025, $0.000020
Why?
– Overextended meme coin pullback
– Funding rate negative = longs bleeding
– OI down 35%, RSI from 85 → sub-50
– Price hovering under 20-day EMA support
Candle Craft | Signal. Structure. Execution.

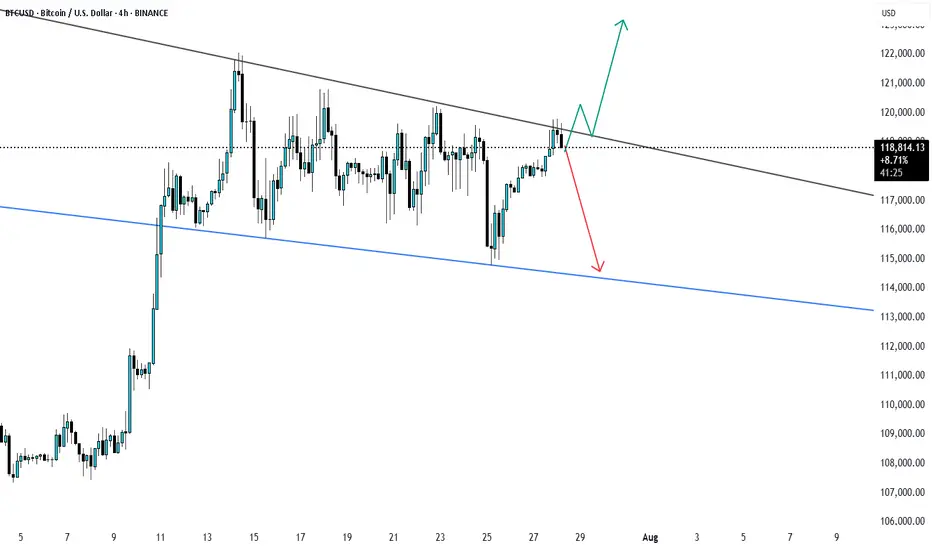
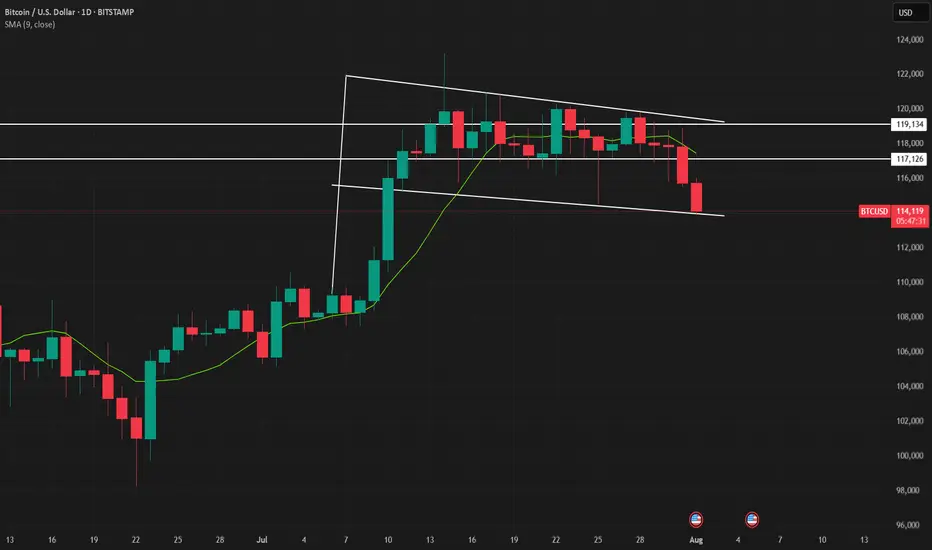
Bitcoin Bull Flag - will it collapse?Bitcoin is currently in a bull flag.
Will it hold — or collapse?
The weekly close will decide.
🔹 If BTC closes above the bull flag support: Possible continuation of the rally.
🔻 If BTC closes below the flag: Expect a deeper correction.
Stay sharp. The weekly close is key IMO.
No FA. DYOR! For educational purpose only.
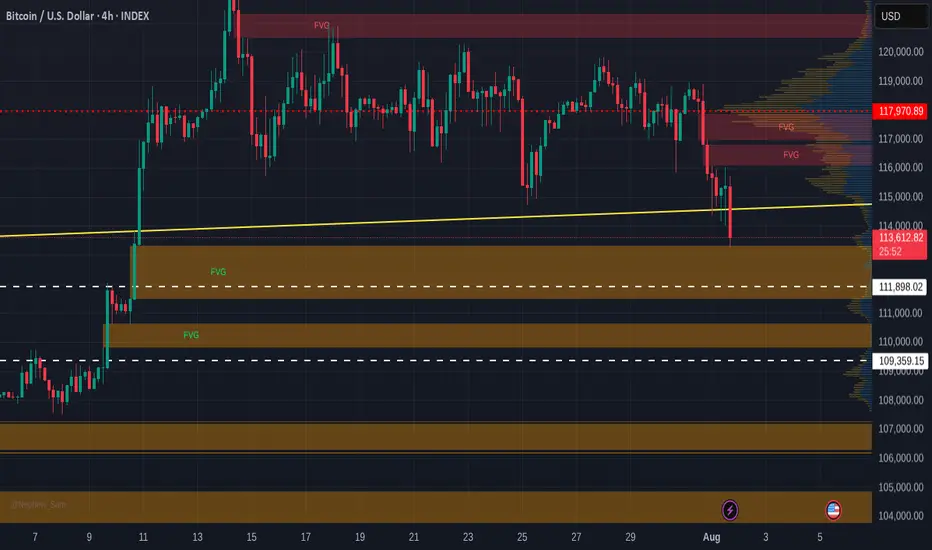
Bitcoin Free Value Gaps getting filled - 109 K target >
If you look back at the last time I posted a chart with Free Value Gaps ( FVG ) you will see an orange bar where PA currently sits...The reason it is no longer there is because it ogt "Filled"
It is much the sameidea as CME Gaps. Thay also get filled very often/
So, we can see 2 more FVG before 107K line and so, in the current market state and with the knowledge that in August, Markets often Dip, we may well see PA retreat to the Gap at 109K
What a superb buying oppertunity
End of post as I am enjoying an evening in the south of France, with wine and Fun..
What it stopping you ?