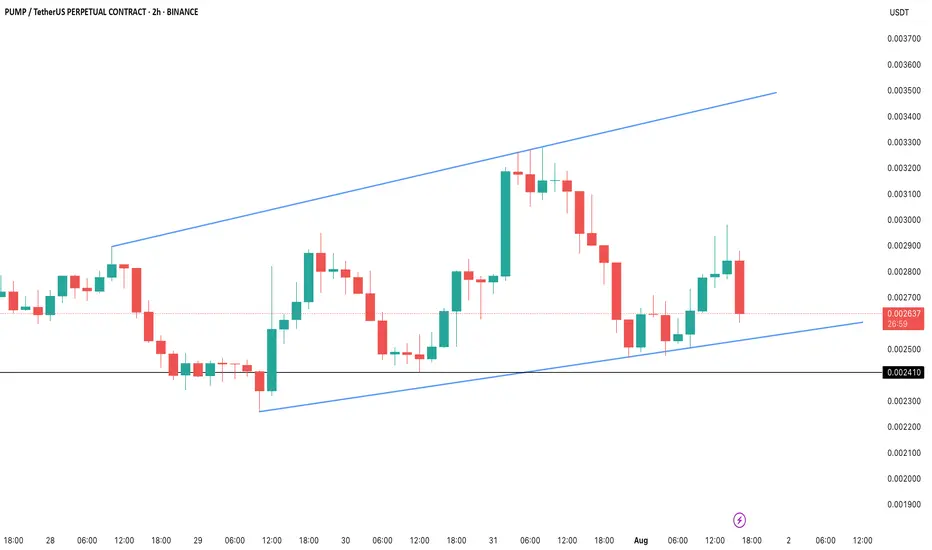
PUMP/USDT: Whales Buy the Dip as Price Holds Key LevelBINANCE:PUMPUSDT.P price has taken a steep 18% hit in the last 24 hours, but the 2-hour chart shows BINANCE:PUMPUSDT.P price action clinging to a critical Fibonacci support near $0.00259. The token is still trading inside an ascending channel, hinting that the bullish structure hasn’t fully broken yet.
Whales have been scooping up the dip aggressively, adding 5.4 billion PUMP tokens over the past week (a 35.8% jump in their holdings). Despite retail selling pushing netflows positive intraday, big wallets continue to absorb supply. Daily accumulation is also up 3.2% in the last 24 hours, reinforcing the demand floor near current levels.
Meanwhile, long positions dominate the liquidation setup, with $7.88 billion in longs versus just $3.6 billion in shorts. If BINANCE:PUMPUSDT.P price bounces, a cascade of short liquidations could amplify the recovery rally. But failure to defend $0.00259 risks opening the door to $0.00241, putting bulls on the back foot.
For now, the $0.00259–$0.00260 zone is the make-or-break level. Holding above keeps BINANCE:PUMPUSDT.P price inside the bullish channel, setting up a potential retest of $0.00284–$0.00294. A breakdown, however, could flip sentiment sharply bearish.
Chart Patterns
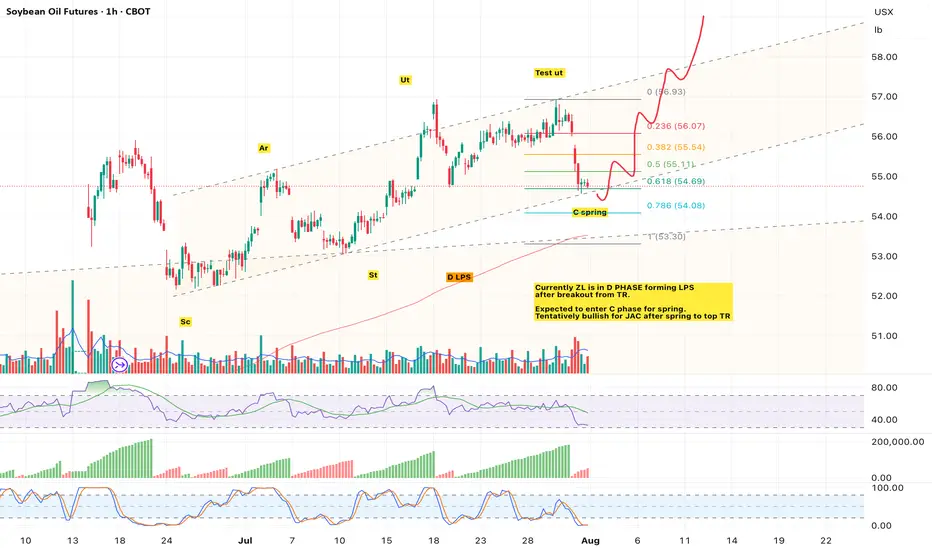
ZL ON LAST POINT OF SUPPORTExpected to enter C phase and rebound to top TR for JAC before continuing markup.
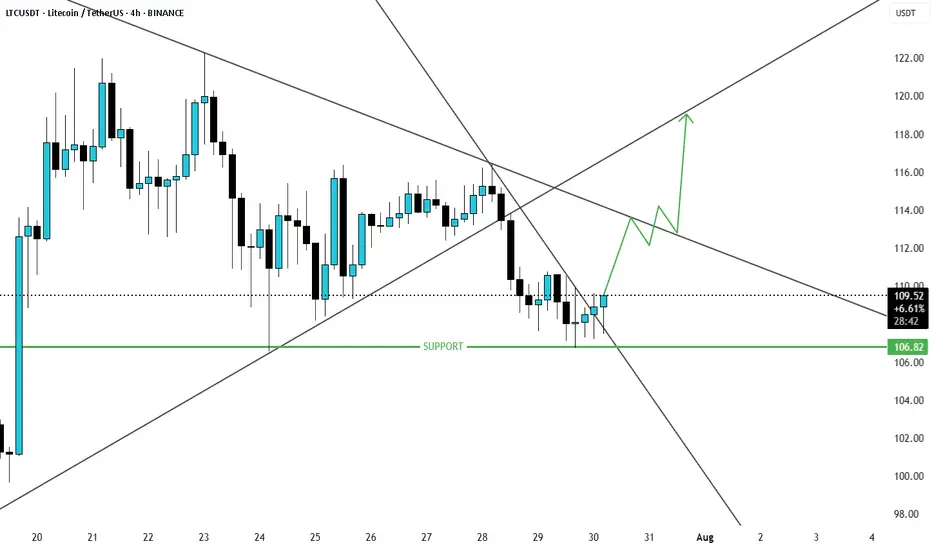
LTCUSD Possible Scenario breakout of trendline resistanceLTCUSD is at major support and has now broken the resistance and price will likely will move up.
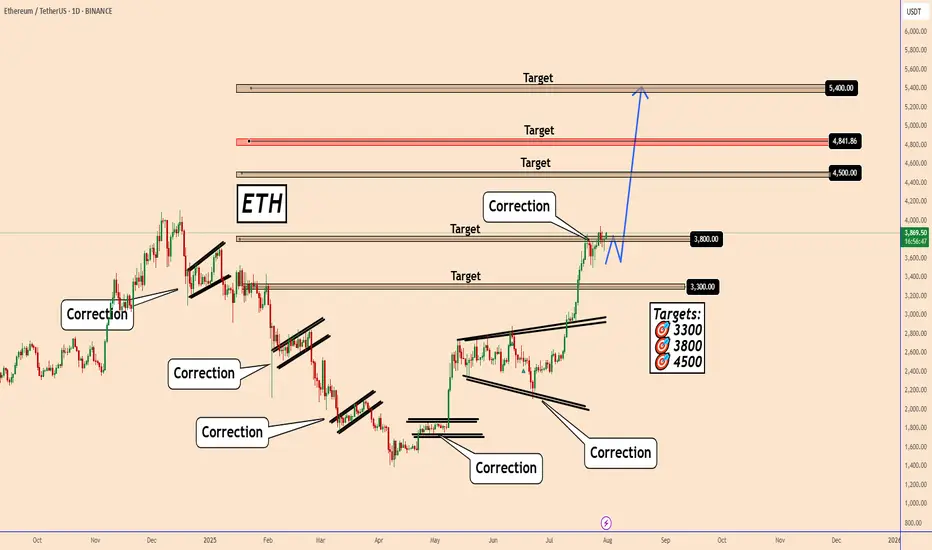
Ethereum: Bullish Momentum Recharging for the Next Leg UpEthereum: Bullish Momentum Recharging for the Next Leg Up
Daily Perspective on ETH Ethereum remains in a clear bullish trend on the daily chart. The long and consistent green waves reflect strong upward momentum over the past several days and weeks.
Looking left on the chart, ETH previously made several corrective moves during bearish phases. The current correction looks similar to those on the left side of the chart, but this time it is taking place within an uptrend.
The price is currently in a consolidation phase, likely preparing for another push higher. I’m watching three key upside targets: 4500, 4840, and 5400.
You may find more details in the chart!
Thank you and Good Luck!
PS: Please support with a like or comment if you find this analysis useful for your trading day
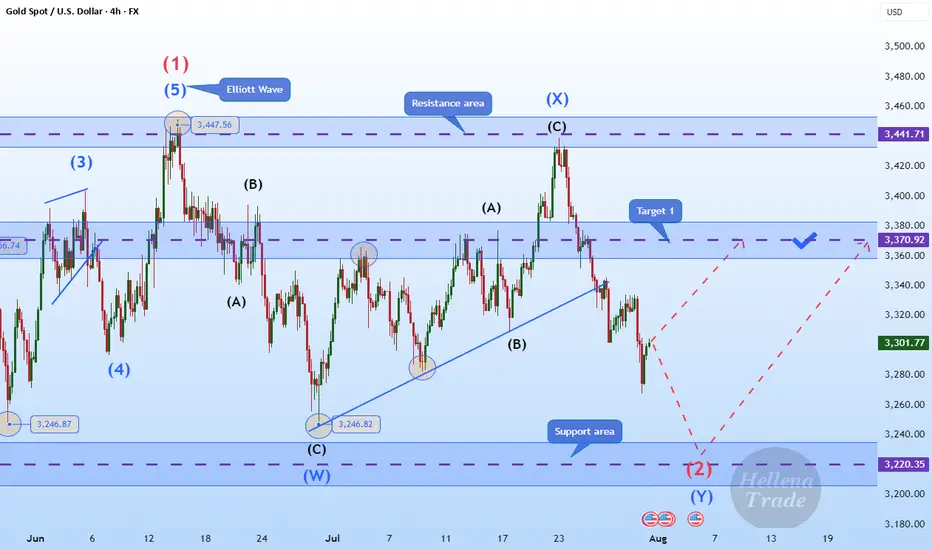
Hellena | GOLD (4H): LONG to area of 3370 (Wave 2).Colleagues, gold is once again disrupting our plans, and I have to revise the wave marking. It's not easy, but the most important thing is to keep doing it.
Now I'm back to the previous marking — the price is in wave “2” correction.
To complete this wave, the price needs to overcome the level of wave “W” of the middle order 3246.82. Then the correction will be completed and wave “3” will begin an upward movement.
I see the minimum target in the area of the 3370 level.
Manage your capital correctly and competently! Only enter trades based on reliable patterns!
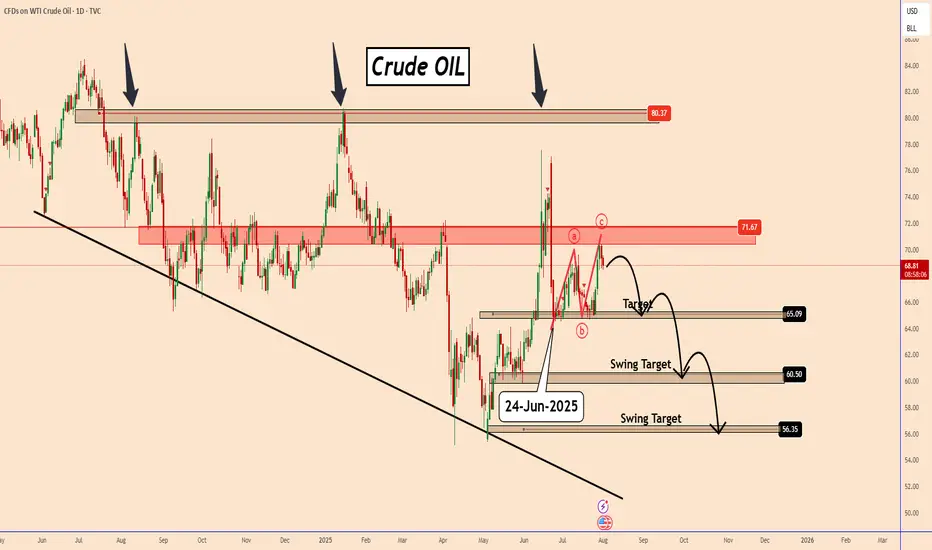
Oil Faces Bearish Turn After Speculative SpikeOil Faces Bearish Turn After Speculative Spike
Since June 24, 2024, when oil prices reached $64 entered a 38-day bullish correction. Based on the chart, this move appears to be forming an ABC corrective pattern, which may now be nearing completion.
From here, a renewed decline is likely, with potential downside targets at $65, $60, and $56.
Geopolitical Speculation Oil prices jumped in recent days following President Donald Trump's heightened rhetoric toward Russia. His announcement of a tighter deadline to end the war in Ukraine, along with tariff threats targeting countries trading Russian oil, stirred market reactions.
However, this rally seems driven more by speculation, and oil may soon resume the bearish movement again.
You may find more details in the chart!
Thank you and Good Luck!
PS: Please support with a like or comment if you find this analysis useful for your trading day
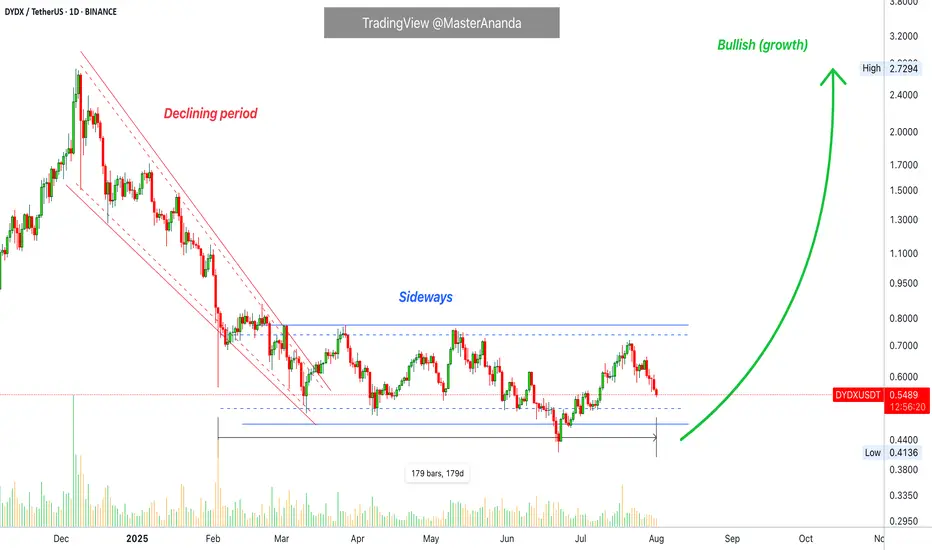
dYdX Bottom Consolidation Continues, Bullish NextHere you are looking at the formation of a bottom. The formation is a process not a single day event. It can take months for a bottom to fully form.
The way you know this to be true is because there is no downtrend. There are no new lows.
DYDX has been sideways now for 179 days, 6 months. Since early February 2025. In just three months, between December 2024 and March 2025, there is a very strong decline; lower highs and lower lows. A bearish move, a down-wave, a downtrend.
Ever since February the downtrend is no more. Rather than new major lows we have shy lower lows and finally not even that, no new lows. You can see the pattern how the market turned from bearish to sideways. This is the transition period. From sideways it will turn bullish, bullish goes next.
This is the point in time when most people will lose patiently and fold at a loss. Sell at the bottom, near support. This is the most important time to be patient, to accumulate, to even buy more and hold because we are looking at bottom prices. When prices are trading at the bottom and you are a bull, you can't go wrong.
Buy and hold. Continue holding because the market will soon turn.
Namaste.
$UVXY Signaling Trouble — $SPY Could Drop 10%+ In this video, I discuss why August/September could bring serious downside for the market, despite my long-term bullish stance.
Right now, SPY is trading around $632, but I have a downside target of $573 in the short term. If we get volume beneath $573 — especially a break below the daily EMA — SPY could drop quickly, with a potential fall all the way to $480 in the coming weeks/months.
At the same time, UVXY is signaling a correction for the overall market after rallying from the low's of April. I have a target of $30 and when UVXY starts to move, it often reflects sharp market corrections — and the setup is beginning to mirror that now.
Despite this short-term bearish outlook, I want to make it clear: I am very bullish long term. Any 10–20% correction will be a major buying opportunity for me. I'm watching key levels closely and preparing to take advantage when the market overreacts.

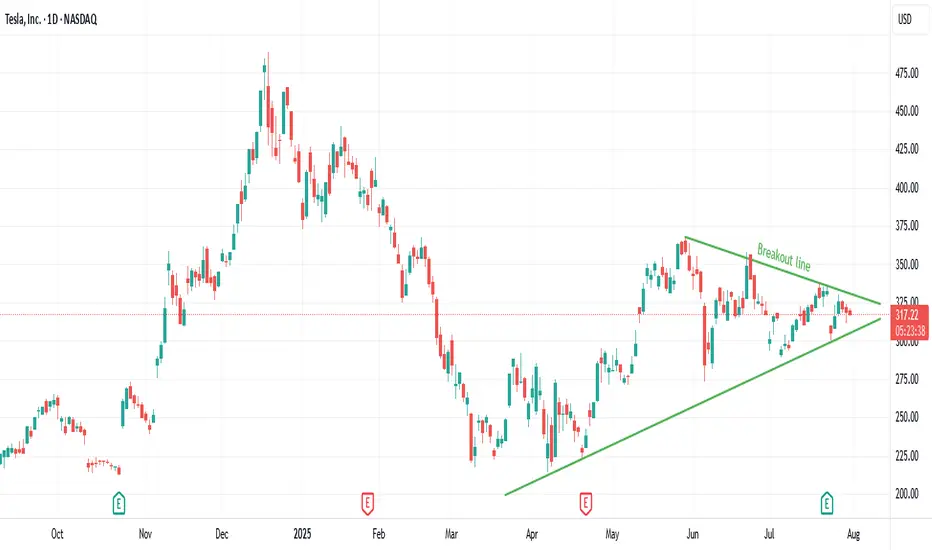
TSLA Breakout Watch: Symmetrical Triangle Squeeze!Trade Summary
Setup: Symmetrical triangle pattern tightening since March; volatility compression signals an imminent breakout.
Entry: On daily close above the triangle resistance (~$324)
Stop‑loss: Below triangle support (~$305)
Targets:
• Target 1: $375
• Long-term: $500+
Risk/Reward: ~2.5–3:1 (Initial target), higher for long-term hold
Technical Rationale
📈 Symmetrical triangle: Clear converging trendlines; price nearing apex after months of higher lows and lower highs
🔔 Volatility squeeze: Range compression increases odds of explosive move
⏳ Daily timeframe: Signals a swing/position trade opportunity with significant upside
Catalysts & Context
⚡️ Earnings season ahead could trigger a breakout
🌱 EV sector momentum and renewed tech leadership
🏦 Analyst upgrades and potential for macro rate cuts
Trade Management Plan
Entry: Wait for a daily close and volume confirmation above $324 resistance
Stop-loss: Tight initial stop below $305; trail to breakeven after breakout confirmation
Scaling: Partial profits at $375; let remainder run for $500+ if momentum continues
Poll
What’s your view? Are you watching TSLA? Comment below or vote:
🔼 Bullish
🔽 Bearish
🔄 Waiting for confirmation
Follow us for daily high-probability setups & real-time trade updates!
Disclaimer: Not financial advice. Trade at your own risk.
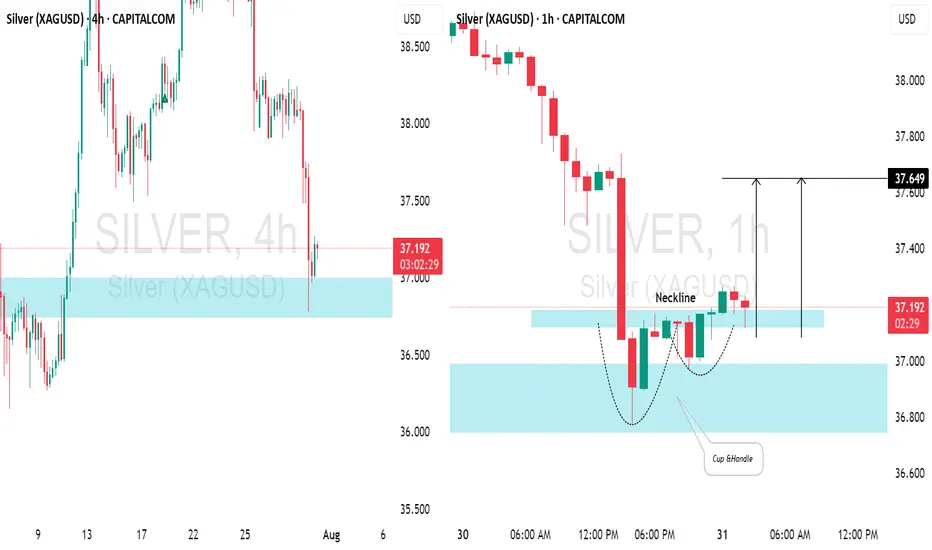
SILVER (XAGUSD): Time for Pullback📈SILVER appears to be oversold following yesterday's decline.
After testing a significant daily / intraday support level, there's a noticeable bullish reversal.
The price formed a cup & handle pattern on the hourly chart and has broken above its neckline. We can expect a pullback to at least 37.64.
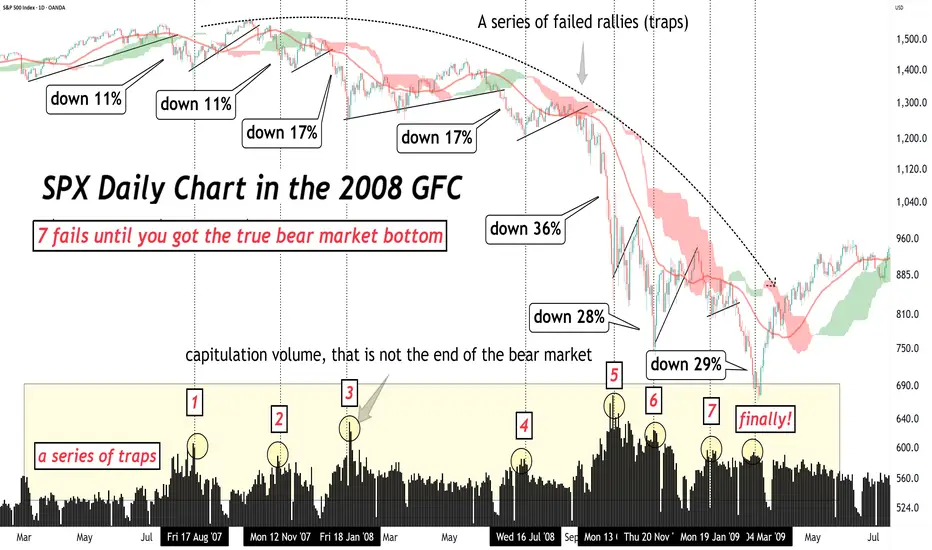
The worst drops often come later!Don’t be fooled by the first crash… The worst drops often come later in a bear market.
Let’s break down the brutal truth about the 2008 GFC and what it teaches us today. 🧵
1.
In the 2007–2009 bear market, the S&P 500 had 7 failed rallies before finally bottoming.
Every bounce looked like the bottom — and every one was a trap.
👇
2.
The early drops were steep:
🔻 Down 11%
🔻 Down 17%
But the most violent crashes came after those…
Near the END — not the beginning — of the bear market.
3.
Later stage declines:
❌ Down 28%
❌ Down 36%
❌ Down 29%
That’s when capitulation kicked in.
Investors gave up. Fear took over.
4.
Capitulation volume isn’t a guaranteed bottom.
It feels like it’s over.
But if fundamentals haven’t turned and the trend isn’t broken, the bear can still bite — hard.
5.
Final crashes are like cliffs:
Markets are exhausted.
Hope is crushed.
And that’s finally when the real bottom shows up.
6.
The lesson?
Bear markets are full of traps.
Relief rallies can fool even seasoned pros.
Stay patient. Wait for trend confirmation. Don’t chase fake bottoms.
7.
📉 The biggest crashes usually happen at the end of the bear market.
That’s the final flush — and it sets the stage for true opportunity.
Learn from the past. Don’t get trapped. Stay sharp.
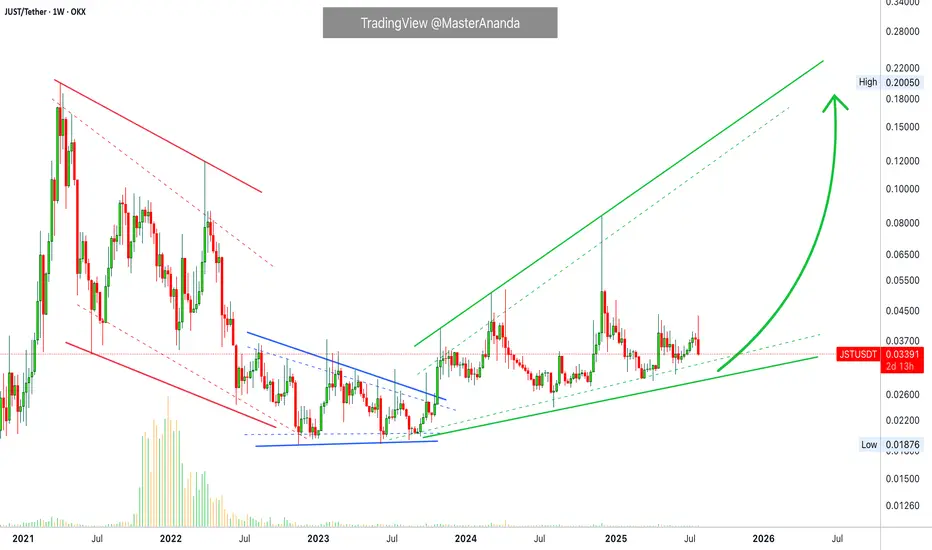
JUSDT Short-Term Retrace vs Long-Term UptrendJST is not trading at bottom prices because the low was hit November 2022, but the bigger picture still looks like a long-term consolidation pattern. Sideways for years, this precedes a major bull market.
Good morning my fellow Cryptocurrency trader, I hope you are having a wonderful day.
JSTUSDT is looking weak short-term but we know this to be part of the same process, the one that has been going on for years. Higher lows and higher highs but still no major bullish wave, it is getting closer though because the market can only consolidate for so long.
JST has been rising. The high December last year (2024) hit the highest prices since March 2022, the month when the previous bear market breakdown took place.
The red period is the bear market. Notice how it ends when the downtrend is no more and the market turns blue, sideways. After this period comes green and this is where we are now.
Within the bullish period we also have retraces and corrections. Right now we have a bearish move, short-term, within a wider bullish move, an uptrend long-term. This is the normal and classic market fluctuations; prices moving down and up, up and down, back and forth, every day.
The end of the short-term move will result in the continuation of the bigger move, the uptrend. We should expect a higher low followed by a strong higher high next. The next higher high comes in late 2025, now.
Thank you for reading.
Namaste.
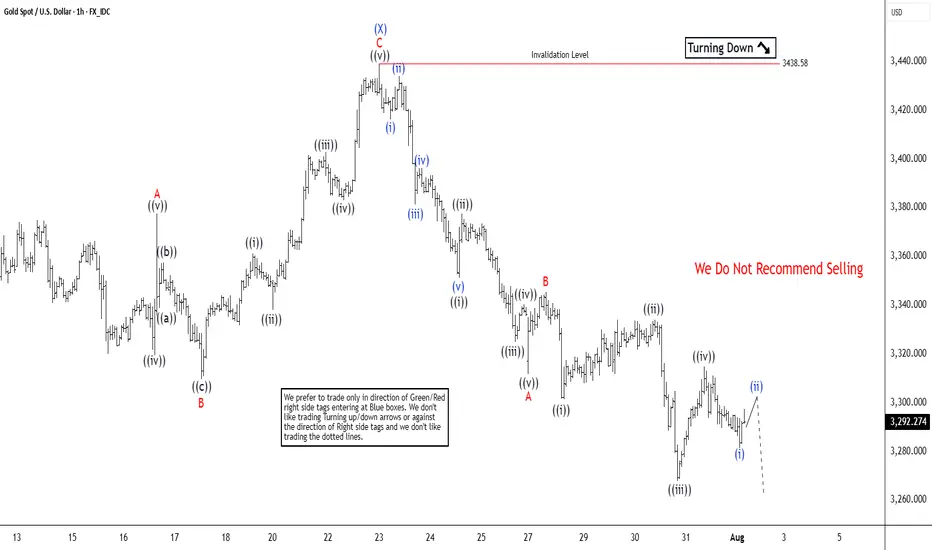
Elliott Wave Analysis Points to Gold (XAUUSD) Support Near 3320Gold (XAUUSD) appears poised for a double correction from its 16 June 2025 high. A double three consists of two corrective patterns, typically zigzags. From the June peak, wave (W) concluded at 3246.55, and wave (X) rallied to 3438.58, as shown on the 1-hour chart. Wave (Y) is now unfolding lower with internal subdivision as a zigzag. From wave (X), wave ((i)) ended at 3351.17, and wave ((ii)) peaked at 3377.45. Wave ((iii)) declined to 3324.80, followed by a wave ((iv)) rally to 3340.34. The final wave ((v)) completed at 3311.62, forming wave A in a higher degree. A corrective wave B rally reached 3345.35 before gold resumed its downward move.
Within wave C, wave ((i)) finished at 3301.47, and wave ((ii)) rallied to 3334.08. Wave ((iii)) dropped to 3267.94, with wave ((iv)) ending at 3314.85. Gold should continue lower in wave ((v)) to complete wave C. The potential target lies within the 100%–161.8% Fibonacci extension from the 16 June high. This projects a support zone between 3104 and 3230, where a three-wave rally is anticipated. Traders should monitor this area for potential reversal signals, as it may offer support for a corrective bounce.
Tesla - The all time high breakout!🚗Tesla ( NASDAQ:TSLA ) will break out soon:
🔎Analysis summary:
For the past five years Tesla has overall been consolidating between support and resistance. But following the recent bullish break and retest, bulls are slowly taking over control. It is actually quite likely that Tesla will soon break above the previous all time highs.
📝Levels to watch:
$400
🙏🏻#LONGTERMVISION
SwingTraderPhil

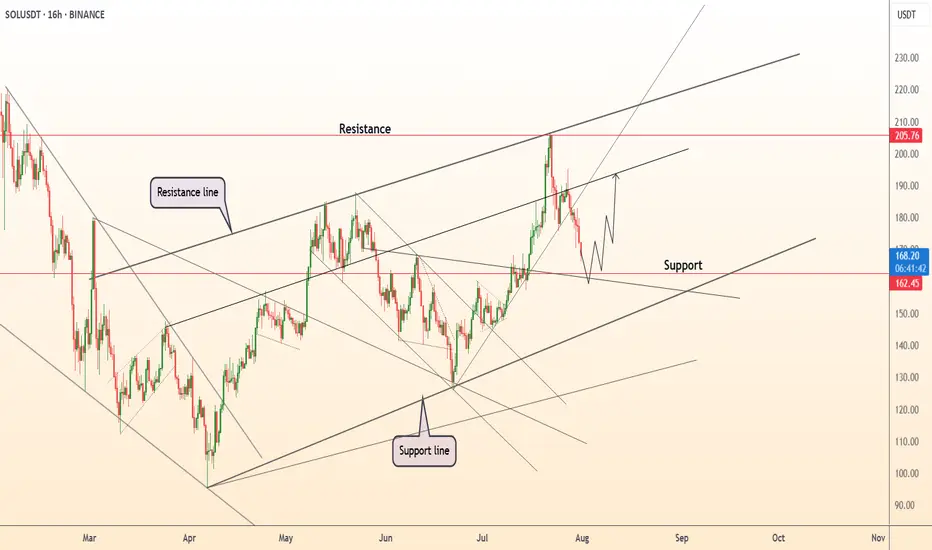
DeGRAM | SOLUSD will test the support level📊 Technical Analysis
● SOLUSD is pulling back after testing the upper resistance channel near 205 and is now approaching key support at 162.5, aligning with the breakout zone.
● Structure remains bullish as price respects the midline of the ascending channel, and upside continuation toward 205 remains likely if 162 holds.
💡 Fundamental Analysis
● Solana remains a top performer in weekly ETP inflows, per CoinShares, and continues to dominate in NFT volume and developer activity.
● Funding remains positive across major derivatives platforms, signaling sustained bullish sentiment despite short-term volatility.
✨ Summary
Long bias above 162. Breakout target remains 205 ▶ 220. Setup remains valid while above key structure support.
-------------------
Share your opinion in the comments and support the idea with a like. Thanks for your support!
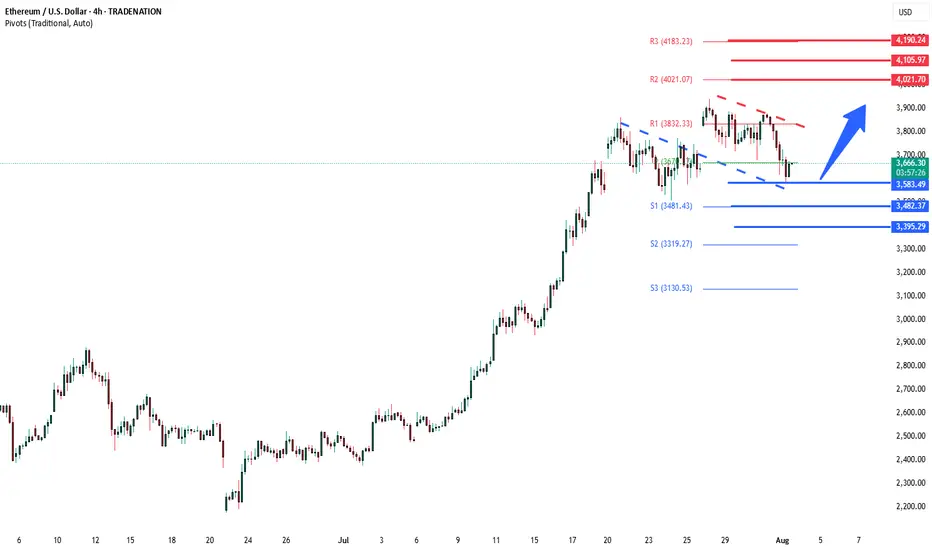
ETHUSD previous resistance new support The ETHSD remains in a bullish trend, with recent price action showing signs of a corrective pullback within the broader uptrend.
Support Zone: 3,667 – a key level from previous consolidation. Price is currently testing or approaching this level.
A bullish rebound from 3,667 would confirm ongoing upside momentum, with potential targets at:
4,020 – initial resistance
4,105 – psychological and structural level
4,190 – extended resistance on the longer-term chart
Bearish Scenario:
A confirmed break and daily close below 3,667 would weaken the bullish outlook and suggest deeper downside risk toward:
3,584 – minor support
3,482 – stronger support and potential demand zone
Outlook:
Bullish bias remains intact while the ETHUSD holds above 3,667. A sustained break below this level could shift momentum to the downside in the short term.
This communication is for informational purposes only and should not be viewed as any form of recommendation as to a particular course of action or as investment advice. It is not intended as an offer or solicitation for the purchase or sale of any financial instrument or as an official confirmation of any transaction. Opinions, estimates and assumptions expressed herein are made as of the date of this communication and are subject to change without notice. This communication has been prepared based upon information, including market prices, data and other information, believed to be reliable; however, Trade Nation does not warrant its completeness or accuracy. All market prices and market data contained in or attached to this communication are indicative and subject to change without notice.
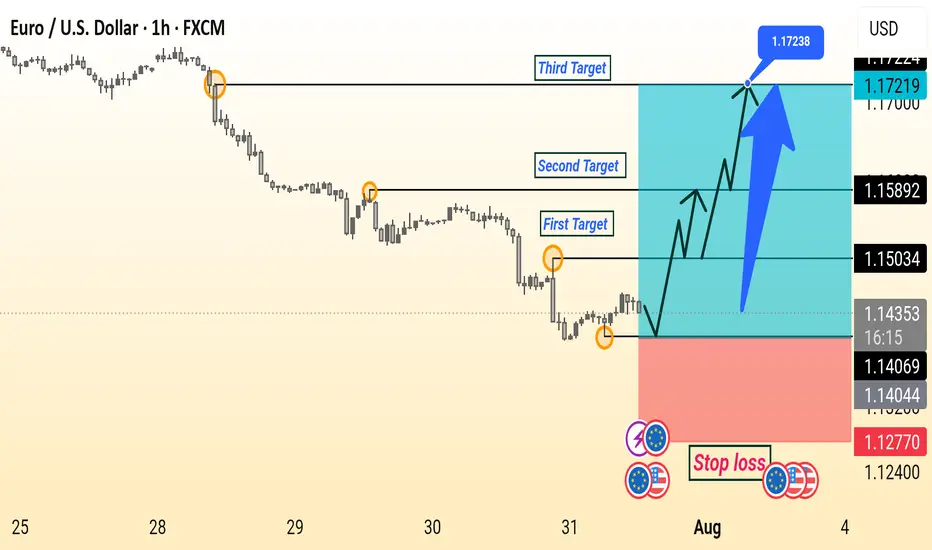
EUR/USD Setup Is Ready This is a bullish EUR/USD (Euro/US Dollar) 1-hour chart analysis. The setup indicates a potential upward reversal after a downtrend, supported by a series of higher lows.
Key elements:
Entry Point: Around 1.14044–1.14376.
Stop Loss: Placed below the recent low at 1.12770 to manage risk.
Targets:
First Target: 1.15034
Second Target: 1.15892
Third Target: 1.17238
The chart suggests a buy setup with a risk-reward strategy, aiming for a breakout and continuation towards higher resistance levels. The large upward arrow emphasizes bullish momentum expectations.
AUDCAD / GBPAUD Trade Recaps 01.08.25A tester trade on AUDCAD with the reasons explained as to why this was a test position, and a short position executed on GBPAUD. Solid setup that this time around just didn't commit.
Full explanation as to why I executed on these positions and the management plan with both.
Any questions you have just drop them below 👇

Alibaba - A remarkable reversal!🛒Alibaba ( NYSE:BABA ) reversed exactly here:
🔎Analysis summary:
Recently Alibaba has perfectly been respecting market structure. With the current bullish break and retest playing out, there is a very high chance that Alibaba will rally at least another +20%. But all of this chart behaviour just looks like we will witness a major bottom formation soon.
📝Levels to watch:
$110, $135
🙏🏻#LONGTERMVISION
Philip - Swing Trader

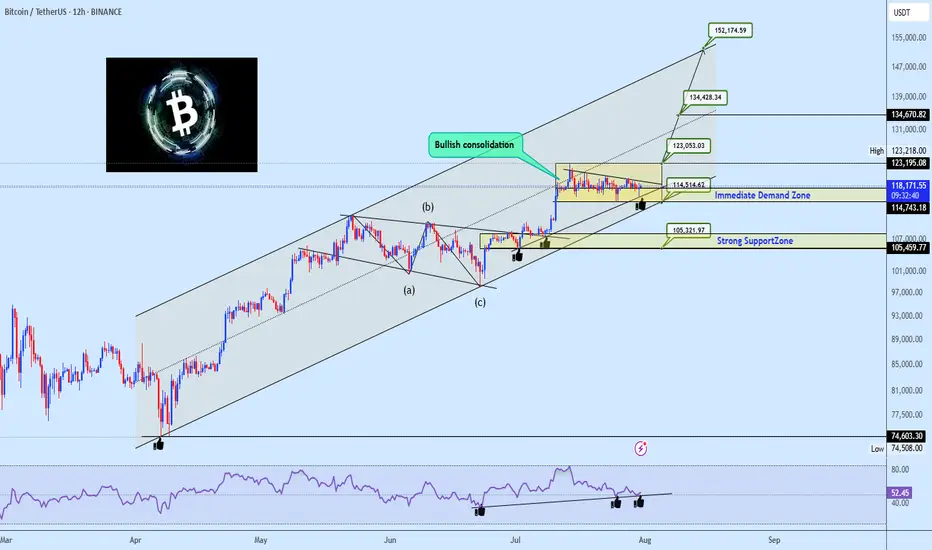
Bullish Channel Intact: BTC Poised for Next Leg Toward 152KBitcoin continues to coil within a bullish consolidation zone above the critical $114.5k–$117.5k Immediate Demand Zone, firmly riding the ascending channel structure that has guided price since the March swing low. The prior wave structure confirms a clean ABC correction, followed by a powerful breakout and a structured range indicative of accumulation, not exhaustion.
The RSI shows persistent bullish divergence, confirming hidden strength, with multiple support bounces confirming demand. The current tight consolidation above former resistance now flipped demand presents a launchpad scenario for a breakout towards major projected upside targets.
Targets to Watch:
🟢 $123,053 – Range breakout threshold, aligns with channel midline and prior local high.
🟢 $134,428 – Measured move from current range and top channel boundary intersection.
🟢 $152,174 – Final leg projection based on macro channel trajectory and bullish wave extension potential.
On the downside, failure to hold $114.5k opens the door to a test of the $105k Strong Support Zone, which aligns with prior structural demand and broader trendline confluence.
💬 Drop your favorite altcoins in the comments for quick analysis , let's catch the next movers before they fly!
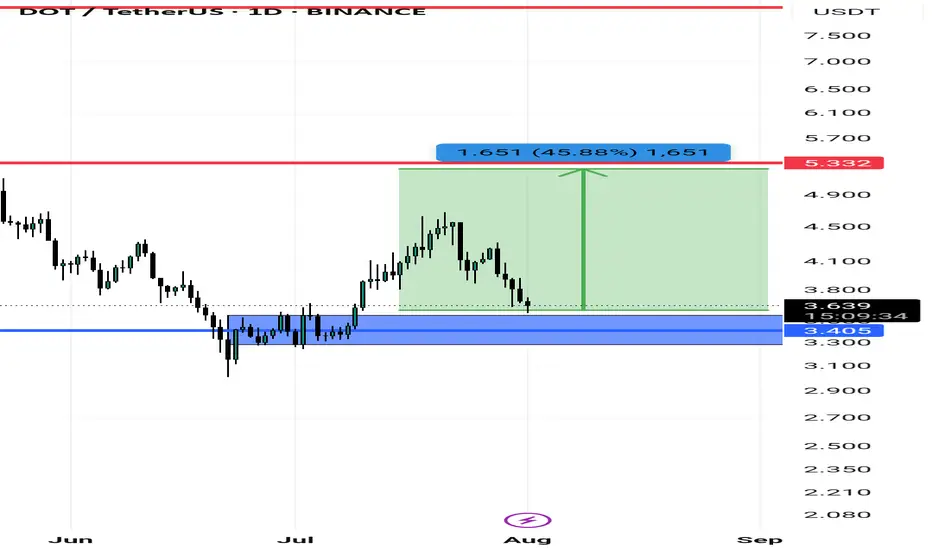
Dot/usdtPolkadot (DOT) cryptocurrency is showing potential for growth from around the $3.40 level.
If the price moves upward, it could potentially reach $5.20, $8, and even $12.
This analysis remains valid as long as the support level at $3.10 holds and no lower low is formed.
Please note: This analysis involves risk. Make sure to apply proper risk management.
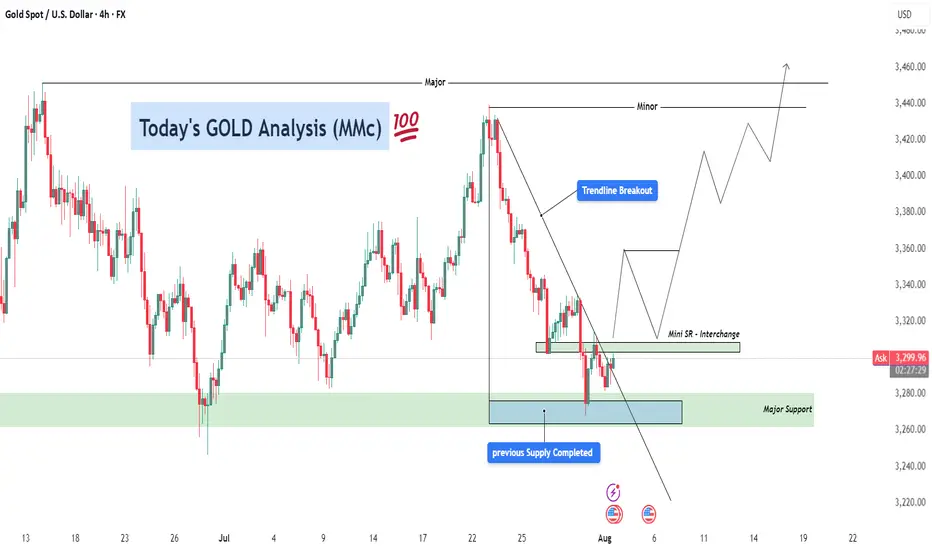
GOLD Analysis – Bullish Recovery Setup After Trendline Breakout ⚙️ Technical Structure Overview
This 4-hour chart of Gold (XAUUSD) illustrates a classic reversal setup developing after a significant correction. Price previously faced strong selling pressure from the 3,470+ zone and declined sharply. However, the recent price action suggests a shift in control from sellers to buyers, signaling a likely medium-term trend reversal or a bullish wave formation.
The key to this setup lies in three confluences:
Completion of a previous supply zone, which no longer holds influence.
Aggressive buyer activity from a major support zone.
A clean break above the descending trendline, which is a common signal that bearish momentum is losing strength.
🔑 Key Levels & Concepts Explained
🟢 1. Major Support Zone (3,260–3,280)
This zone has been tested multiple times and each time, buyers stepped in and prevented further downside. The most recent rejection from this area shows long wicks and bullish engulfing candles, indicating accumulation by institutional players. This is the foundational support that has held the entire corrective structure.
📉 2. Trendline Breakout
The descending trendline connecting swing highs has now been broken to the upside. This is a critical technical signal, especially on the 4H timeframe, as it suggests a potential trend reversal or at least a deep retracement in the opposite direction.
Trendline breakouts typically result in a retest of the trendline or a nearby support-turned-resistance zone (as is the case here with the Mini SR level).
It also implies that supply is weakening, and buyers are ready to push.
🧱 3. Mini Support/Resistance Interchange (~3,300–3,320)
This zone now plays the role of an interchange level—a previous minor resistance that could act as a support after the breakout. This level is crucial for intraday and swing traders because it can offer a low-risk long entry if price retests and confirms it with bullish momentum.
The chart projection suggests a bounce off this mini S/R, followed by successive higher highs and higher lows, forming a new bullish structure.
📈 Forecast Path & Trade Scenario
✅ Bullish Path (Preferred MMC Scenario)
Stage 1: Price retests the 3,300–3,320 zone (Mini S/R).
Stage 2: Buyers step in, leading to a bullish continuation.
Stage 3: Price targets the Minor Resistance (~3,440).
Stage 4: If momentum is sustained, it aims for Major Resistance (~3,470–3,480), completing a clean reversal formation.
This path reflects perfect bullish market structure—a breakout, followed by a retest and rally.
❌ Bearish Invalidation
If the price closes strongly below 3,260, the structure would be invalidated.
This would suggest that the support zone failed, possibly triggering deeper downside toward 3,220–3,200.
🧠 MMC Trader Mindset & Risk Considerations
Don’t Chase: Wait for a confirmed retest of the Mini S/R zone. Let the market come to your entry.
Entry Confirmation: Use candlestick signals like bullish engulfing, pin bars, or inside bars near the Mini S/R.
Volume Consideration: Volume should ideally rise on breakout legs and decline on pullbacks—this confirms healthy bullish structure.
Risk-Reward: With a stop below 3,260 and targets toward 3,470, the RR ratio favors long entries, especially after confirmation.
🔁 Summary Plan for Execution
Entry Zone: 3,300–3,320 (after bullish confirmation)
Stop Loss: Below 3,260 (structure break)
Take Profit 1: 3,440
Take Profit 2: 3,470–3,480
Risk-to-Reward: 1:2+ if planned carefully
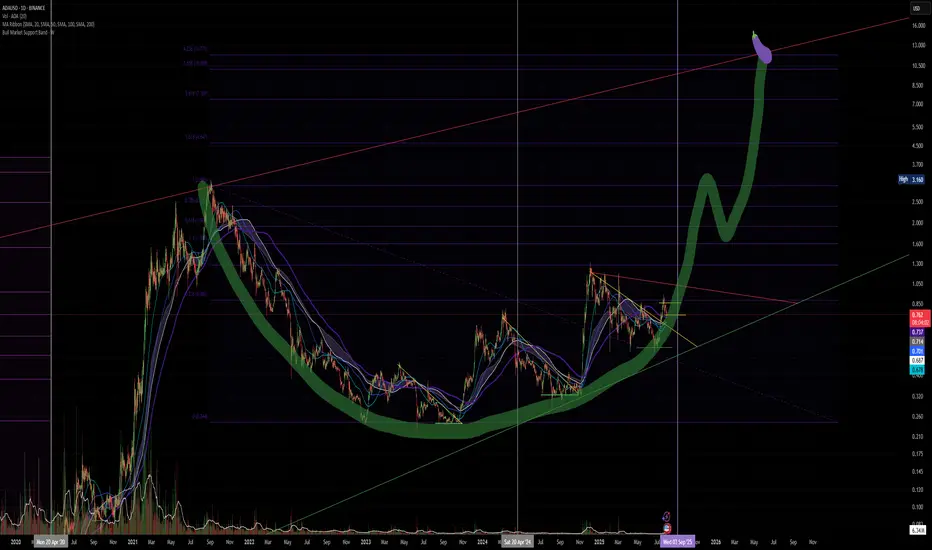
$ADA about to popCRYPTOCAP:ADA currently sits at strong support. and is technically repeating the exact pattern from previous Bull Runs, this does not guarantee repetition but I extrapolate the phrase, the trend is your friend and feel it applies macro scale.
ETF soon
Crypto laws passed
Leios inbound
Glacier drop inbound
CRYPTOCAP:BTC DEFi Inbound
Interoperability expanding
QE inbound
And CRYPTOCAP:ADA IMO is one of the easiest UI and is also among the most cost effective Blockchains to use on a daily basis.
This Chart is a thesis and I like Crayons.