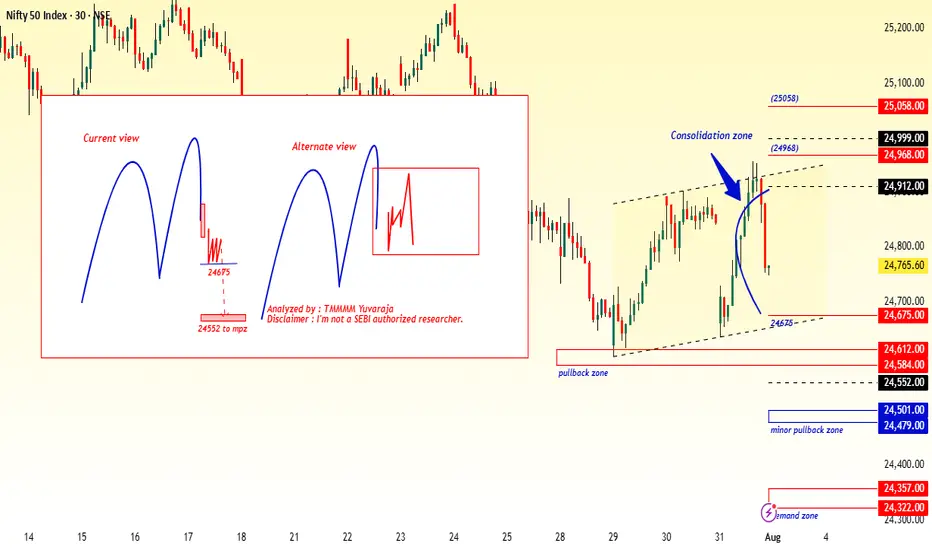
#Nifty directions and levels for August 1st:Good morning, friends! 🌞
Here are the market directions and levels for August 1st:
The global market (based on the Dow Jones) has shown a moderately bearish sentiment,
while the local market continues to display a bearish tone.
Today, Gift Nifty indicates a neutral opening.
What can we expect today?
In the previous session, both Nifty and Bank Nifty experienced high volatility.
However, the closing happened around the middle of the current swing, indicating a possible range-bound market. Until this range is broken, we cannot expect a strong directional move.
If the range breaks, we can follow the breakout direction.
In my side, the structures of Nifty and Bank Nifty appear slightly different. Nifty continues to show bearish sentiment, whereas Bank Nifty is showing signs of a mild bounce back. So, they may counterbalance each other, and if that happens, we may see a neutral closing by the end of the day.
On the other hand, if the market breaks immediate support or resistance with a solid candle or after consolidation, we can expect a directional move in that breakout direction.
Chart Patterns
Will the Canada-US Trade Tension Continue to Impair CAD?Fundamental approach:
- USDCAD advanced this week, supported by broad US dollar strength and renewed trade tensions as the US announced higher tariffs on Canadian imports.
- The pair was further buoyed after the BoC left rates unchanged and signaled caution amid persistent core inflation and ongoing trade negotiations.
- Meanwhile, US labor data indicated that job openings were moderating growth while tariff-related uncertainty weighed on risk sentiment.
- The BoC’s decision to keep its policy rate at 2.75% cited domestic economic resilience and the unpredictable US trade policy outlook.
- At the same time, negotiations between Canada and the US over trade terms remained in an “intense” phase, with additional tariffs entering effect 1 Aug, adding to downside risks for the Canadian economy.
- USDCAD may remain elevated next week as markets monitor follow-through from new tariffs and assess further data on US jobs and Canadian trade. Potential progress or setbacks in Canada-US trade talks and upcoming economic releases could influence direction, while central bank policy signals and risk appetite will remain key catalysts.
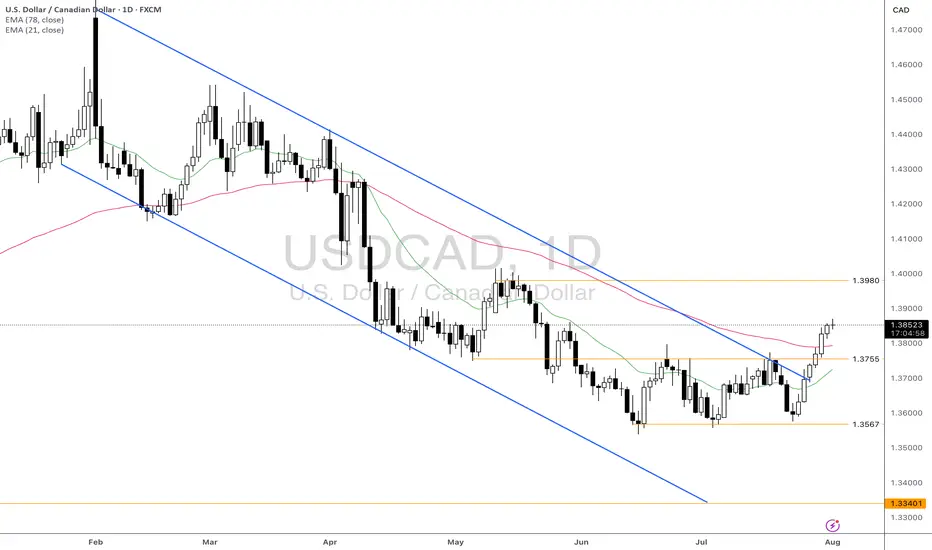
Technical approach:
- USDCAD formed a Triple-bottom pattern at around 1.3567 and bounced up to break the neckline at 1.3755. The price also broke the descending trendline and closed higher than both EMAs, indicating a potential trend reversal.
- If USDCAD remains above the support at 1.3755 and both EMAs, the price may retest the resistance at 1.3980.
- On the contrary, closing below the support at 1.3755 and both EMAs may lead USDCAD to retest the key support at 1.3567.
Analysis by: Dat Tong, Senior Financial Markets Strategist at Exness
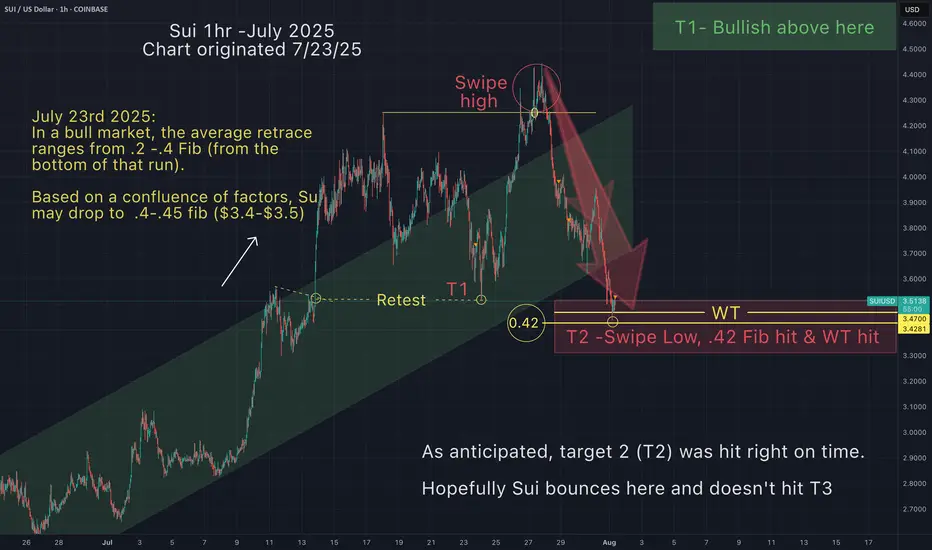
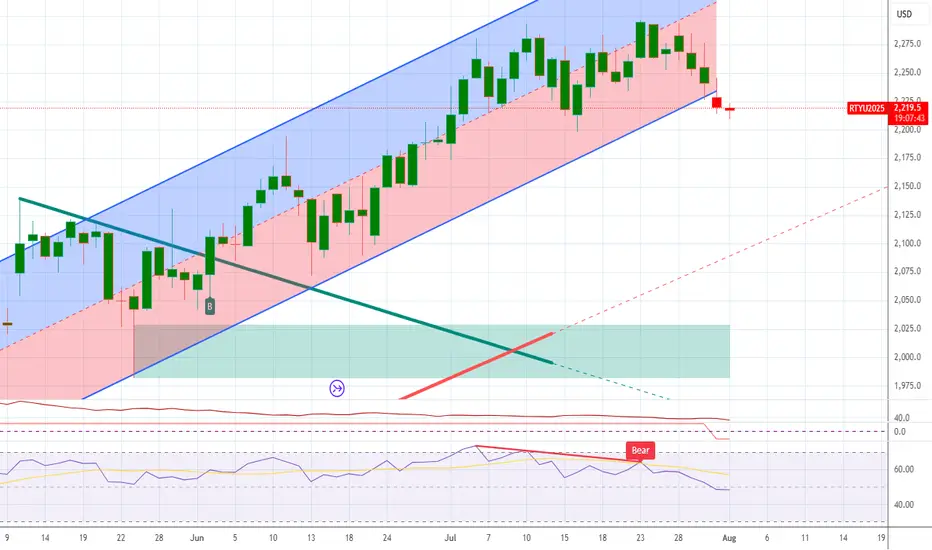
Sui - My T2 target just hit As anticipated, target 2 (T2) was hit right on time (as indicated by red arrow set a few days ago)
Sui dumped after taking the liquidity above the high and I
assumed it would swipe the lows as well...before any chance
of a meaningful move towards the upside.
I hope, Sui doesn't hit my bearish T3
The angle I chose for my arrow, is an average angle of attack.
I love it when a plan comes together.
May the trends be with you!
Natural Gas Bullish Reversal...Are the Lows in?U.S. natural gas inventories increased by 48 billion cubic feet last week to 3,123 Bcf, increasing the surplus over the five-year average.
Consensus / forecast was 37Billion Cubic feet.
Despite a much higher build than expected Nat gas saw positive price action.
This appears to simply be a dead cat bounce before we go lower.
A death cross on the daily chart has occurred. This signal often results in a small bounce before going lower.

Ethereum - The moment of truth!🔬Ethereum ( CRYPTO:ETHUSD ) trades at a key breakout level:
🔎Analysis summary:
Ethereum - after consolidating for the past four years - is once again retesting the previous all time high. And before we will witness another bearish rejection, Ethereum has the chance to finally break out of the long term triangle pattern. It's time for us to start praying.
📝Levels to watch:
$4.000
SwingTraderPhil
SwingTrading.Simplified. | Investing.Simplified. | #LONGTERMVISION

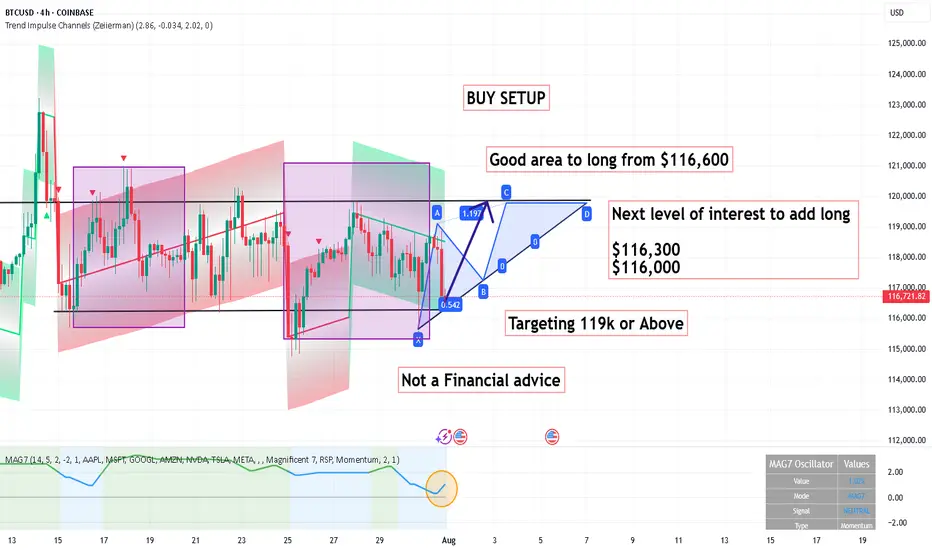
BUY SETUP ,Good area to long from $116,600BUY SETUP
Good area to long from $116,600
Next level of interest to add long
$116,300
$116,000
Targeting 119k or Above
Its not a Financial advice
OEX /SPX Bullish wave 5 pattern crossroads The chart posted is the sp 100 I am posting it as we are now at the crossroad for bull or bear count .We have rallied to .786 as I will show and have a wave a x 1.27 = c at the .786 High But if we break above 5922 in the Cash SP 500 There is NOTHING to stop it from reaching a target of 3005 in the OEX where wave A up or wave 1 x 1.618 = wave C Top or wave 3 in the SP 500 WAVE A or WAVE 1 up 5481 - 4835 = 646 x 1.618 =1045 plus wave B low or wave 2 5102low= 5102plus 1045 =6147.22 The exact high . This is the reason I took the loss and moved LONG .Best of trades WAVETIMER

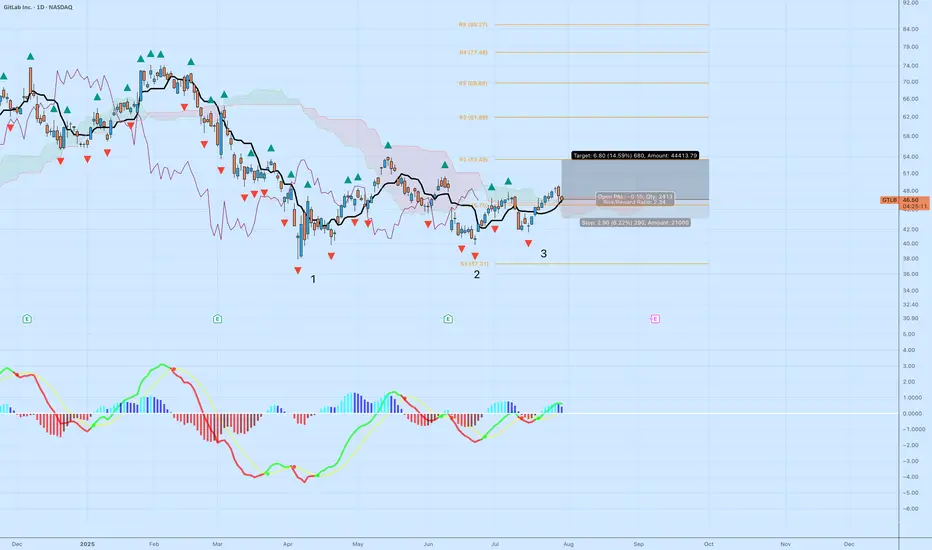
GTLB | Triple Bottom ReversalGitLab (GTLB) is setting up for a potential trend reversal following a textbook triple bottom pattern and a clean breakout above the cloud. Here's the technical breakdown:
Why This Setup Matters
Triple Bottom Pattern: Reversal structure is clear with three defined lows at ~$38, ~$40, and ~$41. The most recent leg up confirms buyers defending that zone.
Ichimoku Cloud: Price has broken above the Kumo with bullish Tenkan-Kijun cross. The leading span A is pointing up, and the cloud ahead is flat and thin — ideal conditions for continuation.
MACD Momentum: Histogram flipped positive again with green signal line crossover — a momentum shift from accumulation to breakout phase.
Trade Parameters
Entry: $46.53
Stop: $43.63 (below Tenkan and the neckline zone)
Target: $53.33
Risk:Reward Ratio: 2.34
Projected Move: +14.59%
Additional Confluence
Daily closes above cloud show growing strength from buyers.
Each bottom was followed by increasing MACD strength — a bullish divergence over time.
Pivot zone at R1 ($53.49) aligns with the price target, adding structure to the exit plan.
Risk Notes
Failure to hold $46 with volume could invalidate the breakout — watch for a retest.
If price closes below Tenkan, reevaluate the setup for weakness.
Volume confirmation needed on the next daily candle for strong conviction.
This is a technical breakout aligned with pattern recognition and trend metrics. Ideal for swing setups with controlled downside.
Let`s play some pokkerThere`s a pattern ;) So why not..
There`s room to grow min till pre-earnings
Trade safe!

Dow Jones Triple Top & Critical Trendline Break - Buy The Dip?Potential Tripple Top formation spotted on the Dow. This would represent a full fibonacci retracement, which leads me to believe a 38.2 retest is likely. If this 23.6 level can hold support and price does not close below the fib band (orange channel), then the bullish continuation to new all time highs can still happen in Q3/Q4 of this year. The clear trendline break dating back to April is very concerning (white line), leading me to believe more downside in the coming weeks.
Let me know what you think in the comments!
Thanks
GOLD (XAUUSD) -Monthly Analysis & Trading Plan (Aug 2025)GOLD (XAUUSD) -Monthly Analysis & Trading Plan (Aug 2025)
Title: XAUUSD: Correction in Progress, Patience is Key for the Next Move
Chart: XAUUSD Monthly (1M)
Analysis Type: ICT/SMC, Price Action, & Moving Average
Summary:
After a historic and powerful bull run that saw Gold (XAUUSD) breach all-time highs in the first half of 2025, the market has entered a significant corrective phase. The massive red candle in June signaled a strong reversal of momentum, and the current July candle confirms that sellers remain in control, albeit with less intensity. This is a critical juncture for long-term traders, and a strategic approach is required.
Key Observations & Analysis
1. **Price Action & Market Structure:**
The move from late 2024 through May 2025 was a textbook "impulsive leg." The sharp reversal in June 2025, with a powerful bearish candle, likely acted as a **liquidity grab** or a **high-volume distribution event**, trapping late buyers. The market is now in a clear **break in market structure (BOS)** to the downside on this long-term timeframe, suggesting the correction is not over.
2. **ICT/SMC Concepts:**
* **Imbalance/Fair Value Gap (FVG):** The rapid bullish move created significant imbalances on the monthly chart. Price often returns to fill these gaps. The current correction is likely heading to fill or test these inefficiencies.
* **Order Block (OB):** The massive bullish move in late 2024/early 2025 likely created a strong bullish order block. The current sell-off is heading toward this potential institutional demand zone.
* **Liquidity:** The lows from late 2024 and early 2025 will be key liquidity pools. Smart money will likely be targeting these areas for a potential reversal or accumulation.
3. **Moving Average Analysis (MMA):**
* The price is currently trading above both the purple and yellow moving averages, which are still pointing upward. This confirms the long-term trend remains bullish, and the current move is a correction within that trend.
* The **purple moving average** is a key support level to watch. A test of this level would be a high-probability event, and its reaction will be crucial for the next major move.
Suggested Entry & Exit Levels
1. Aggressive Entry (Short)
Rationale
The bearish momentum, though slowing, is still the dominant force. An aggressive trader could look for a continuation of the short-term bearish trend.
Entry/b]
A short entry could be considered on a pullback to the recent highs around **$3,400 - $3,500** if a strong bearish candlestick pattern forms on a lower timeframe (e.g., weekly or daily).
Stop Loss
A tight stop-loss placed just above the recent high, for example, **$3,600**. This is a high-risk entry, so position sizing should be small.
Target
The first major target would be the **moving average support level**, roughly in the **$3,000 - $3,100** zone. The ultimate target for a full correction would be the order block from late 2024, around **$2,800**.
2. Conservative Entry (Long)
Rationale
The long-term trend is still bullish. The current move is a correction. The most prudent approach is to wait for a high-probability long entry at a key support level.
Entry/b]
Wait for price to reach the **purple moving average support zone (around $3,000 - $3,100)**. Look for a clear reversal signal on this level, such as a large bullish "pin bar" or "engulfing candle" on the monthly or weekly chart. This would be a high-probability demand zone for a reversal.
Stop Loss
A stop-loss should be placed below this key support level, perhaps around **$2,850 - $2,900**, giving the trade room to breathe.
Target
The first target for a new bullish leg would be the New swing high around **$3,800**. The ultimate long-term target would be a new all-time high above **$4,000**.
Conclusion
The Gold market is in a crucial phase. The bullish party from earlier in 2025 is over for now, and a healthy correction is underway. **The most logical and safe approach is to wait for the market to complete its corrective move.** Do not attempt to catch a falling knife. Instead, be patient and wait for price to reach a key institutional demand zone (our moving average support or the late 2024 order block) and show a clear sign of reversal. This will present a high-probability, low-risk long entry for the next impulsive move up.
Disclaimer
This is not financial advice. Please perform your own due diligence and risk management. Trading involves a significant risk of loss.

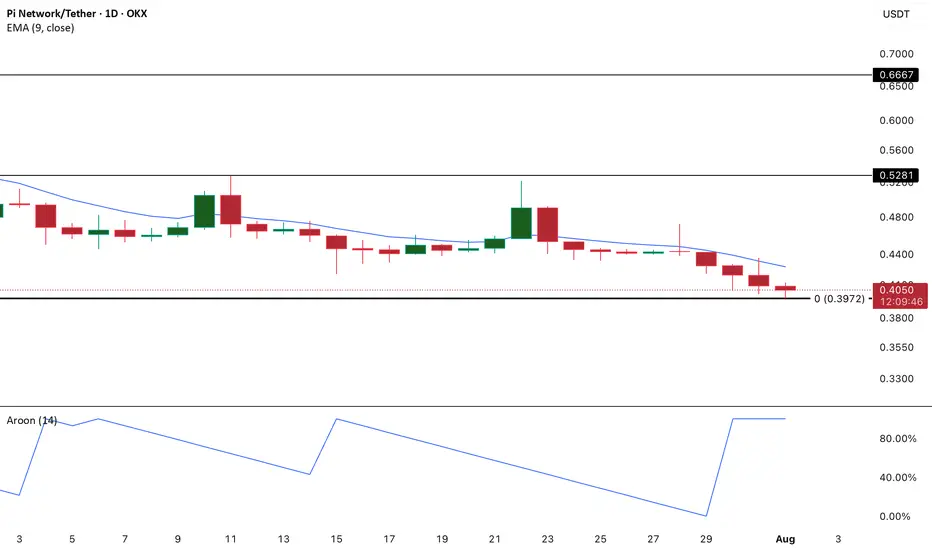
PI in Full Bear Control as Aroon Down Hits 100%PI continues to flash warning signs as technical indicators lean heavily bearish. Most notably, the Aroon Down Line on the daily chart has surged to a reading of 100%.
For context, the Aroon indicator is designed to identify the strength and duration of a trend, and when the Down Line reaches the 100% mark, it typically signals that a recent low was recorded very recently — often within the past day or two.
This kind of reading reflects an aggressive downtrend, where bearish momentum dominates and sellers are in full control.
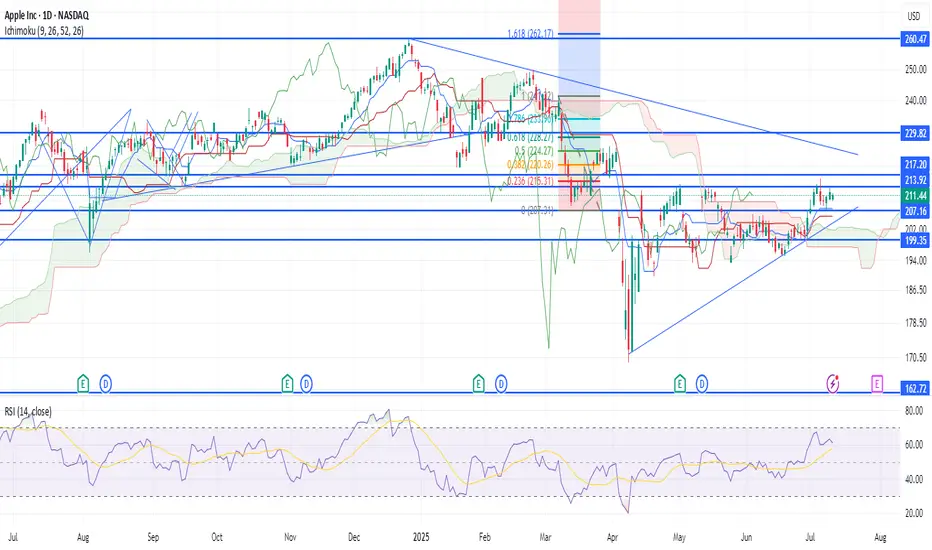
AAPL BUY 1st target $223AAPL is forming a wedge and been lagging for 2 years. I was expecting $182 but we never saw that level, after weeks of $200 range consolidation it's clear this is basing, first target of resistance is $223 then we could be off to the races. I would expect to see this as soon as next week provided #donthecon can stop bullying American companies long enough to focus on important things
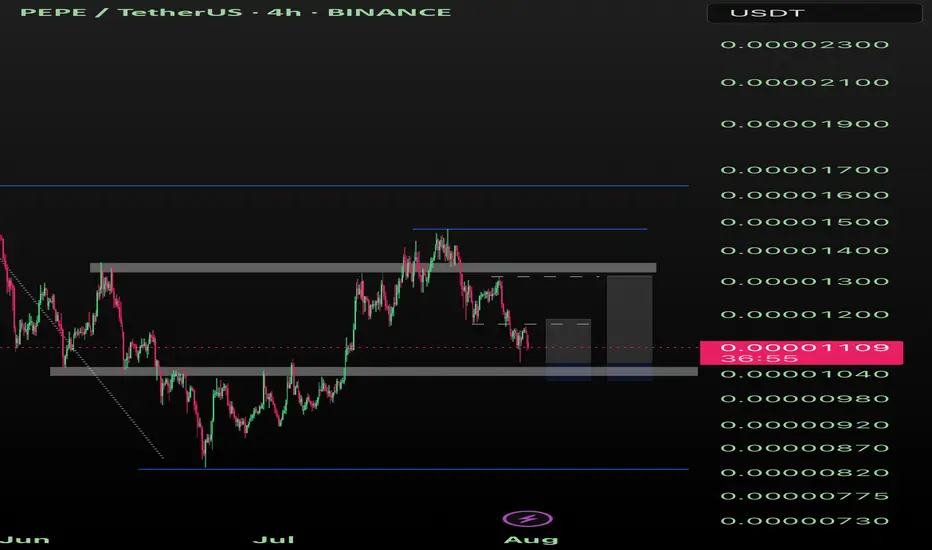
Pepe 10% or 25% Pepe could see a 10% - 25% pump after one more sweep to 1040 or even a hold for the week over 1040, for a trade.
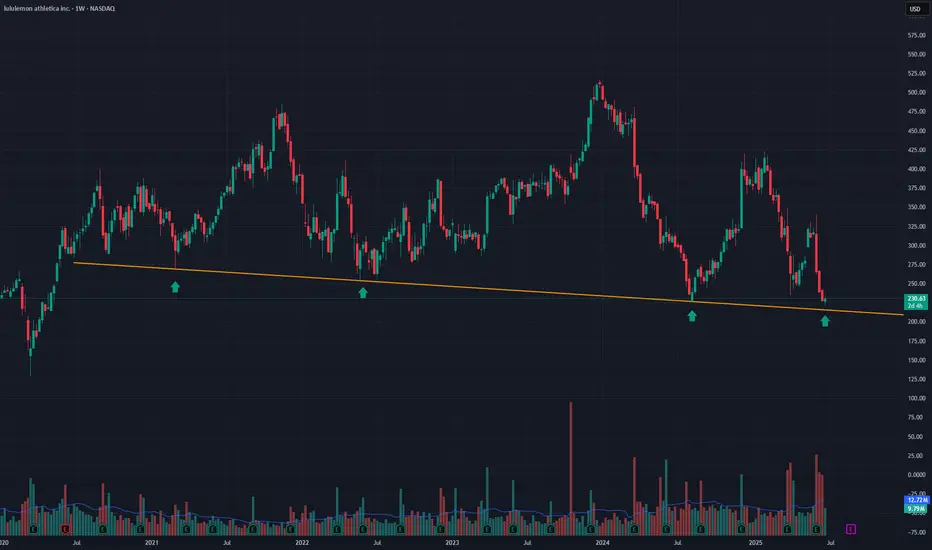
LULU into supportLulu is on sale as its just come into an area it has only sold at, 3 other times out of the past 5 years. As you can see by the Orange line, LULU has been holding this area of support for the past 5 years. This is a great buying opportunity. A close below the line on a weekly basis would stop out of the trade
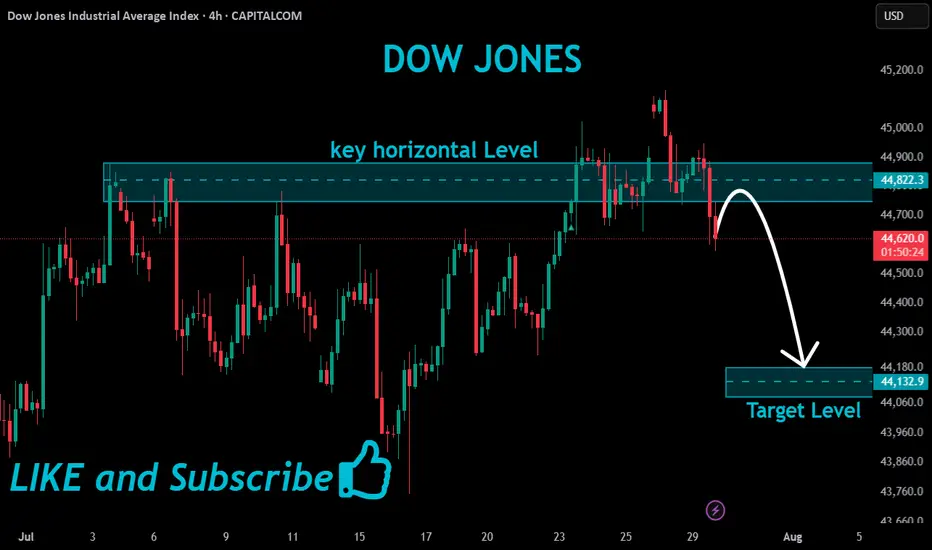
US30 Bearish Breakout!
HI,Traders !
#US30 made a bearish
Breakout of the key horizontal
Level of 44822.3which also
Seems to have been a neckline
Of the small H&S pattern so
We are locally bearish biased
And we will be expecting a
Further bearish move down !
Comment and subscribe to help us grow !
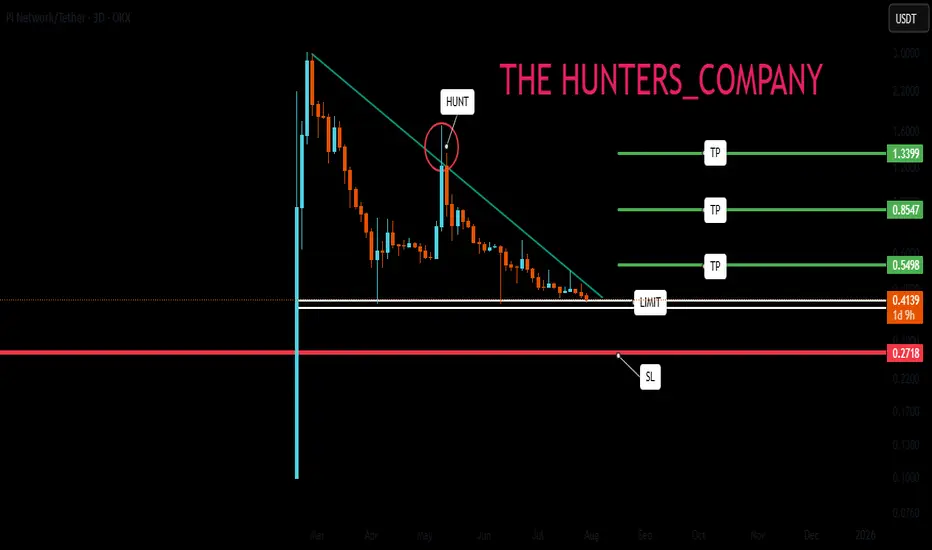
PI NETWORK : Will it finally be pumped?Hello friends🙌
👀According to the decline we had, you can see that the price has reached an important area and has formed a floor in this area. Considering the classic ego that is forming on support, you can enter the trade by breaking the resistance, of course, by managing risk and capital and moving with it to the specified goals.
🔥Follow us for more signals🔥
*Trade safely with us*
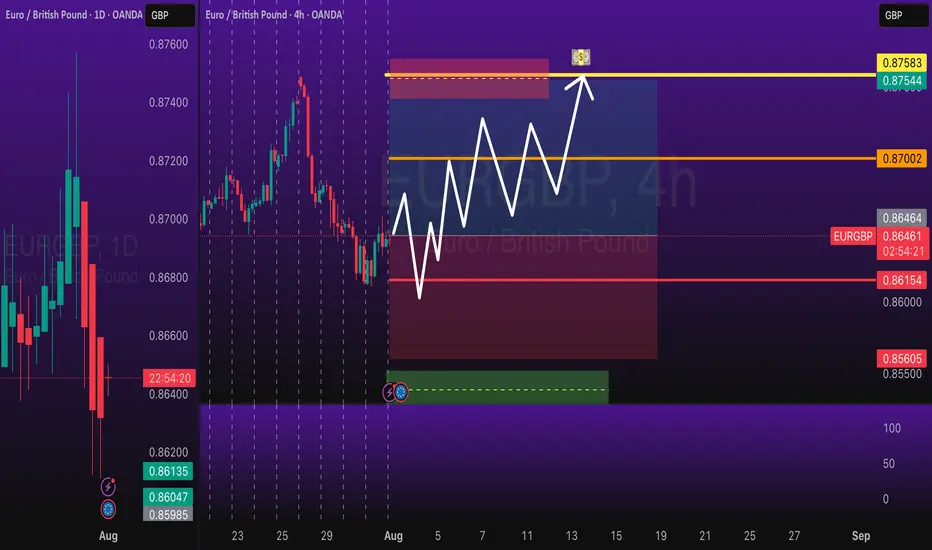
EURGBP Long Swing Trade OANDA:EURGBP Long trade, with my back testing of this strategy, it hits multiple possible take profits, manage your position accordingly.
This is good trade, don't overload your risk like greedy, be disciplined trader, this is good trade.
Use proper risk management
Looks like good trade.
Lets monitor.
Use proper risk management.
Disclaimer: only idea, not advice
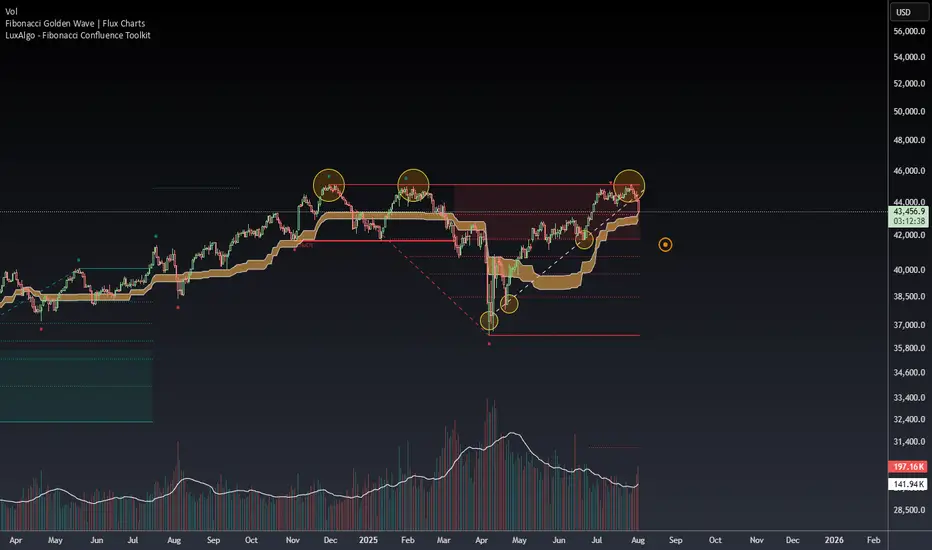
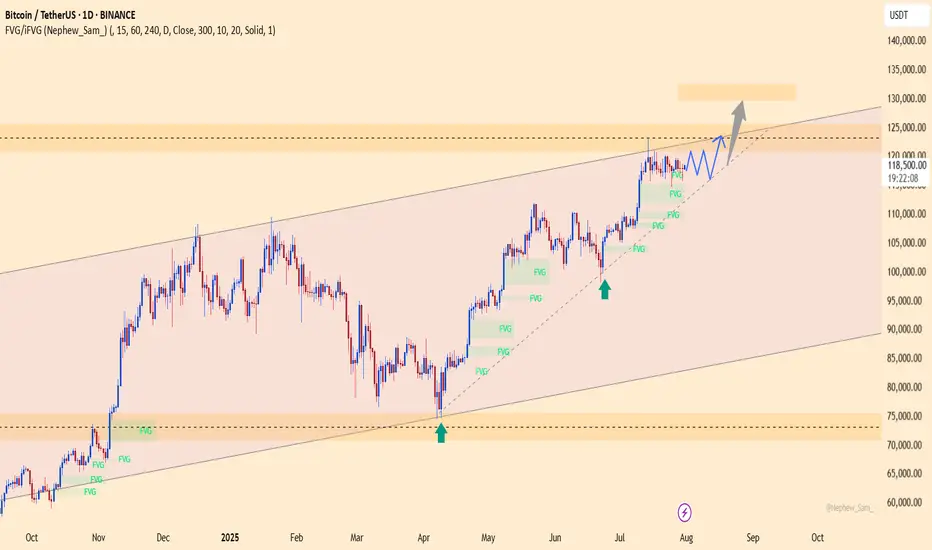
BTC defies expectations –Absorbs 9 billion USD, aiming for 130K?BTCUSDT maintains its bullish momentum despite Galaxy Digital offloading 80,000 BTC (worth ~9 billion USD). Price only saw a slight dip before bouncing back quickly, signaling strong demand and a more mature market sentiment.
Citi analysts point to ETF inflows and retail participation as the primary drivers of BTC’s rally, even as investors remain cautious ahead of the Fed’s rate decision.
On the daily chart, BTC continues to trade within an ascending channel, with the 116,200 zone acting as a potential buy area on any pullback. The next target is set at 129,500 USDT, aligning with the channel’s upper boundary and technical resistance.
Suggested strategy: Look to buy near 116,200–117,000. Target 129,500. Stop-loss below 115,000.
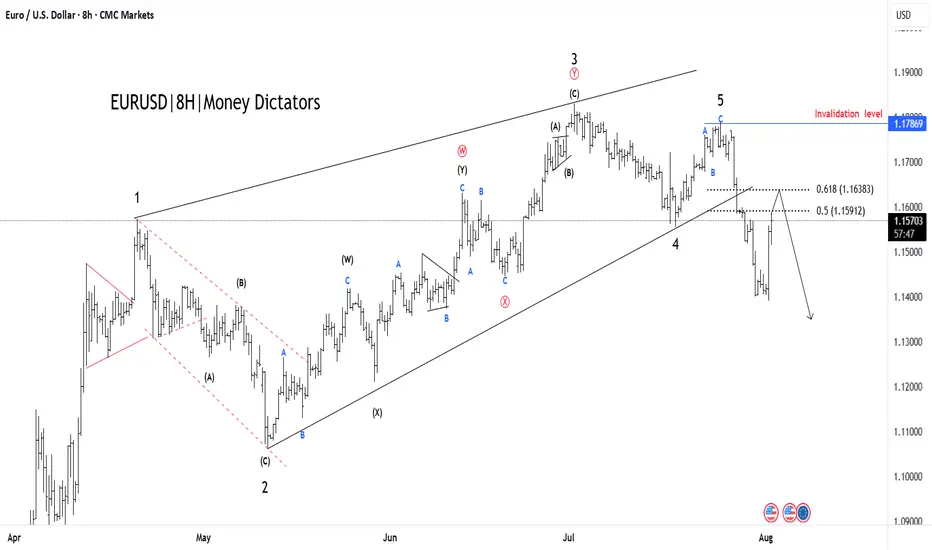
EUR/USD Elliott Wave Count Signals Downside TargetsThe EUR/USD chart is displaying a completed 5-wave Elliott impulse structure, suggesting the potential start of a larger corrective move to the downside. Wave 5 appears to have finished after a classic ending diagonal pattern, with price now breaking below the wave 4 support trendline — a strong confirmation of trend exhaustion.
Currently, price is retracing upward towards the 0.5–0.618 Fibonacci retracement zone of the last impulsive leg, around 1.15912–1.16383, which may serve as the final rejection zone for bears to re-enter. This area aligns perfectly with prior support-turned-resistance and is considered the potential reversal pocket.
If price holds below the 1.17869 invalidation level, the structure supports the beginning of an ABC correction or a larger bearish impulse.
Target 1 (T1): 1.14800
Target 2 (T2): 1.13915
Stop Loss (SL): 1.17869
This scenario remains valid as long as the price does not break above 1.17869. A clean break and close above this level would invalidate the bearish setup and suggest a possible wave extension.
Cardano (ADA): Seeing 1:10 Risk & Rewards Trading OpportunityCardano looks strong, still being above the major support area and showing the buy-side dominance on smaller timeframes. The key point here is the 200 EMA on the 1D timeframe!
More in-depth info is in the video—enjoy!
Swallow Academy

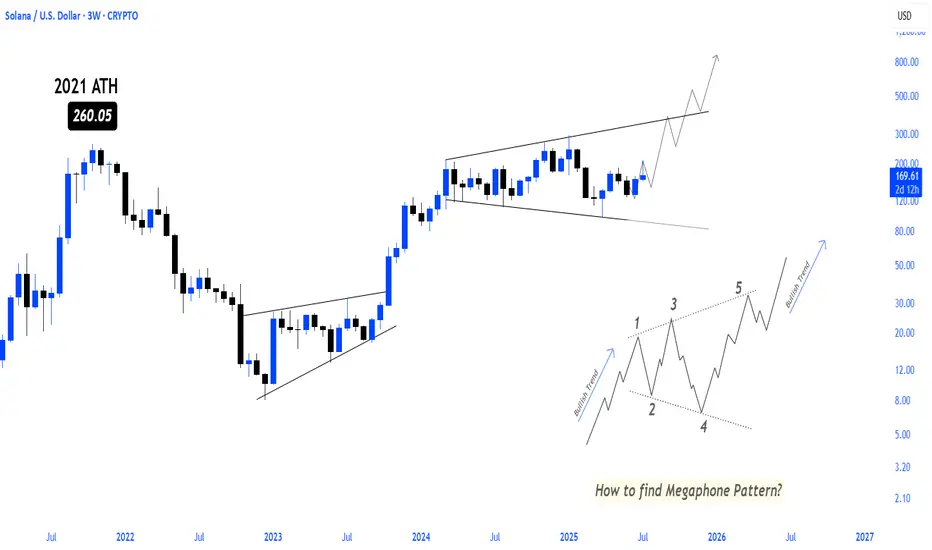
SOLANA BULLISH MEGAPHONE PATTERN LOADING! solana continues to move step by step towards higher levels within the bullish megaphone pattern, which will make movements towards ATH and more inevitable in the coming period