Ethereum's Current Consolidation: Will It Move Up or Down...?BINANCE:ETHUSDT Ethereum Consolidating Between $1820 and $1950: Will It Break Upside or Downside..?
Ethereum has been trading in a consolidation range between the $1820 and $1950 levels since last week. As the price oscillates within this range, market participants eagerly await a breakout in either direction. The big question is: will Ethereum break upwards or downwards? Let's analyze two potential scenarios based on key price levels and liquidation points.
Scenario 1: Upside Breakout and Potential Rally
One key level to watch is the $1950 resistance. Ethereum has struggled to break past this level, but if the price manages to break above and sustain above $1950, there is a significant upside potential.
Why? At the $1994 level, there is approximately $1.16 billion in liquidations waiting to happen. If Ethereum pushes past the $1950 resistance and approaches this $1994 mark, the surge of liquidations could provide the momentum for a continued rally.
In this scenario, a good strategy would be to wait for a retest of the $1950 level as support, confirming the breakout. If the price holds above this level, it may be a good time to enter a long position, riding the potential bullish move.
Scenario 2: Downside Breakout and Further Decline
On the other hand, if Ethereum fails to hold above the $1820 support and breaks below this level, a downside move could be on the horizon. The next significant support lies around the $1785 level, where around $900 million in liquidations are waiting.
A break below $1820 could trigger a sharp decline toward this liquidation point at $1785. In this case, entering a short position after a retest of the $1820 resistance-turned-support could offer a solid opportunity for traders looking to capitalize on the downtrend.
Conclusion
Ethereum’s consolidation between the $1820 and $1950 levels presents two distinct scenarios. If the price breaks above $1950 and sustains that level, there is upside potential, with liquidation at $1994 offering a bullish catalyst. However, a break below $1820 could open the door for further downside, with liquidations at $1785 triggering a possible downtrend.
Traders should keep a close eye on these levels for confirmation and act accordingly based on the direction Ethereum takes in the coming days.
Chartpattren

GOLD TRADING POINT UPDATE >READ THE CHPTAIAN Buddy'S dear friend 👋
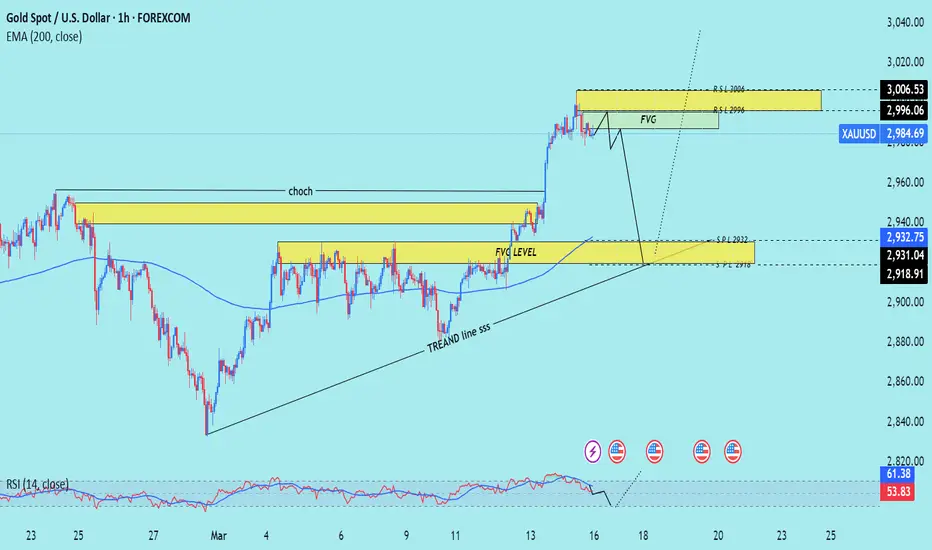
SMC Trading Signals Update 🗾🗺️ Gold Traders SMC-Trading Point update you on New technical analysis setup for Gold 🪙 list week profitable profomans reached target point 2961 ) New technical analysis setup for Gold 🪙 a short trend 📉 analysis setup. Guys 🤝 Gold 🪙 1 Time Frame 🪟 patterns chart 📉. Looking for selling zone ☺️ 🤝 FVG level 3006$ 2996$ rejected point below 👇 ⬇️ target point 2832 - 2818. ) again back 🔙 that entry buying said. Update you next analysis Guys 🤝 now follow it' good luck 💯
Key Resistance level 2996+ 3006
Key Support level 2832 - 2818
Mr SMC Trading point
Pales Support boost 🚀 analysis follow)
BTCUSDT TRADING POINT UPDATE >READ THE CHPTAIANBuddy'S dear friend
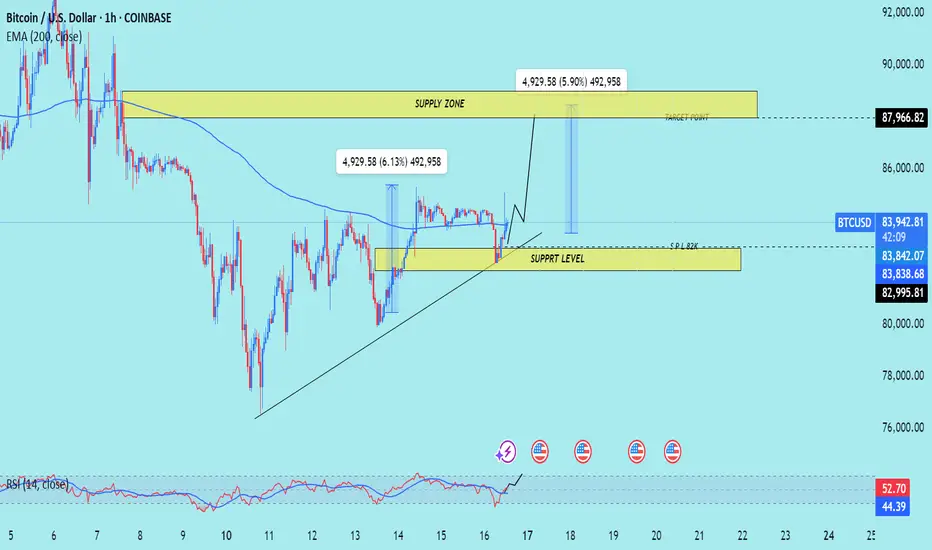
SMC Trading Signals Update 🗾🗺️ crypto Traders SMC-Trading Point update you on New technical analysis setup for crypto BTC USDT. ) list time post signals 💯 reached target point ) 👉 New technical analysis setup BTC USDT looking for bullish trend 📈 FVG level support level. 83k 82k support level 87k 88k resistance level ). Guys 🤝 good luck 💯💯
Key Resistance level 87k + 88k
Key Support level 83k - 82kà
Mr SMC Trading point
Pales support boost 🚀 analysis follow)
EUROUSD TRADING PINT UPDATE >READ THE CHPATIAN Buddy'S dear friend
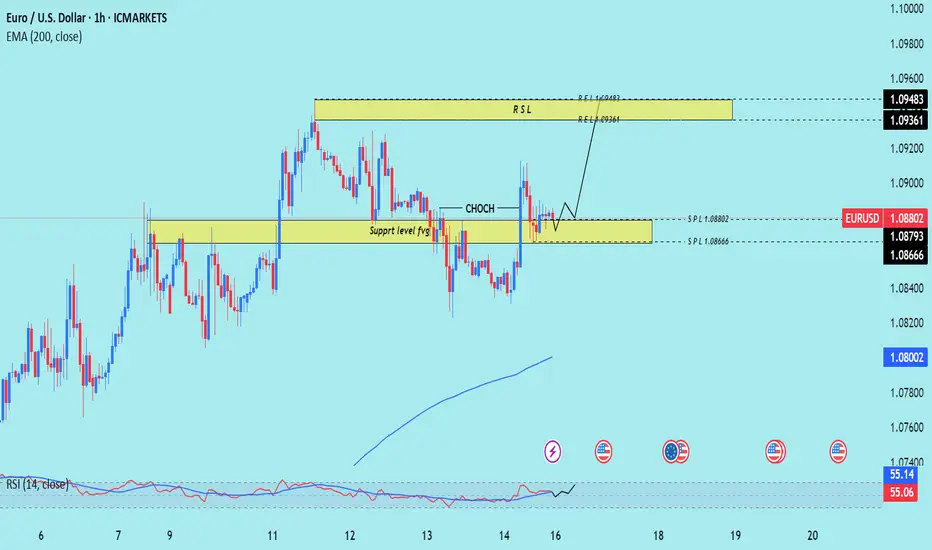
SMC Trading Signals Update 🗾🗺️ SMC-Trading Point update you on New technical analysis setup for Euro USD) Euro USD) Technical patterns choch looking for Bullish patterns support level 1.0866 Resistance level 1.09361 ) good luck guys 🤝
Key Resistance level 1.09361+ 1.09483
Key Support level 1.08802 - 1.08666
Mr SMC Trading point
Pales support boost 🚀 analysis follow)
GOLD TRADING PONT UPDATE >READ THE CHAPTIANBuddy'S dear friend 👋.
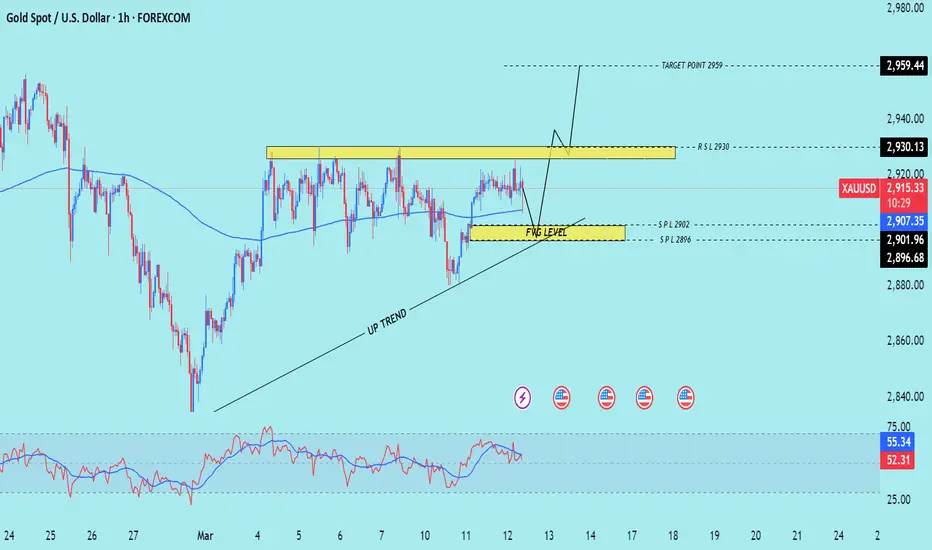
SMC Trading Signals Update 🗾🗺️ Gold Traders SMC-Trading Point update you on New technical analysis setup for Gold 🪙 Gold Traders Gold 1H time. Look 👀 first take FVG level that take entry buying said target point 2959 New ATH wait for FVG level good luck 🤞
Key Resistance level 2930 + 2959
Key Support level 2909 - 2902 - 2896
Mr SMC Trading point
Pales support boost 🚀 analysis follow)
GOLD VIEW 3H READ THE CAPTAINHello 👋 gold traders
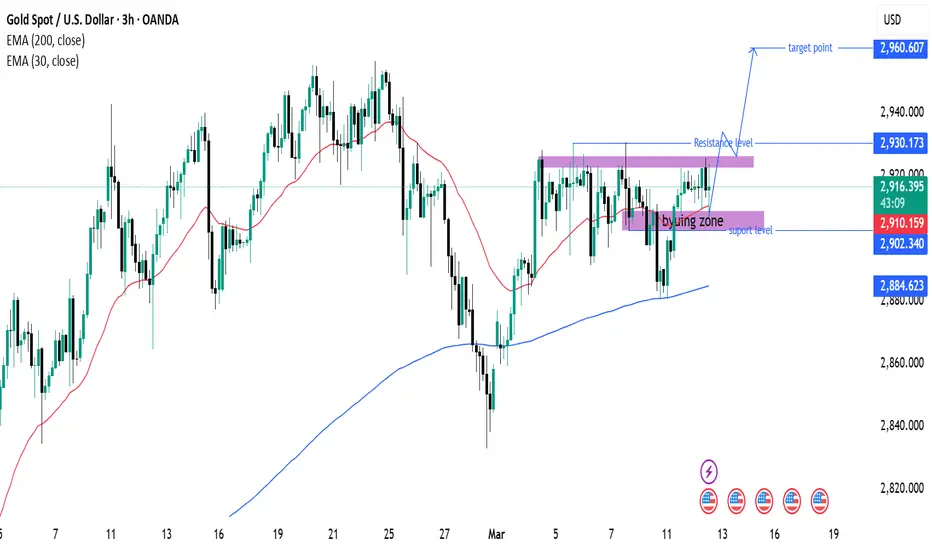
3-hour timeframe of Gold Spot (XAU/USD) with technical analysis levels and moving averages. Here’s a breakdown of the key points:
Key Observations:
1. Support & Resistance Levels:
Support Level: Around 2,909.870 - 2,902.340 (marked as the buying zone).
Resistance Level: 2,930.173.
Target Point: 2,960.607.
2. Exponential Moving Averages (EMAs):
30 EMA (Red Line): 2,909.870 (Short-term trend).
200 EMA (Blue Line): 2,884.578 (Long-term trend, acting as strong support).
3. Price Action:
The price is currently in a consolidation phase around the resistance zone.
If the price breaks above 2,930, we might see a bullish move toward the target at 2,960.
If the price fails to break resistance, a pullback to the buying zone (support level at 2,909-2,902) is possible.
Trading Strategy Ideas:
Bullish Scenario (Breakout Above 2,930): Look for long positions targeting 2,960.
Bearish Scenario (Rejection at Resistance): A retest of the buying zone (2,909 - 2,902) before another push higher.
GOLD TRADING POINT UPDATE > READ THE CHAPTIANBuddy'S dear friend 👋
SMC Trading Signals Update 🗾🗺️ Gold Traders SMC-Trading Point update you on New technical analysis setup for Gold 🪙 Gold Traders Gold 3 time frame 🖼️ looking FVG rejected point below 👇 2929+ 29209. Technical patterns). Weekly basis setup. )
Key Resistance level 2929 + 2957
Key Support level 2891 - 2848
2832
Mr SMC Trading point
Pales support boost 🚀 analysis follow)

BTCUSDT TRADING POINT UPDATE >READ THE CHAPTIAN Buddy's dear friend 👋
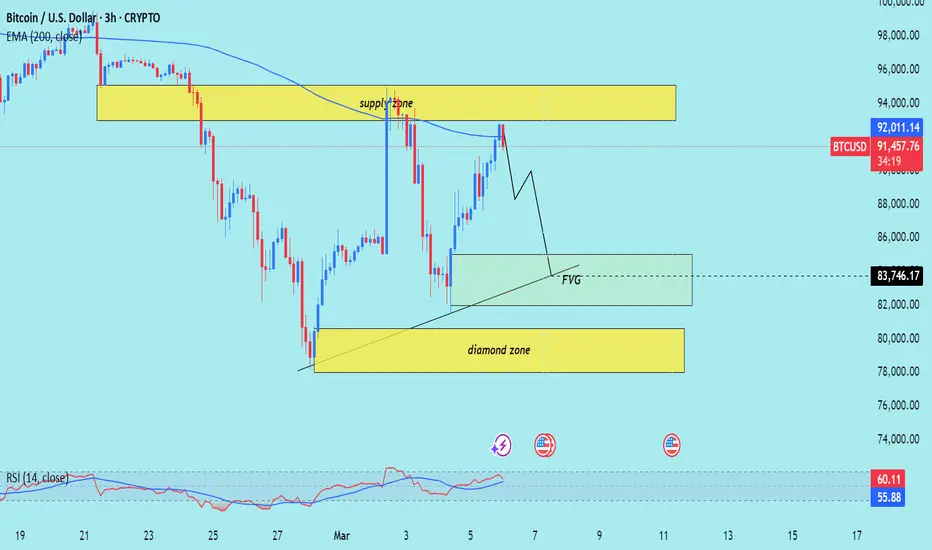
SMC Trading Signals Update 🗾🗺️ crypto Traders SMC-Trading Point update you on New technical analysis setup for crypto BTC USDT BTC still rejected supply zone. Again. Back Short Trade. FVG level) 83k I'm want to Sell now short trend 📈
Key Resistance level 93k + 95k
Key Support level 85k - 83k
Mr SMC Trading point
Pales support boost 🚀 analysis follow)
$GOOGL Rising bearish wedge with declining volume; $165 belowNASDAQ:GOOGL here looks weak to me trying to reclaim it's support of $175-$180. This is on my watchlist for a short term short, if this name tanks back into the $150's I will load everything I got for the long side. I see this name in a downside trend currently in a rising wedge with declining volume, buyers can't hold it up much longer. It's retested that support on 3 or more daily candles and hasn't busted through. I expect this name to drop into a support zone of $160-$165. I will look to enter puts off a retest of $176-$178 area keeping the stops tight.
WSL.

GOLD TRADING POINT UPDATE >READ THE CHATPIAN Buddy'S dear friend 👋
SMC Trading Signals Update 🗾🗺️ Gold Traders SMC-Trading Point update you on New technical analysis setup for Gold traders SMC trading point ☝️ list time post signals 🚀 Hit sucksfully My target point 2920 ) Now Gold rejected point below 👇 supply zone 2892- 2875 FVG level up trand My target 🎯 point 2961 long Trade 🤝. First take short trend 📈 And buying it)
Key Resistance level 2915 + 2920 + 2956+ 2961
Key Support level 2892 - 2875
Mr SMC Trading point
Pales support boost 🚀 analysis follow)
GOLD TRADING POINT UPDTAE >READ THE CHAPTIAN Buddy'S dear friend 👋
SMC Trading Signals Update 🗾🗺️ Gold Traders SMC-Trading Point update you on New technical analysis setup for Gold 🪙 🪙 Gold Traders Gold Ready for again take New bos). Choch) FVG level up trand) Gold still going to bullish trend 🚀 I'm want buying it target point 2945 + 2956 Technical patterns.
Key Resistance level 2945 + 2956
Key Support level 2911- 2900
Mr SMC Trading point
Pales support boost 🚀 analysis follow)

GOLD TRADING POINT UPDATE > READ THE CHAPTIAN Buddy'S dear friend 👋
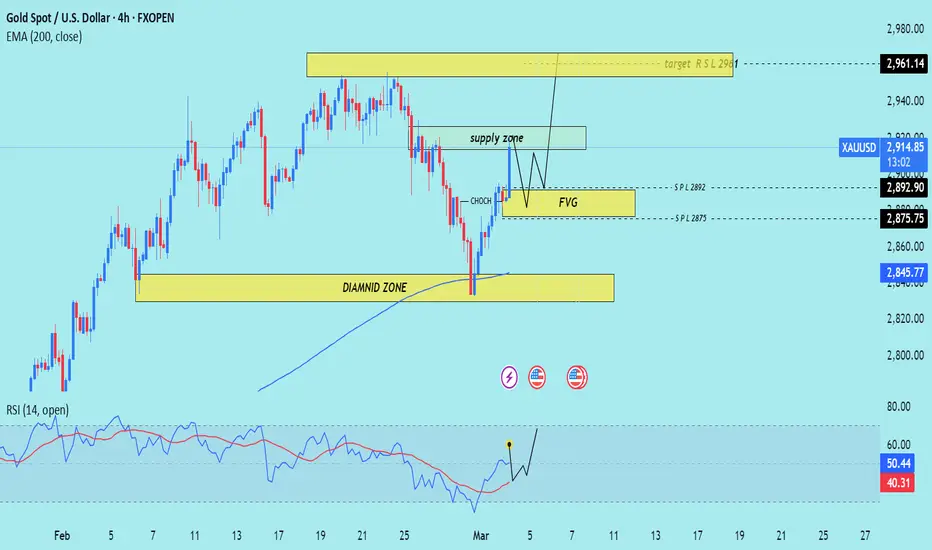
SMC Trading Signals Update 🗾🗺 Gold Traders SMC-Trading Point update you on New technical analysis setup for Gold 🪙 💥 Gold Traders Gold 4 Time Frame. Tast diamond zone support level. Close above EMA ) indicator. ) SMC Trading point expect it. Bull 🐂 trend 📈 supply zone 2920 2930. This levels. Expect it selling Arya )
Key Resistance level 2920 + 2930
Key Support level 2852 - 2834
Mr SMC Trading point
Pales support boost 🚀 analysis follow)

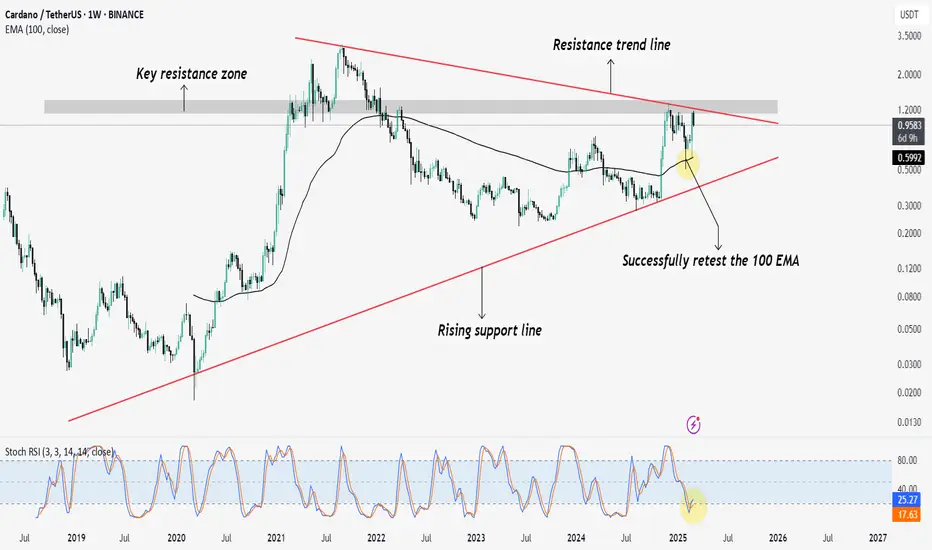
ADA/USDT at Decision Point – Major Move Incoming!ADA/USDT is testing a major resistance zone after retesting the 100 EMA and bouncing from the rising support line. The price remains in a long-term symmetrical triangle, with the resistance trendline as a key breakout level.
The Stochastic RSI is recovering from oversold levels, indicating potential bullish momentum. A breakout above resistance could trigger a strong uptrend continuation, while rejection may lead to a pullback toward support.
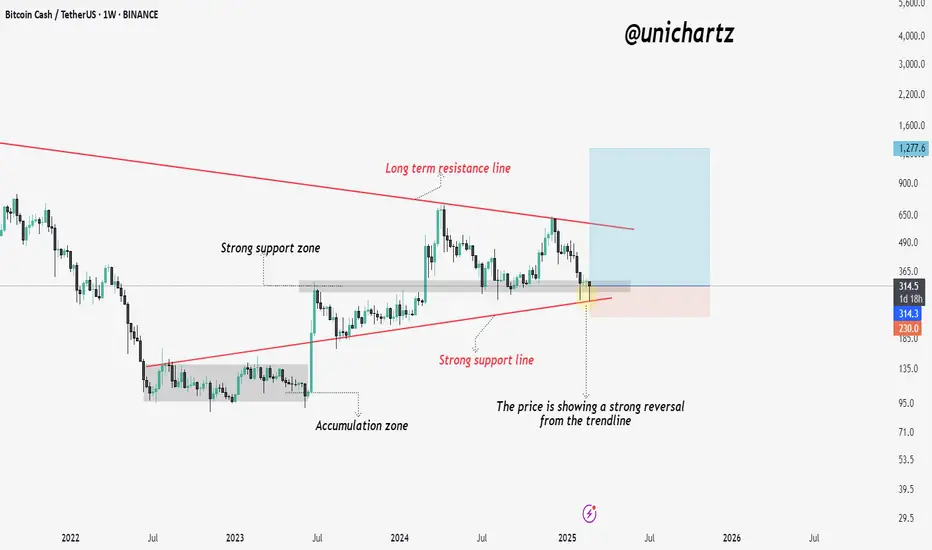
Bitcoin Cash at Critical Trendline – Next Big Move?Bitcoin Cash (BCH/USDT) is currently showing signs of a strong reversal after testing a key support zone and the ascending trendline. This level has acted as critical support in previous price cycles, making it an important area to watch.
The price has rebounded from the strong support line, which aligns with the accumulation zone from early 2023. Additionally, BCH remains within a long-term descending channel, with the upper resistance line acting as a ceiling for previous bullish moves.
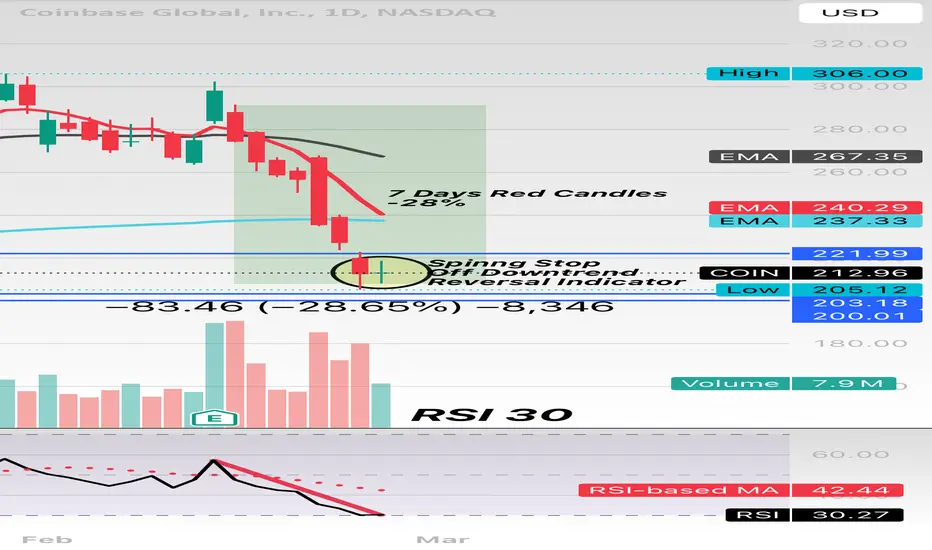
$COIN Spinning Stop Candle in Downtrend; ReversalWe have 7 days of straight beating, assault, slaughter and murder. Do I think this thing reverses 10 fold? No but do I expect a bounce into the mid 220’s? Yes. RSI is relatively low (sold) for its name, it fundamentally smashed earnings and the candle here that closed on the daily is known as a spinning stop with a green closure. Expect a volatile move soon - tomorrow or and into Friday. NASDAQ:MSTR held up well today. This is always a craps shoot, no matter the trade, no matter the look of the chart and all the indicators we use. It just creates an edge. Good luck. I’m going to look at calls here for a bounce.
Wall Street Loser.
ARKM | CHART PATTERNS | BUY the BOTTOMARKM is a fairly new altcoin that's been on my TOP alt list for some time.
The bearish M chart pattern is a pattern that signifies a large correction, especially in the macro timeframe such as the weekly. By looking at the chart, e can see the correction is nearly over since it has almost retraced ack to opening levels - almost .
Opening levels have in fact not yet been retested, and this may be a great place to stack up / re-accumulate if you're a believer.
Another ALT that's seems to be approaching a bottom is AVAX:
______________
BINANCE:ARKMUSDT

Bitcoin (BTC/USD) Trade Setup – Potential Bullish ReversalHelle Guys Here Is My First Analysis On BTC/USD Keep Me Update In And Follow Me For More Instrutions thanks
On the 1-hour chart, Bitcoin recently broke out of an ascending channel but faced a sharp correction. Price has now found support around $94,400, which aligns with a key demand zone. A rebound from this level could trigger a bullish move toward the $99,700 target, where strong resistance is expected.
Trade Plan:
Entry: Near $96,200, after confirmation of support.
Target: $99,700 (key resistance zone).
Stop Loss: Below $94,400 to manage risk.
If price holds above support and reclaims key levels, a bullish continuation is likely. However, failure to hold could lead to further downside. Traders should monitor price action and volume for confirmation before entering.
Let me know your thoughts in the comments! Do you see BTC recovering or breaking lower? 🚀📉
Must Support Me And Share it With Your friends And Family thanks Trade At Own Risk and Strategy

The SECRET to BULLISH CHART PATTERNS | EducationBullish chart patterns play out towards the upside... atleast most of the time.
In some cases, a bullish pattern forms - seemingly strong- but ends up going the complete opposite direction. There is a way to navigate this very frustrating outcome - by waiting for confirmation.
Through waiting a little longer, you will surely reduce the profits - but this greatly reduces the risk of playing a "failed" pattern.
Keep a close eye on this bullish chart pattern forming on SUI:
__________________________

# Shree Cement , 1W and 1D Good Looking Pattern for Breakout , Bullish Pattern
It is Positional Setup .
Enter when the Upper Trendline Breaks and
Be careful when You enter because They are chance to happen false breakout . Avoid False Breakout by Considering the Nifty50 Trend .
aim for 30% in short Term and aim for up to 80% in Long Run .
This is my Point of view .
If you want to trade the good patterns and want to learn the good price action trading
follow me and like the charts to encourage me .

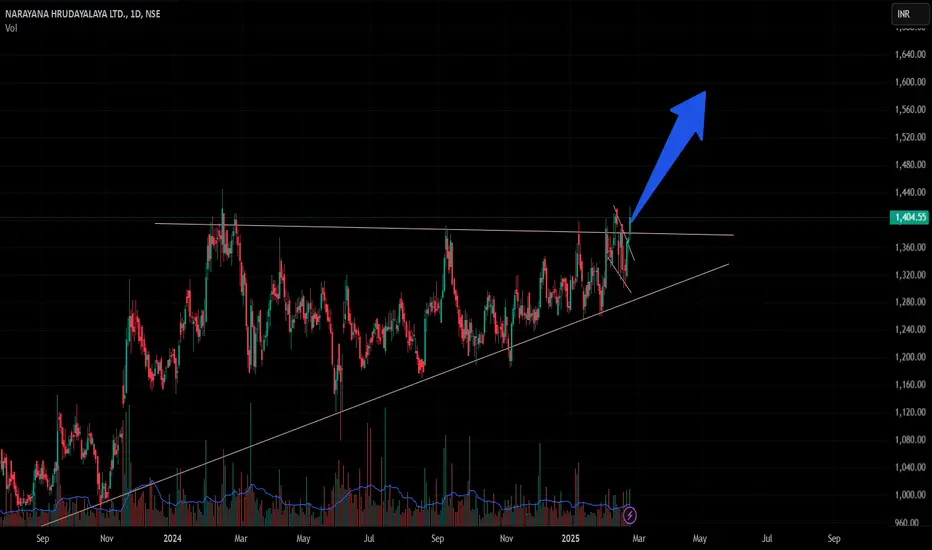
#NH , 1D and 1W Bullish Pattern
Looks Very Good in Weekly And Daily Time Frame , It is Ready for Breakout from Pattern .
It has Repeated the same pattern in Past so High chances to go up .
if u find this Chart Helpful pls like and Follow for More like this charts .
I am A Swing Trader , Trade only Price Action Patterns .
SUI | ALTS | BULLISH Chart Pattern?A bullish chart pattern is forming on SUI in the daily chart.
It should be noted that this patter is still premature - meaning that it's not yet completed and there is not yet the confirmation that we need to act on it:
Don't miss the most recent update on XRP here:
_________________________
COINBASE:SUIUSD

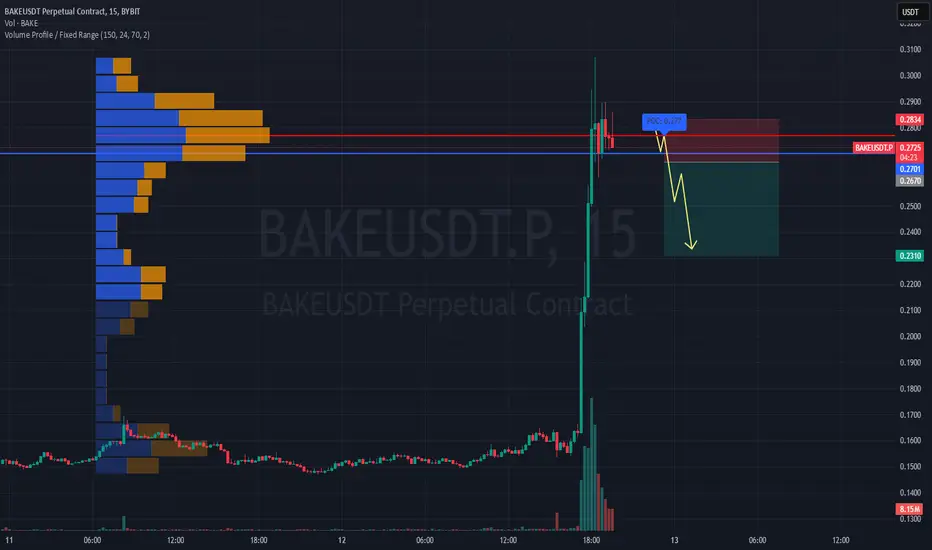
#BAKEUSDT shows correction signals📉 SHORT BYBIT:BAKEUSDT.P from $0.2670
🛡 Stop Loss: $0.2834
⏱ 15M Timeframe
✅ Overview:
➡️ BYBIT:BAKEUSDT.P experienced a sharp upward spike, reaching $0.2834, but was followed by a strong decline, indicating profit-taking from major players.
➡️ POC (Point of Control) at $0.2837 shows a high-liquidity area where most trading volume occurred, suggesting a possible resistance zone.
➡️ The $0.2670 level currently acts as short-term support, but a confirmed breakdown could trigger further downside.
➡️ The chart structure signals a potential correction after this steep rally, making short positions at these levels attractive.
⚡ Plan:
➡️ Enter short after confirming a breakdown below $0.2670.
➡️ Risk management through Stop-Loss at $0.2834, placed above the liquidity zone.
Targets:
💎 TP 1: $0.2585
🔥 TP 2: $0.2452
⚡ TP 3: $0.2310
🚀 BYBIT:BAKEUSDT.P shows correction signals — expecting further downside!
📢 BYBIT:BAKEUSDT.P saw a vertical spike, but the lack of strong buying interest at higher levels suggests potential profit-taking.
📢 If $0.2670 breaks downward, we could see continued selling pressure towards $0.2310.
📢 However, a breakout above $0.2834 could change the scenario, so risk management is crucial.
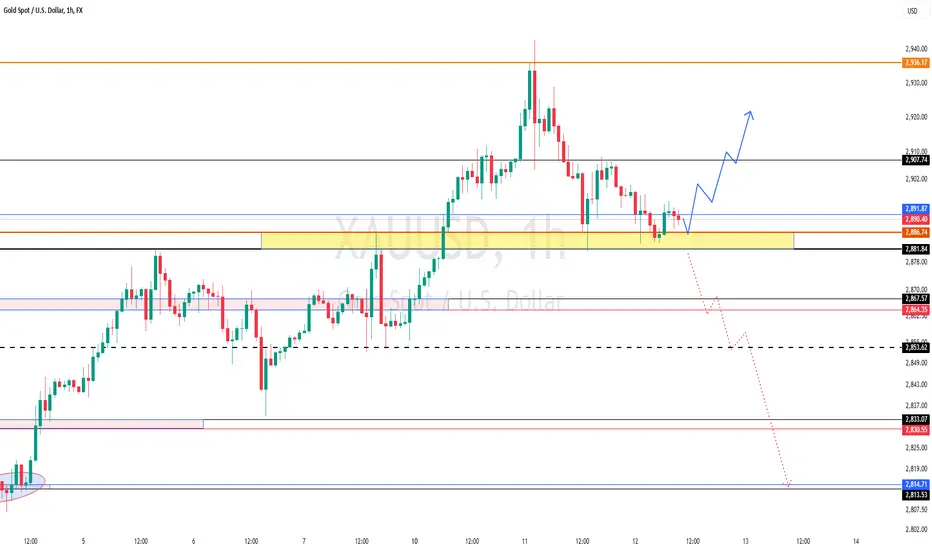
GOLD - at DO or DIE area, holds or not??#GOLD - well guys as you know that today is CPI day and we will see aggressive move in market according to technical point of view we have single supporting area that is around 2881 to 2886
that is today most expensive region.
and only holdings of that region can create and resume buying trend again otherwise below that market will again drop towards his next supporting areas.
so don't be lazy here and stay sharp at that region and don't hold your buying positions below that.
NOTE: we will go for cut n reverse below 2881
good luck
trade wisely