Is it time to buy China stocks? BABA? TME? PDD?Many Chinese stocks are quietly breaking out.
News headlines from other aspects of investing and world politics are drowning out these bullish setups.
Breakouts observed in some leading names.
China

Alibaba - Buy The DipHello Traders, welcome to today's analysis of Alibaba.
--------
Explanation of my video analysis:
Starting in 2016 Alibaba created a pretty obvious higher timeframe bullish reversal which was followed by a crazy bullrun on Alibaba stock. In 2021 Alibaba broke below a major bullish trendline and dropped more than -70%. If we see another bullish reversal at the $65 level and a break above the trendline mentioned in the analysis, I am looking for bullish trading setups.
--------
I will only take a trade if all the rules of my strategy are satisfied.
Let me know in the comment section below if you have any questions.
Keep your long term vision.

China’s Auto Exports Surge 58% to Record High in 2023 The development follows another milestone for Chinese auto exports after they hit more than 3 million vehicles in 2022 and over 2 million in 2021, the report said.
The latest record was driven by a surge in exports of new energy vehicles, which climbed 77.6% in 2023 to more than 1.2 million units, according to the report.
Overall auto sales in China climbed 12% year over year to 30.1 million units, while output rose 11.6% to 30.2 million units, Xinhua added.
Nio:
- Trading at 35% below our estimate of its fair value
- Revenue is forecast to grow 22.58% per year

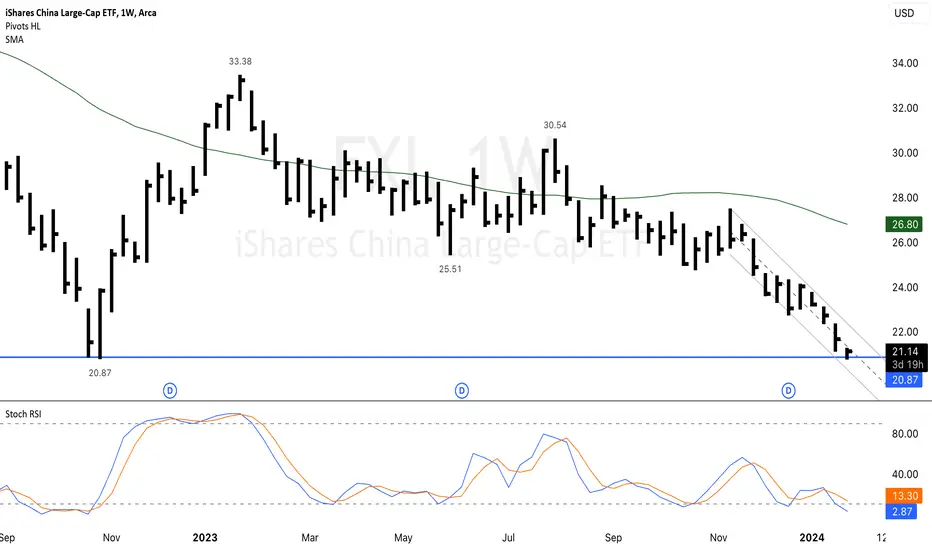
$FXI China Large Cap ETF Double BottomAMEX:FXI , China Large Cap ETF, shows a Double Bottom pattern. Wait for a breakout of the parallel downtrend or a stop below the double bottom. CHINA IS PLANNING A STOCK MARKET RESCUE PACKAGE BACKED BY $278 BILLION DOLLARS.
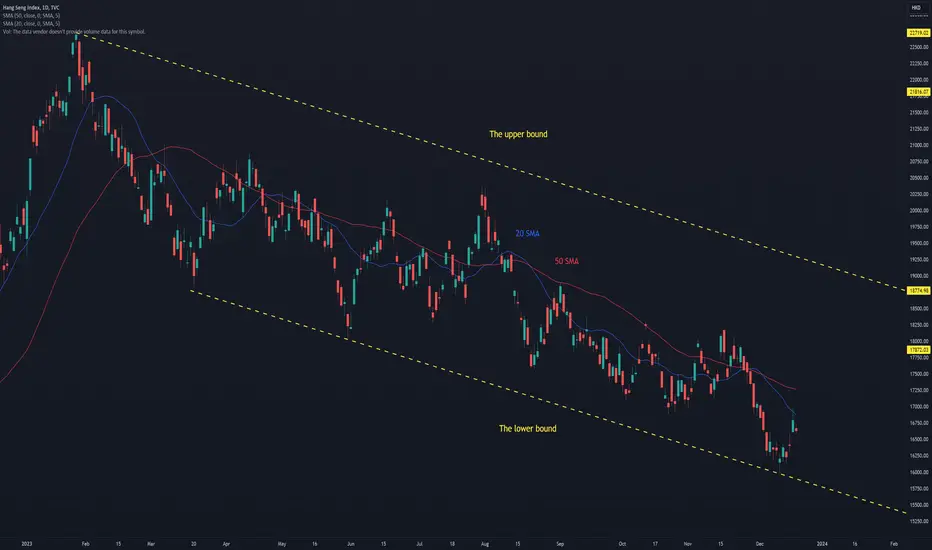
Ride the Japanese Wave, Don't Grab That China Falling KnifeIt was nearly three years ago when the China stock market notched a short-term peak. Recall how the world's second-largest economy was initially seen as a growth engine coming out of the worst of the pandemic. An authoritative regime in China, led by President Xi Jinping, crippled the economy's expansion trajectory through harsh ongoing lockdowns and by clamping down on many industries, one after another. Then in early 2023, hope sprang eternal that China would re-open amid a burst of consumer spending, a la what was seen during the 'revenge travel' period in the United States back in 2021 and 2022. That did not come to fruition, and the Hang Seng Index is now down by more than 50% in the last three years.
With all that turmoil going on in China, Japan's Nikkei 225 Index has continued to soar. Up more than 20% since February of 2021, the once sleepy Tokyo stock market features among the best momentum readings of all countries. Based on these trends, sticking with the 'long Nikkei, short China' trade should keep working, in my view. Another way to play it is by being long developed market stocks and avoiding emerging market funds (which still have a roughly 20% allocation to China).
Finally, while China trades at a single-digit P/E ratio today, Japan is by no means expensive. Goldman Sachs notes that the country's current 12-month forward earnings multiple is just 14.9, about average compared to its 20-year history (Asia-Pac ex-Japan is 12.3x, for perspective). Interestingly, Japan is back up to 6% of the global stock market allocation while China has sunk to just 3%. Perhaps it is indeed the land of the rising sun while China is a classic "sub"-merging market.
A solid ETF to play Japan continues to be the WisdomTree Japan Hedged Equity ETF (DXJ) which hedges exposure to the Japanese Yen. The ETF has a solid track record of outperforming other Japanese country funds.

$RUGRES 'August/2023 Accumulation'ECONOMICS:RUGRES
The latest data from the International Monetary Fund’s (IMF) International Financial Statistics (IFS) report shows that Russia’s central bank increased its gold reserves in August, restoring reserves back to previous levels from earlier this year.
“IMF IFS data shows gold reserves at the Central Bank of Russia rose by 3 tonnes in August,” according to Krishan Gopaul, Senior Analyst at the World Gold Council.
Analysts reacted positively to the data, but some raised questions regarding Russia's gold production and where the precious metal is going.

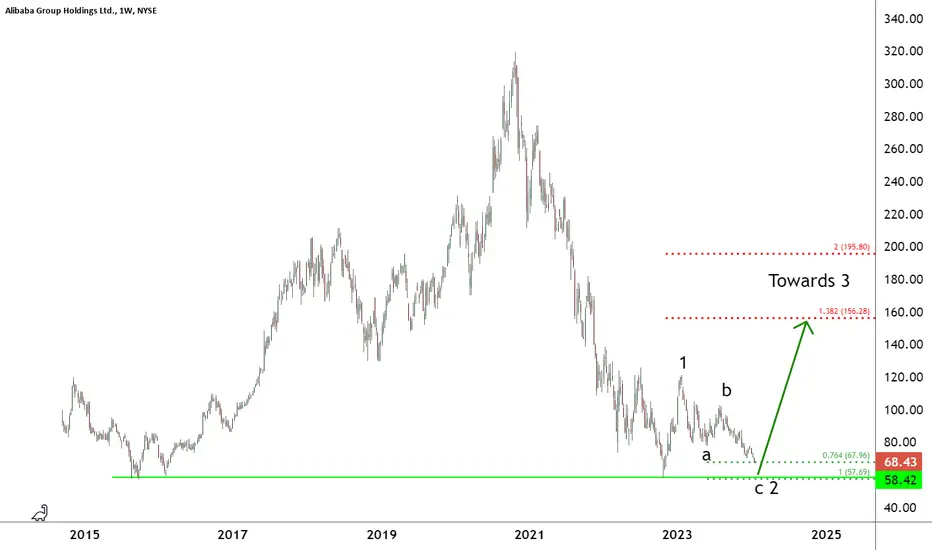
BABA building a potentially bullish setupThe China tech sector is looking was oversold and due for a sizeable rebound soon.
Alibaba (BABA), among others, seems near to complete its corrective B wave and start a new upleg.
Only a break below last year's low would invalidate this view.
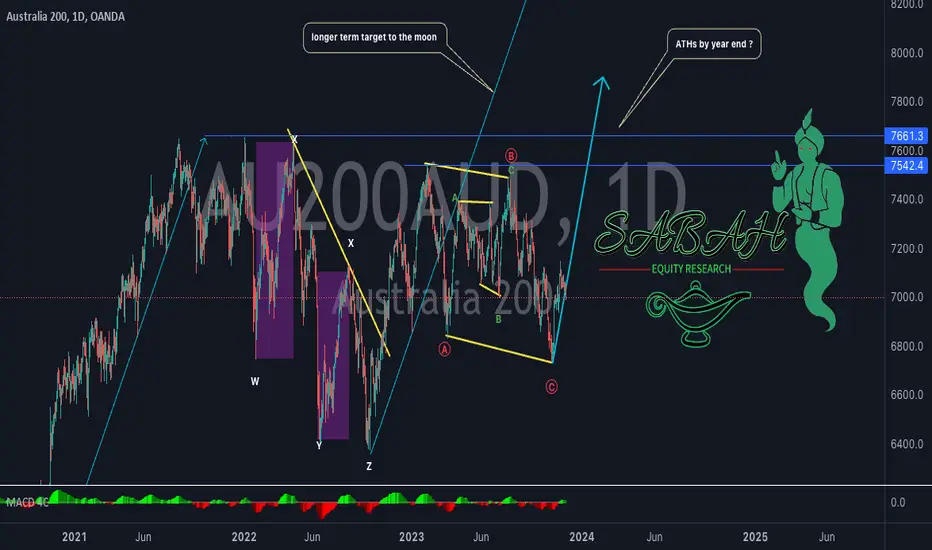
China Property Stimulus to Boost Aus200 IndexThe recent announcement of a stimulus package by the Chinese government to boost the property sector is expected to have a positive impact on the Australian stock market, particularly the Aus200 index. The stimulus package includes measures such as lower down payments for home purchases and tax breaks for developers. These measures are expected to increase demand for property in China, which will in turn benefit Australian companies that export goods and services to the Chinese market.
In addition, the stimulus package is also expected to boost the Chinese economy, which is Australia's largest trading partner. A stronger Chinese economy will mean more demand for Australian goods and services, which will support corporate profits and earnings growth. As a result, the Aus200 index is expected to rise in the coming months.
Of course, there are also some risks associated with the China property stimulus. If the stimulus is too successful, it could lead to an overheating of the Chinese economy and a resurgence of inflation. This would be negative for Australian companies that export to China, as it would make their goods and services less competitive. However, at this stage, it appears that the risks are outweighed by the potential rewards.
Overall, the China property stimulus is a positive development for the Australian stock market. The stimulus is expected to boost demand for Australian goods and services, support corporate profits and earnings growth, and lift the Aus200 index.
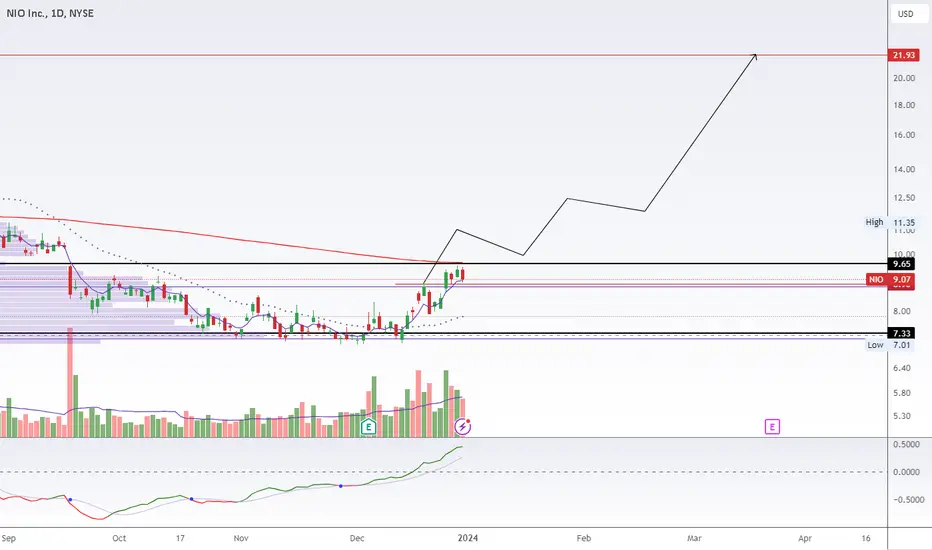
NIO - Building Phase1 baseNeeds to breakout of the range at 10 and hold 9.50 again for push to 14 and perhaps 21.
Volume profile looks constructive for continuation. Real action will be above 10.
Disclosure: I am long from 8.0 on a half position. Will wait for breakout above 10 for full position
Filecoin Is Officially Dead Another Chinese Coin Down the Drain!Filecoin Is Officially Dead Another Chinese Coin Down the Drain!
Imagine there are people who bought this at ATH for $230 and now it isn't even a lousy $10!
Many people recently bought this because of shiller Arthur Hayes, they will be very sorry, too for falling for that charalan!
If you want to prevent losing money follow me.
Filercoin will go to $0.10!

Longi Green China is expected to target 32.3Daily chart, Longi Green China stock is trading in a falling wedge. After crossing the resistance (blue line) at around 22.3, the chart pattern target will be 32.3
Technical indicators RSI and MACD are positive
Stop loss level at 20.5 should be considered.

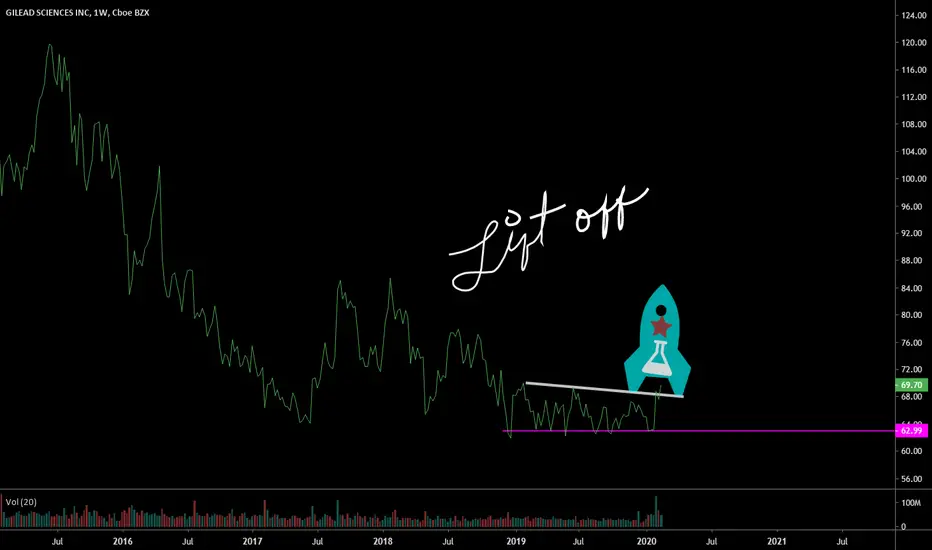
GILD: $69 | another Breakthrough for Humanity | Loaded!from Ebola treatment to quick remedy for Corona
truly a mission worth funding and risking on
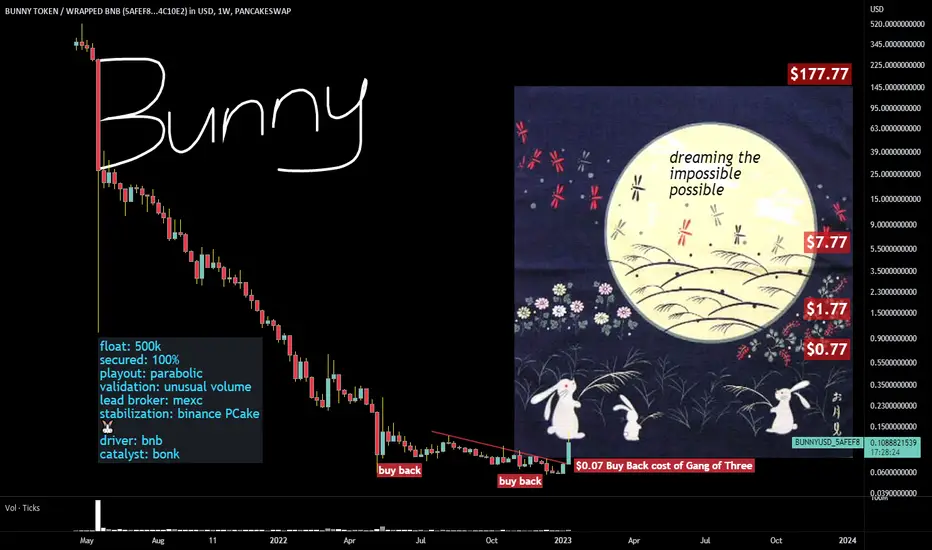
BUNNY: $0.10 | a Binance Lab Pet for Tsa Nis Nu Year
when the universe the stars and the gods will it
then as early approaching Jan 22, 2023 shall be a moment to look forward
a yield optimizer that has a simple intuitive application
with a significant Value Locked
just waiting for placements to be noticed
by Chinese New Year as TRADiTiONAL Chinese observe the FENG SHui and
tradition of the old world
good luck
and remember.. size your entries and maintain discipline
#RabbitMoon
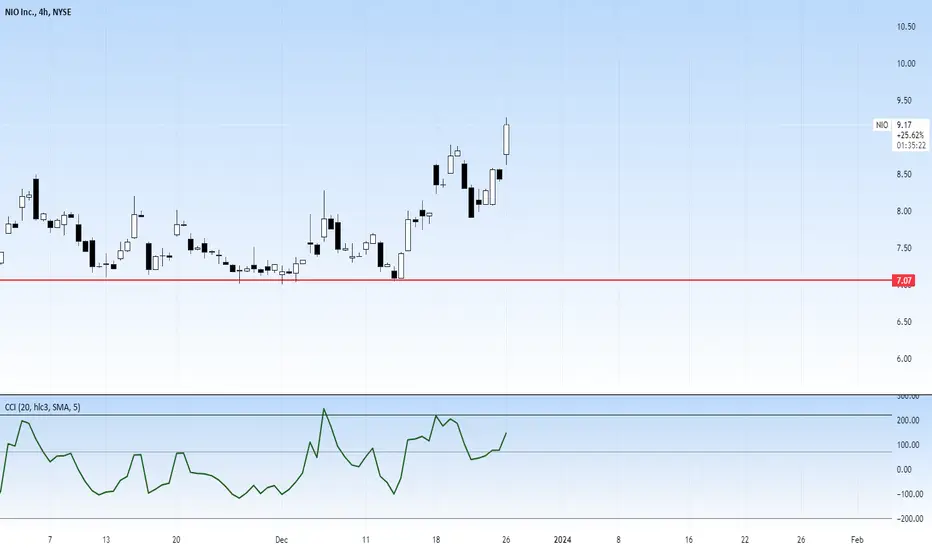
NIO 9.50 THEN 10 THEN 11 LONG Trading Idea for NIO Inc. (NIO):
Long Position:
Key Points:
Electric Vehicle (EV) Growth: NIO is a key player in the electric vehicle market, and the global shift towards electric transportation provides a favorable backdrop for the company. Growing awareness of sustainability and government incentives can drive increased demand for NIO's electric vehicles.
Market Expansion: NIO's expansion beyond the Chinese market and its efforts to enter international markets, particularly in Europe, could open up new revenue streams. Positive developments in international expansion plans may boost investor confidence.
Innovative Technology: NIO's focus on innovation, including battery technology and autonomous driving features, positions the company competitively in the EV space. Positive advancements in technology may attract investors seeking exposure to cutting-edge developments.
Battery-as-a-Service (BaaS) Model: NIO's unique Battery-as-a-Service model, allowing customers to purchase electric vehicles without the battery, could appeal to cost-conscious consumers and potentially expand NIO's market share.
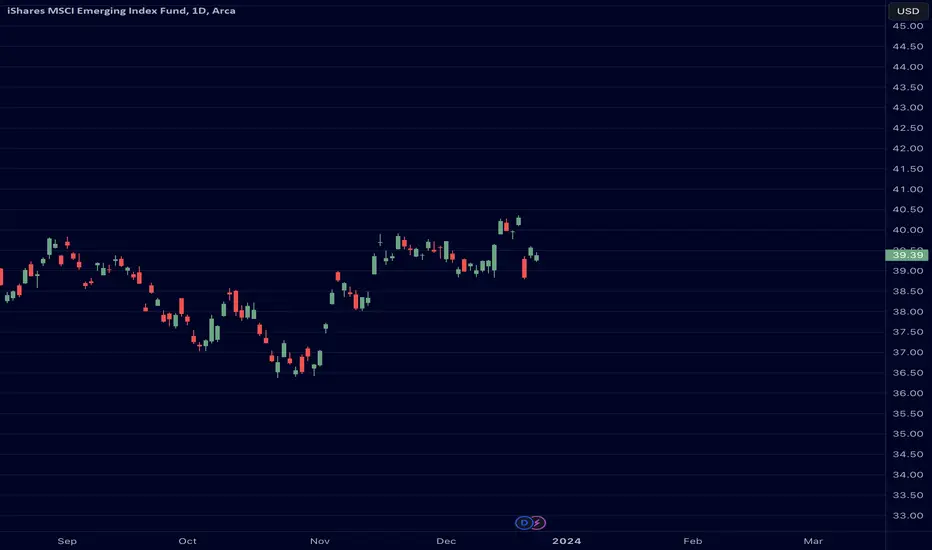
$EEM: A Revisit Above 40?We're looking at emerging markets here for a possible intermediate term pop above the 40 handle possibly into 41. China will need to stop going down and KWEB will need to hold 25 but we'll see. Good look traders!
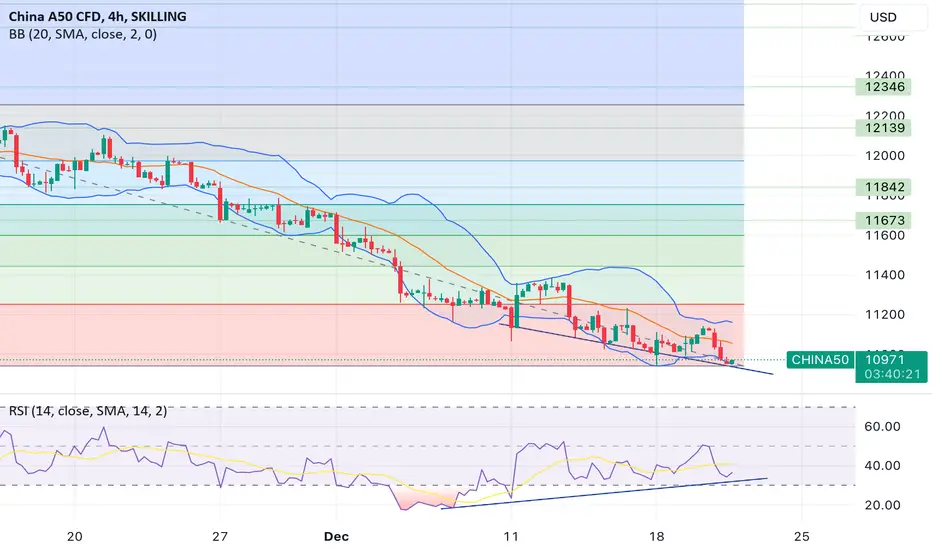
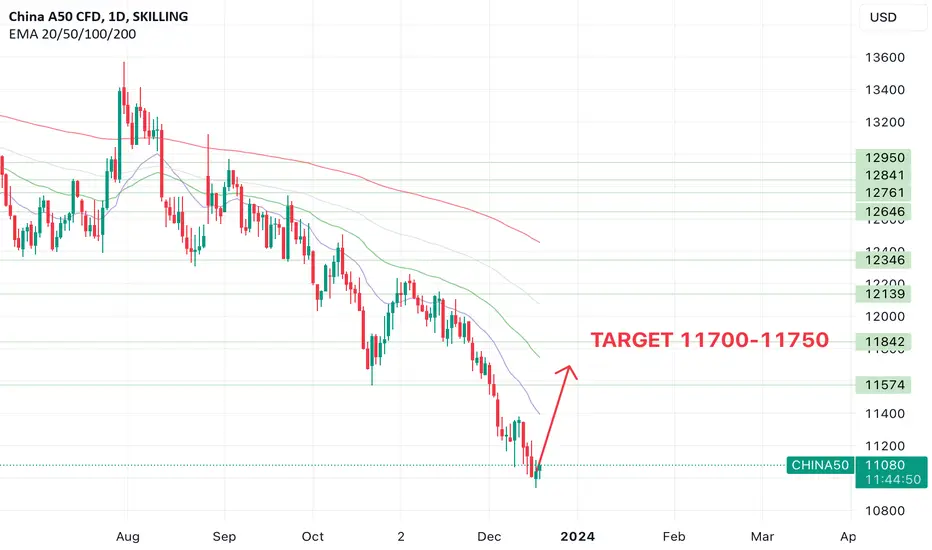
CHINA50 updated forecastOn 4hr chart divergence is forming. I still think it's an opportunity to buy.
RSI on daily chart is 27 - very low.
We might be here for a while because of low volatility during Christmas holiday.
The Dragon Awakening: China's Stock Market Set for GrowthThe Chinese stock market has been volatile in recent years, but there are signs that it is on the verge of a major rebound. The government is implementing a number of reforms that are aimed at boosting economic growth and investor confidence. These reforms include tax cuts, infrastructure spending, and measures to support small and medium-sized businesses.
As a result of these reforms, there is a growing sense that China's stock market is undervalued. This is reflected in the fact that the MSCI China Index, which tracks the performance of Chinese stocks, is currently trading at a discount to the MSCI World Index, which tracks the performance of stocks in developed markets.
Investors who are looking for long-term growth opportunities should consider investing in Chinese stocks. The country has a large and growing economy, and its stock market is poised for a major rebound.
Here are some of the reasons why China's stock market is set for growth:
The Chinese economy is growing at a rapid pace. The Chinese economy is expected to grow by 7.8% in 2023, making it one of the fastest-growing economies in the world.
The Chinese government is committed to supporting the stock market. The government has implemented a number of reforms that are aimed at improving the environment for investors. These reforms include measures to increase transparency and protect investors from fraud.
The Chinese consumer is growing in affluence. The Chinese consumer class is growing rapidly, and this is creating strong demand for goods and services. This is a positive sign for the Chinese economy and its stock market.
Investors who are considering investing in Chinese stocks should carefully research their investment options and consult with a financial advisor.
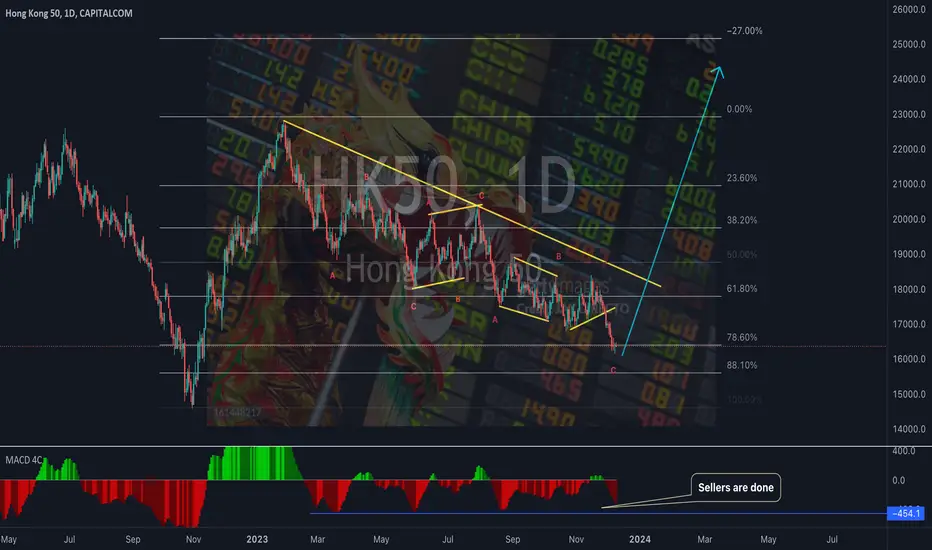
CHINA50 interesting LONG set upI don't usually trade CHINA50, when it comes to China I prefer HK50, but this is an interesting set up/amazing buying opportunity:
- RSI is very low - 29 on daily chart, RSI was 24 few days ago.
- 11000-11100 is a strong support level. Even in March 2020 the index found support at 11500
- I'm aware of economic situation, but I still believe that recession will hit US and European market really bad in 2024/2025, but this will be opportunity for China to grow in strength
- bearish move might be not over yet but once the trend reverses, I believe it can easily start movement towards 15000-16000 (in next 12 months or so)
*This is not a trading advice. Trading is risky. Always do your own analysis before entering the market.*
Shanghai Composite SHCOMP ~ Bearish H&S Formation (Dec 2023)SSE:000001 chart mapping/analysis.
Bearish H&S formation on weekly chart.
Price action already broken below multi-decade trend-line.
Pattern follows through = -29% measured move down to 78.6% Fib / retrace to 2005 breakout / gap fill (weekly) confluence zone (green box).

Long $NIO and $BABABought Chinese tech stocks last week because they are cheap and appear to be at technical bottoms.

A few trends in China's economyToday, we would like to briefly discuss a few underlying trends in China's economy, touching on the subject of unemployment, demographics, and deflation.
Youth unemployment
While the unemployment situation has improved in 2023, youth unemployment (for those aged between 16 and 24) has been a longtime issue in China. Indeed, it has steadily risen since 2018 (back then, it stood at around 10%), with government programs promoting a higher level of education contributing to the problem. As a matter of fact, this year, in June, the youth unemployment rate hit a staggering 21.3%, prompting the Chinese government to stop reporting the number.
Illustration 1.01
Illustration 1.01 shows the daily chart of China’s unemployment rate.
Demographics and fertility
Another big issue in China is the country’s aging population and declining fertility among women. The median age has risen from 28.9 years in 2000 to 34.1 years in 2010 and 37.4 years in 2020. On the other hand, the average number of births per woman stood at 1.6 in 2000; in 2012, 2014, 2016, and 2017, the average rose to 1.8. But since 2018, the rate has been rapidly collapsing. In 2021, the number stood at 1.2, representing approximately 33% decline since 2018.
China’s deflation
As much of the Western world grapples with inflation, China has the opposite problem. For November 2023, the country recorded -0.5% deflation compared to the previous year. With that said, there were three periods when China experienced deflation (annually) since the 1990s. The first period occurred between 1998 and 1999, when the annual inflation rate was -0.8% and -1.4%. The second instance took place in 2002, and the third in 2007. For the eleven months of 2023, the inflation rate averages about 0.3%, the lowest figure since 2009.
Housing prices
Amid the ongoing property crisis in China, house prices have been sliding down this year. Actually, there were only two prints when the year-over-year change was not negative, particularly in June 2023 (coming in at 0.1%) and July 2023 (coming in at 0%).
Please feel free to express your ideas and thoughts in the comment section.
DISCLAIMER: This analysis is not intended to encourage any buying or selling of any particular securities. Furthermore, it should not serve as a basis for taking any trade action by an individual investor or any other entity. Your own due diligence is highly advised before entering a trade.
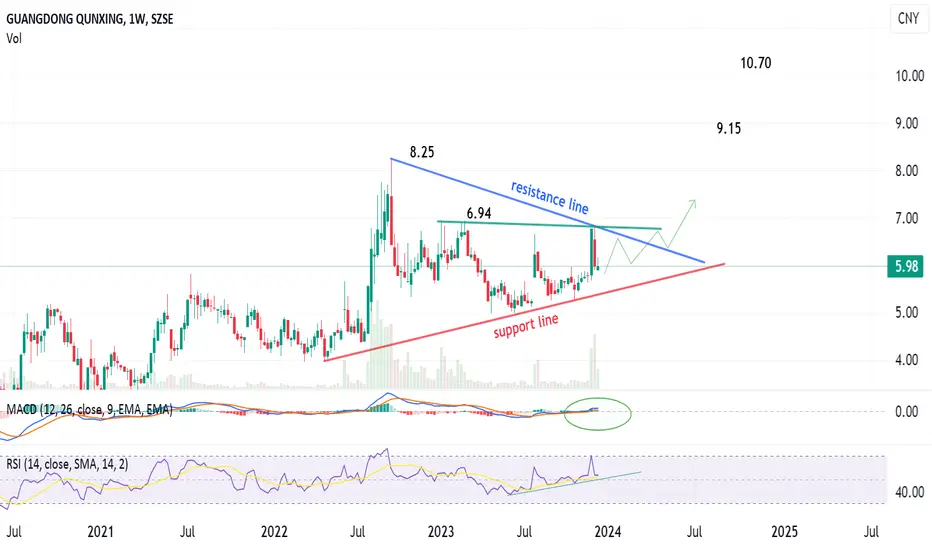
002575 (Guangdong) is forming a pattern, to target 10.7Weekly chart,
Stock 002575 (Guangdong) is trading inside a triangle, and after crossing the resistance line (BLUE), the target will be 10.70
Resistance levels 6.94 , 8.25 , 9.15 to be monitored.
Both technical indicators MACD and RSI are positive
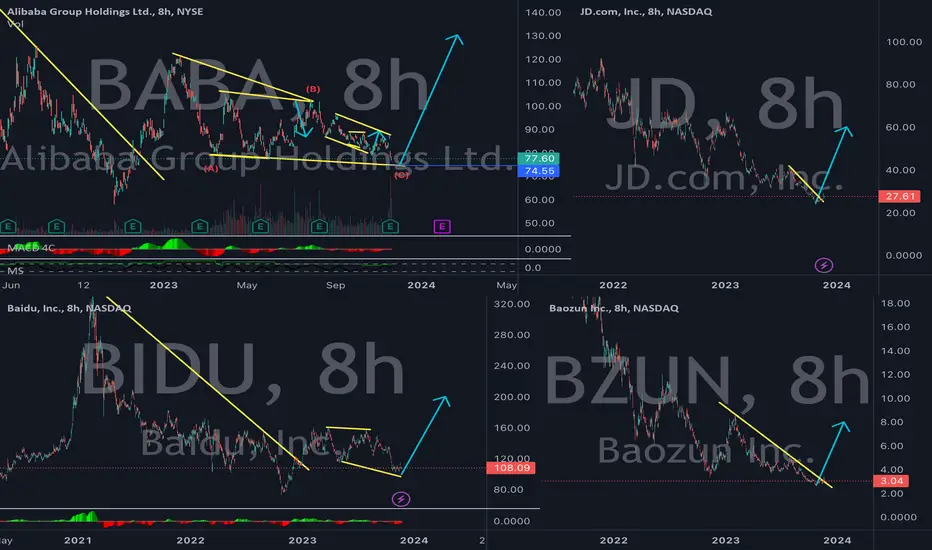
Top Beaten-Down Chinese Stocks to Buy Right Now
Reasons to buy
Alibaba Group Holding Limited ( NYSE:BABA ) : Leader in the Chinese e-commerce market, strong track record of innovation and growth.
JD.com, Inc. ( NASDAQ:JD ) : Well-established and profitable company with a strong market position, benefiting from the growth of the Chinese e-commerce market
Baidu, Inc.( NASDAQ:BIDU ) : Dominant player in the Chinese search market, strong track record of innovation, expanding into new markets, such as cloud computing and artificial intelligence
BZUN X, Inc. ( NASDAQ:BZUN ) : Rapidly growing company with a strong market position, benefiting from the growth of the Chinese fintech market
I would recommend allocating your funds as follows:
BABA: 40%
JD: 30%
BIDU: 20%
BZUN: 10%
This Chinese portfolio is designed to provide you with exposure to the Chinese stock market while also diversifying your risk. BABA is the largest company in the Chinese e-commerce market and has a strong track record of innovation and growth. JD is another well-established e-commerce company with a strong market position. BIDU is the leading search engine in China and is also expanding into new markets, such as cloud computing and artificial intelligence. BZUN is a rapidly growing fintech company with a strong market position.
I believe that this portfolio is a good investment for the long term. The Chinese economy is growing rapidly and is expected to continue to grow in the years to come. This growth is being driven by a number of factors, including an expanding middle class, rising urbanization, and increasing consumer spending. As the Chinese economy grows, so too will the Chinese stock market.
I recommend you should consider your own individual circumstances and risk tolerance before making any investment decisions.
Boost the idea for more content