Anta Sports: Turning Point Reached 🛑The bears dominated Anta Sports' price action last week, causing further sell-offs. Given this development, we do not consider the magenta wave (x) to be over yet and give it some room to fall. However, the price should not fall too much further and especially not below the support level of HK$67.85. Above this level, the low should be reached and the bullish move in the form of the magenta-colored wave (y) should resume. On the other hand, a break below this level would trigger our alternative scenario, to which we assign a fairly high probability of 44%, which would entail a direct completion of the green wave (2).
China

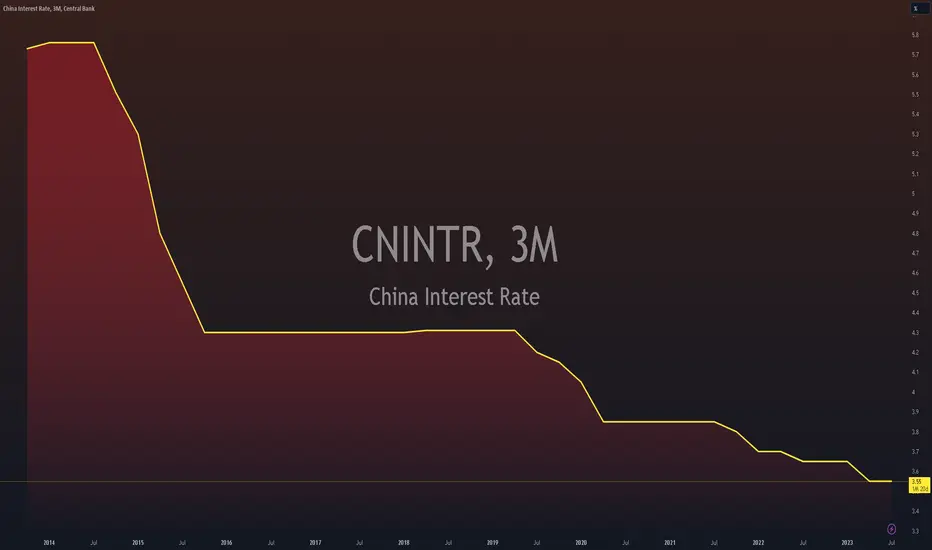
$CNINTR - Interest Rates Cut- The People’s Bank of China on Tuesday trimmed its one-year loan prime rate (LPR) by 10 basis points from 3.65% to 3.55%, and reduced the five-year rate by the same margin to 4.2%. The cuts follow reductions in other interest rates last week.
The LPR sets the interest that commercial banks charge their best clients, and serves as the benchmark for household and corporate lending. The one-year rate affects most new and outstanding loans, while the five-year rate influences the pricing of longer term loans, such as mortgages.
This is the first time the PBOC has cut both LPR rates since August 2022, when renewed Covid lockdowns and a deepening property downturn were pummeling the economy.
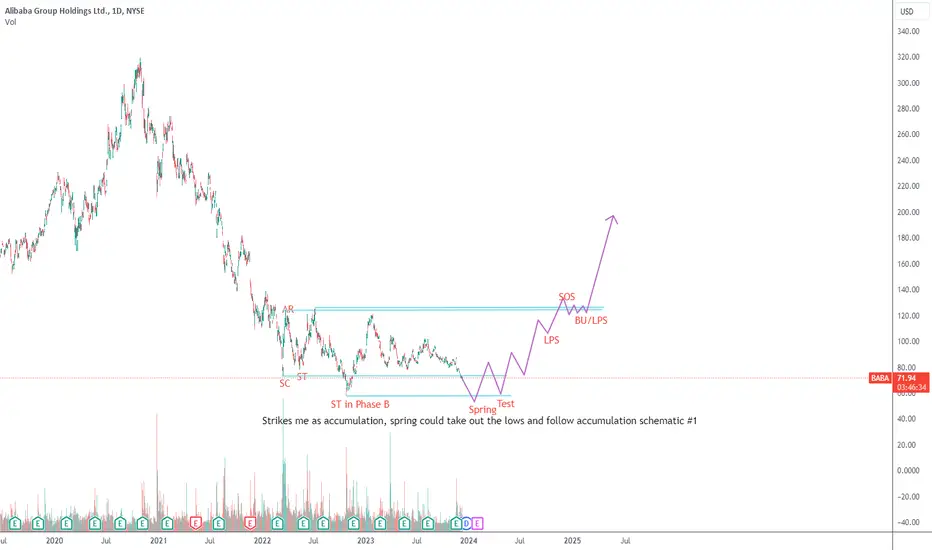
BABA - Accumulation (MAGS)Looks like BABA is going through Wyckoff Accumulation Schematic #1.
Lows to be broken via Spring and then new bullish trend to emerge
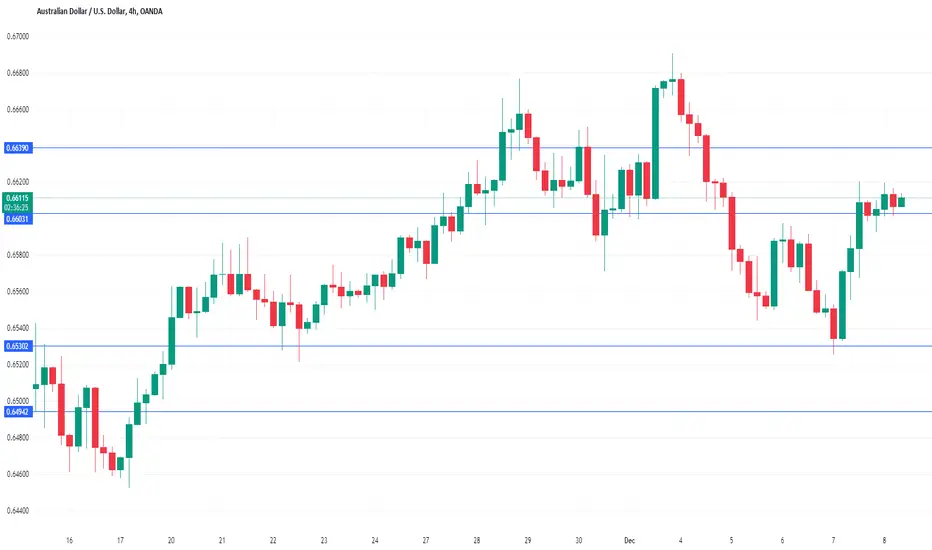
Australian dollar on a roller-coaster, US NFP loomsThe Australian dollar is trading quietly on Friday. In the European session, AUD/USD is trading at 0.6611, up 0.14%.
It has been a roller-coaster week for the Australian dollar. After declining 1.88% early in the week, the Aussie rebounded on Thursday and gained 0.80%. Today's US nonfarm payrolls report could result in further volatility from the Australian dollar in today's North American session.
All eyes are on the US nonfarm payroll release later today. After falling sharply in October to 150,000 from a revised 297,000, nonfarm payrolls are expected to rebound to 180,000. If nonfarm payrolls are weaker than expected, speculation of a Fed rate cut will rise, while a hot report would undermine market confidence that a rate hike isn't too far away.
Outside the headline data, average hourly earnings will be closely watched, as wage growth is a key driver of inflation. The consensus estimate for average hourly earnings in November stands at 0.3% m/m, compared to 0.2% in October. A higher-than-expected reading could generate a market reaction and give the US dollar a lift.
Australia's largest trading partner is China and the slowdown in the world's second-largest economy will likely dampen Australia's economy. China's economic woes were reflected in this week's Australian GDP, which posted a weak 0.2% gain for the third quarter, compared to the 0.4% gain in Q2. Notably, exports dropped for the first time since Q1 2022.
China's economic slowdown has resulted in disinflationary pressures. Chinese CPI decreased 0.1% in October and another 0.1% decline is expected in the November release on Saturday. If China's economy continues to weaken, demand for Australian exports could fall even further and that could weigh on the Australian dollar.
AUD/USD is testing resistance at 0.6603. Above, there is resistance at 0.6639
0.6530 and 0.6494 are providing support
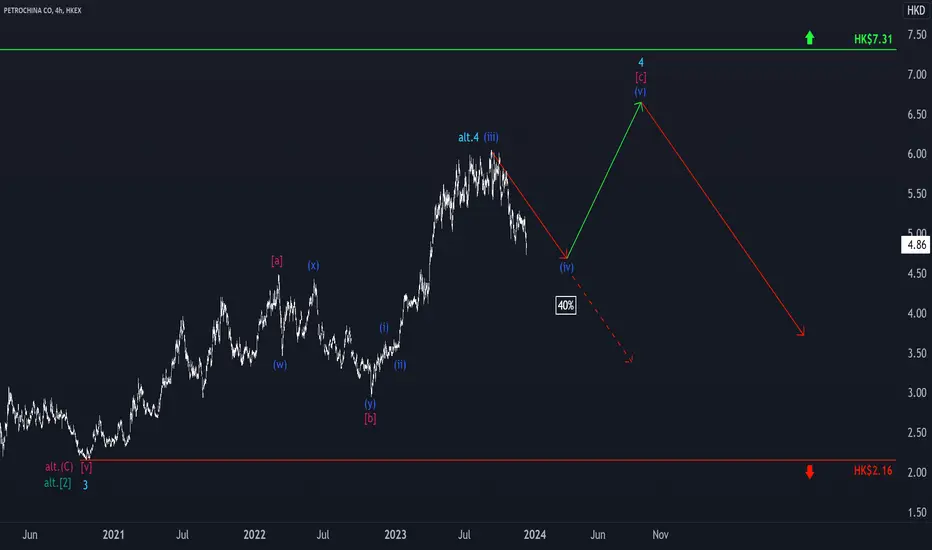
Petrochina: Please reverse! 🔄Last week, the PetroChina share price continued its downward trend and has now reached the level at which it should form the low of the blue wave (iv) in our primary scenario. Consequently, it should soon stabilize and stop its downward movement. With the low in its pocket, a further rise is then on the cards to complete the turquoise wave 4. Only when this overarching movement is completed should stronger declines follow. However, there is also an alternative scenario with a fairly high probability of 40% that would come into effect if the sell-off continues into next week. In this case, the high of the turquoise wave alt.4 would already be in place and the price would be in the subsequent downtrend.
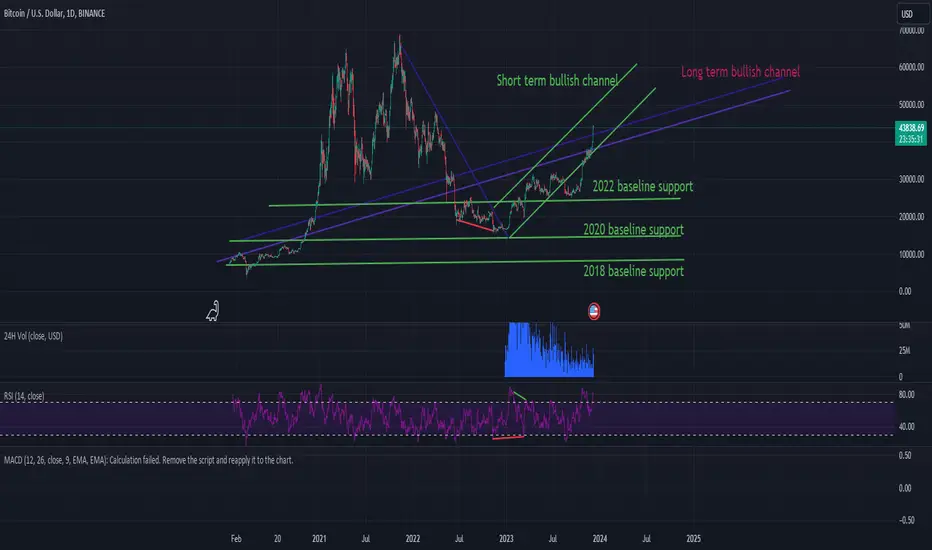
Another cycle another dollar to be madeHi guys its been a while since I've posted last
the cycle is continuing again as predicted
volume slowly picking up
etf bitcoin news is very promising
there is a new bullish channel emerging on the shorter period of the next 6 months
with a min growth of up to 65k
and max growth of up to 140k
after the spike it'll drop back down and slowly fill back to 45k as support while maintaining
the long term bullish channel from 2017
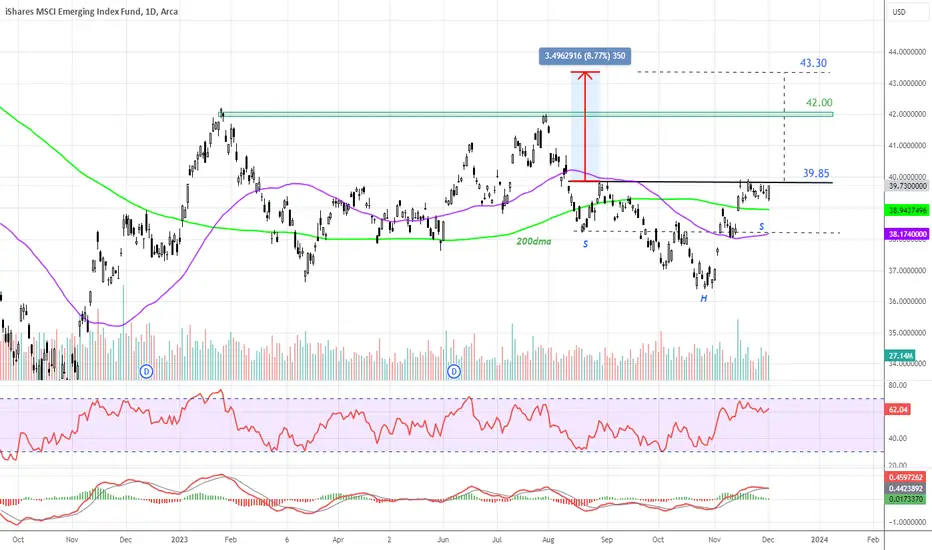
#EEM Emerging markets poised for a breakup ?While not a perfect construction this does look like an inverse Head and Shoulders. A break above the neckline resistance at 39.85 should see this poised to move to 42.00 and then the target of 43.30 which is almost 9% higher. Note price has been consolidating above the 200dma now for 13 days which is quite significant and i think the probability favour an upside breakout.
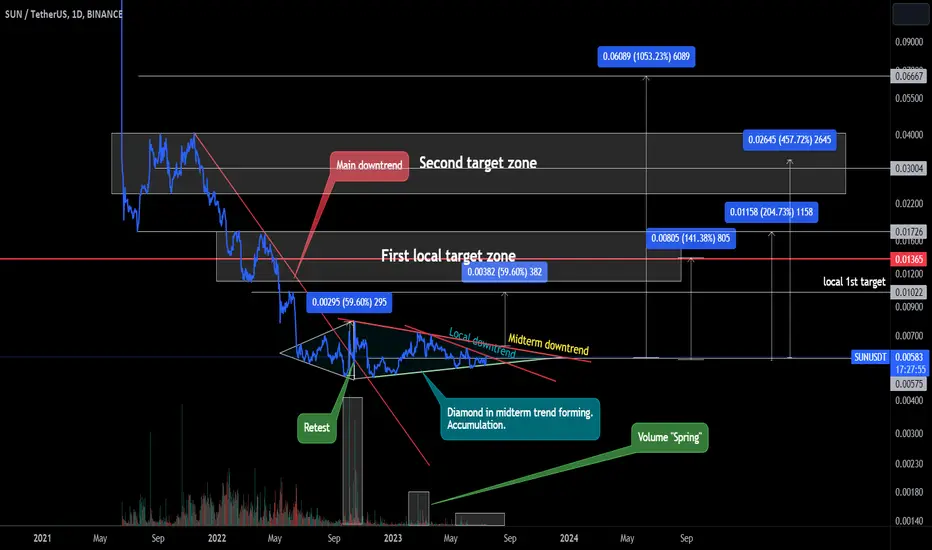
SUN/USDT 1D. Main trend. Secondary. Local. All main details.Coin Sun. This is an altcoin from the TRX ecosystem. Other coins in this ecosystem are: NFT, JST, BTTC(BTT), TRX.
On the backstage of XRP rise(China money partly) TRX class of assets also look very interesting.
In this idea i'll share my view on SUN from TRX group of assets.
From the beginning of the trading history coin has been dumping, which is basic for almost every altcoin.
After reaching certain prices trend reversed and broke the main downtrend.
After that the retest followed and that was also the moment of the beginning of big diamond forming.
I remind you that diamond is a reversal of the trend pattern, also consider the timeframe it's forming on(the bigger the TF the stronger the formation).
This diamond is forming already for something about 400 days.
Local and midterm trends are shown on the chart. Also consider the volume spring shown, which means that there's a potential for big impulse soon.
Local targets and zones are shown on the chart.
Capitalization of this coin is 55m$ as for the moment of writing. So there's quite a potential of 10x on the high of the trend. This will be 666 zone...
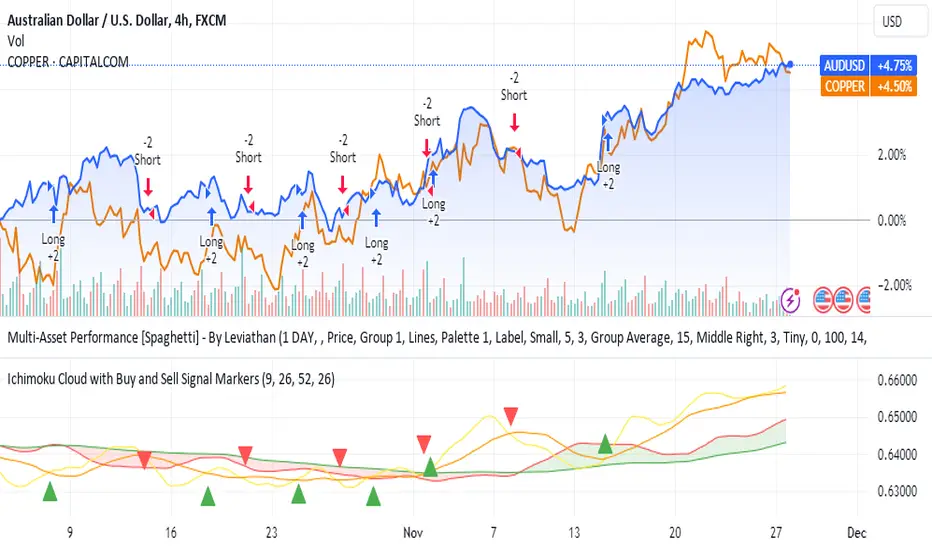
Leveraging the AUDUSD Strength Amidst USD WeaknessThere has been an opportunity that has emerged due to the recent fluctuations in currency values and the growing demand for copper exports to China.
As you may be aware, the USD has been experiencing a period of weakness, while the AUD has shown signs of strength. This presents an advantageous situation, as we can leverage the stronger Australian dollar against the weaker US dollar.
In light of this, I propose that we explore the possibility of exporting copper to China. With the AUDUSD exchange rate in our favor, we can maximize our profits by capitalizing on China's increasing demand for copper.
China, being one of the largest consumers of copper worldwide, offers a lucrative market for our manufacturing. By exporting copper to China, there is a growing demand and take advantage of the current exchange rate of AUDUSD.
$LTHM STOCK - Time for Growth?📈 LIVENT Lithium Analysis - CHINA Destocking / Supply shocks & Merger Speculations
Welcome to Helios Capital Investment! In today's video, we dive deep into the world of lithium and dissect the financial landscape of Livent Corporation (Ticker Symbol: LTHM), a key player in lithium extraction and refining.
🌐 Market Dynamics:
With the lithium market being a crucial player in the global shift towards electric vehicles and renewable energy, Livent has been navigating through turbulent waters. Our analysis explores the impact of China's destocking efforts on lithium prices and how Livent is positioned to weather this storm.
💼 Merger Imminent?
Rumors are swirling about a potential merger, and we break down the implications for Livent and its investors. What could this mean for the company's strategic positioning and market share?
📊 Financial Performance:
Delving into Livent's financials, we examine revenue trends, costs, and the company's ability to maintain a competitive edge in the lithium sector. How has Livent performed in comparison to industry benchmarks, and what does this mean for its future?
📉📈 Stock Analysis:
We take a close look at Livent's stock performance, assessing key indicators and considering factors such as valuation and growth potential. Is now the right time to invest, or are there warning signs that investors should be aware of?
🤔 Key Questions Addressed:
How is Livent positioned in the face of China's destocking efforts?
What are the potential outcomes and impacts of a rumored merger?
Can Livent maintain its competitive edge in the lithium market?
👍 If you find this analysis valuable, don't forget to like, share, and subscribe for more in-depth financial content! Let's navigate the markets together.

$NVDA downside gap-fill potential!NASDAQ:NVDA ,1D: Price dipped just below the 50% line and popped back up over the line after coming off the local lows at 403. Given the 'uncertainty' around the level and duration of a 'higher for longer' rate environment along with the market's general preference for 'clarity' over 'uncertainty', it would not be unreasonable to expect the 'increased volatility' that comes with 'uncertainty' until some level of 'clarity' can be established around the duration of the current 'higher rate environment'.
Further adding to the potential for 'market uncertainty' and 'lack of clarity' are the tenuous and ongoing negotiations between the U.S. and China around access to semi-conductor IP. NASDAQ:NVDA utilizes the cost benefits provided to its model from the 'cost efficiency' of both Chinese and greater Asia's manufacturing and production capacities. Were trade relations around semi-conductor IP between China and the U.S. to become 'less amenable', the deterioration of that relationship could adversely impact NASDAQ:NVDA 's margins.
If NASDAQ:NVDA had to re-establish production/manufacturing supply chain relationships elsewhere this could inject 'uncertainty' into the price discovery process. These are 'unknown unknowns' at this point and hard to factor into analysis, but at a minimum, they would increase the potential for 'market uncertainty' and the subsequent 'lack of clarity', which often leads to 'price volatility' until some level of 'certainty' could be re-established.
Looking at our 1 day RSI against price I am seeing a 'bearish divergence' whereby price makes 'higher-highs' and 'higher-lows' while the RSI prints 'lower-highs' and 'lower-lows'. This can be taken as a 'leveling off' of momentum that often precedes a change in price direction or, at a minimum, a significant pull back within a constructive trend. (see light violet curves)
I would expect that a downside 'gap fill' could be a 'necessary evil' at some point in time across the next 6 weeks or so, and before further gains to the upside could probabilistically be portended from a structural standpoint. The bottom of the gap fill is roughly in confluence with the YTD VWAP (peach).
NOT FINANCIAL ADVICE. ALL STOCKS CAN GO TO ZERO.

aaai #BABA needs to hold here - results 16thAlibaba still making higher swing lows on the daily. We recently broke out this falling wedge but have come back to retest the breakout. Important level to hold if the bulls want further upside. Results on 16th November could be a catalyst for a larger move

$CRWD: Bulls crowding 190Crowdstrike saw an impressive break of 190 today and I suspect this action may continue. Good luck traders..

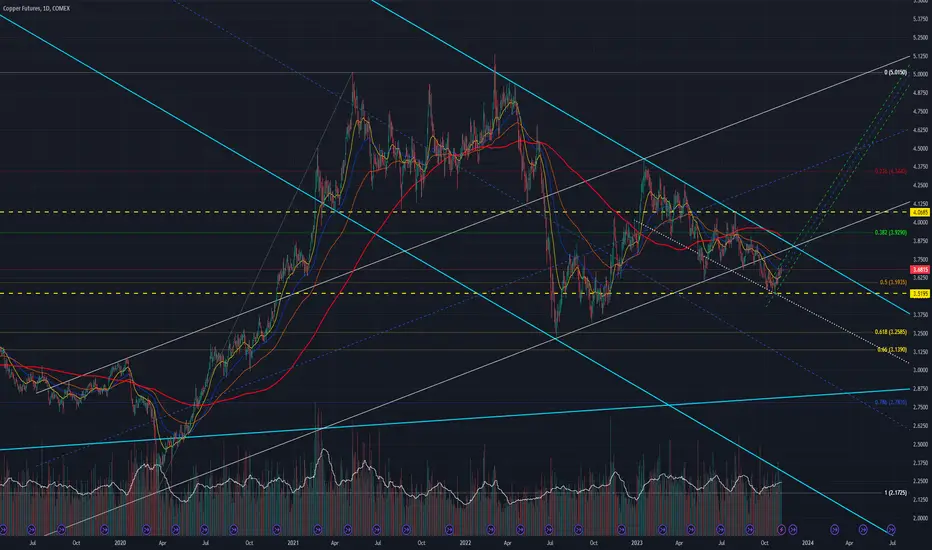
Copper Futures ~ November TA Outlook (Daily Chart)COMEX:HG1! chart mapping/analysis.
Note: TradingView chart B-ADJ adjusted for contract changes
Copper Futures attempting to build bullish momentum off evolving China economic stimulus narrative.
China Life Insurance: Bounced back🎾After placing the low of the blue wave (ii) at the lower border of the orange target zone between $10.10 and $11.32, China Life Insurance's share price initially rose to the upper border of the target zone last week, gaining over 12%. However, the price has not yet been able to sustainably break out of the zone, causing it to bounce and fall again. As a result, entry opportunities remain within the zone on the long side, with stops placed around 1% below the lower border. We expect the price to rise well above the zone and cross the resistance at HK$15.84. Only an imminent break below the support level at HK$8.53 would diminish this outlook. This would activate the 33% probable alternative, which involves a lower low of the green wave alt.(2).

NZD/USD slides on RBA decision, mixed Chinese dataThe New Zealand dollar is down sharply on Tuesday. In the North American session, NZD/USD is trading at 0.5927, down 0.61%. It has been a roller-coaster ride for the New Zealand currency, which continues to swing wildly. Last week, NZD/USD surged 3.24%, its best weekly performance since October 2022. This week has been all red for the New Zealand dollar, which has fallen 1.19%.
Today's Reserve Bank of Australia decision sent the Australian dollar reeling and also dragged down the New Zealand dollar, as there is a strong correlation between the two trans-Tasman currencies.
The Australian dollar is down 1.16% against its US counterpart, despite the RBA raising rates by a quarter point to 4.35%. The language in the RBA statement was somewhat dovish, stating that the rate hike was meant to ensure that "inflation would return to target in a reasonable timeframe.” This signalled an easing of the RBA's tightening basis and raised expectations that the RBA may have completed its tightening cycle or is very close to that stage.
The RBA statement included the usual rhetoric that future rate decisions would be data-dependent and rate hikes were still on the table, but the markets jumped on the dovish language and ignored the rate increase, which follows four straight pauses. The strong market reaction suggests that the investors believe that the RBA is unlikely to raise rates even though inflation remains well above the 2%-3% target range and inflation expectations have been stubbornly high.
The New Zealand dollar also lost ground due to mixed Chinese data. Imports rebounded in October with a gain of 3.0% y/y following a 6.2% decline in September and beating the market consensus of -4.8%. However, exports fell 6.4% after a 6.2% decline in September and missed the market consensus of -3.3%. This marked a sixth successive decline, indicative of continuing weak global demand for Chinese goods.
New Zealand releases Inflation Expectations for the fourth quarter on Wednesday. The market consensus stands at 2.60%, after a 2.79% gain in Q3. An unexpected reading could have a sharp impact on the movement of the New Zealand dollar.
NZD/USD is testing support at 0.5929. The next support line is 0.5858
There is resistance at 0.5996 and 0.6069

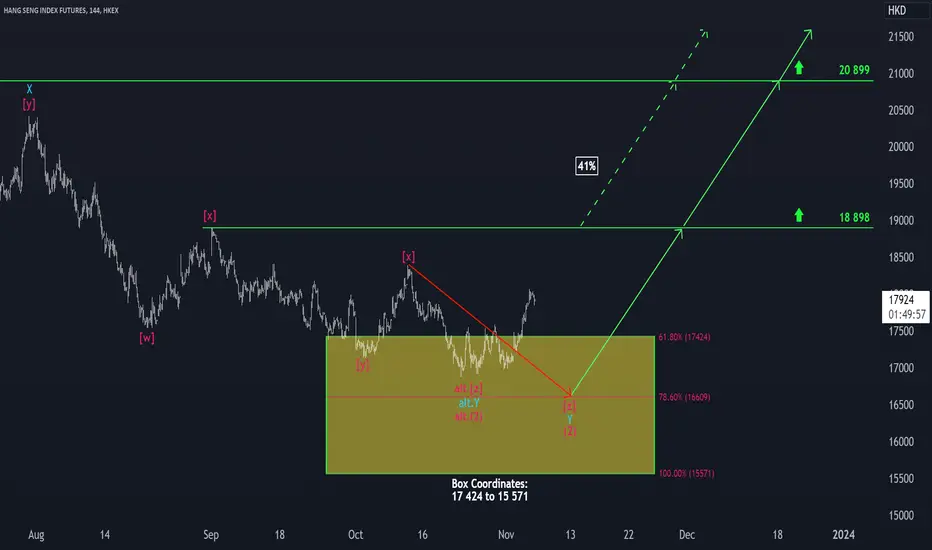
Hang Seng Index: Motivated! 💪The bulls were able to push the Hang Seng Index significantly higher on Friday, moving it further away from the yellow trading range between 17,424 and 15,571. However, we still expect the price to return to this area as part of the magenta wave (2) to make a lower low before the reversal occurs. That said, given the price action so far, we have to increase the probability of our alternative to 41%. In this case, the low of the magenta wave alt.(2) would already be in place and this scenario would come into play on a rise above the resistance at 18,898. However, it should be noted that our long-term expectation has already been fulfilled with the completion of the trading range. In both cases, there is considerable upside potential in the medium to long term. The price should clearly overcome the resistance at 20,899.
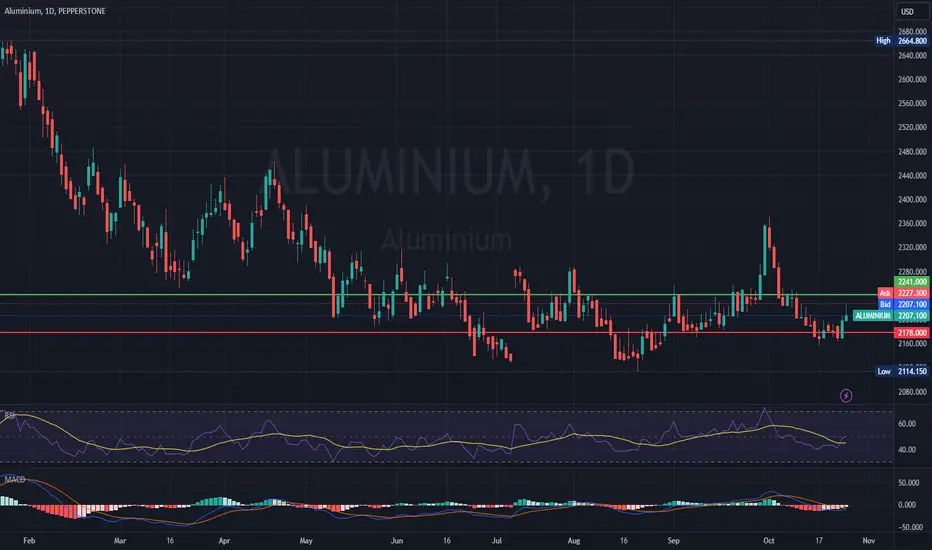
ALUMINIUM PRICES MIGHT BE PULLED UP DUE TO CHINA DEMANDChina's aluminum market in 2023 stands out for its resilience, with prices on the Shanghai Futures Exchange (SHFE) bucking global trends by climbing over 1%, while the London Metal Exchange (LME) saw an 8% slump. This divergence is largely credited to the strength of China's green sector and decarbonization efforts. An open arbitrage window, created by SHFE outperforming LME, has led to a substantial increase in aluminum imports into China, mainly from Russia due to sanctions imposed by Western buyers after Russia's invasion of Ukraine. Despite the surge in imports, domestic aluminum production in China has reached new highs, partly due to an improved hydropower supply in Yunnan province. However, potential disruptions during the upcoming dry season could impact production and increase imports. Low domestic aluminum inventories underscore robust domestic demand, with SHFE stocks at their lowest levels since March 2019.
Beijing's decarbonization initiatives have driven aluminum demand, particularly in renewable energy-related manufacturing. Notably, the rapid growth of China's new energy vehicles (NEV) sector and the critical role of aluminum in battery electric vehicles highlight its significance in this industry. The solar sector, another major aluminum consumer, continues to expand, with China leading in solar photovoltaic (PV) capacity additions. This growth in green sectors is expected to counterbalance weaknesses in traditional sectors, sustaining demand for aluminum. China's aluminum market exemplifies a unique blend of domestic resilience, increasing imports, and a strong emphasis on green industries, all contributing to the sector's dynamics in 2023.
On a technical note, MACD and RSI are still in the neutral and sell zone, but are rising up and buy signals are starting to form.
If the trend continues, the price might reach levels of 2241, in the opposite scenario the price might revert to levels of 2178.
Risk Disclosure: Trading Foreign Exchange (Forex) and Contracts of Difference (CFD's) carries a high level of risk. By registering and signing up, any client affirms their understanding of their own personal accountability for all transactions performed within their account and recognizes the risks associated with trading on such markets and on such sites. Furthermore, one understands that the company carries zero influence over transactions, markets, and trading signals, therefore, cannot be held liable nor guarantee any profits or losses.
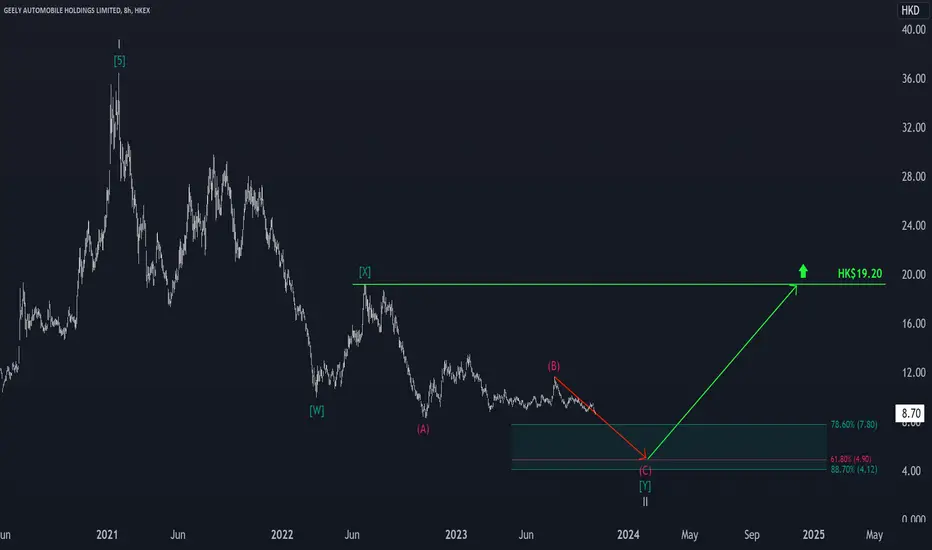
Geely: Bears are back 🍯🐻The bears have now pushed Geely stock back below its March low. This confirms our primary scenario that the stock is in the final phase of the overarching gray wave II from the high of the magenta wave (B). This move should now be advanced to the green target zone between HK$7.80 and HK$4.12. With the low placed, the price should then move significantly higher.
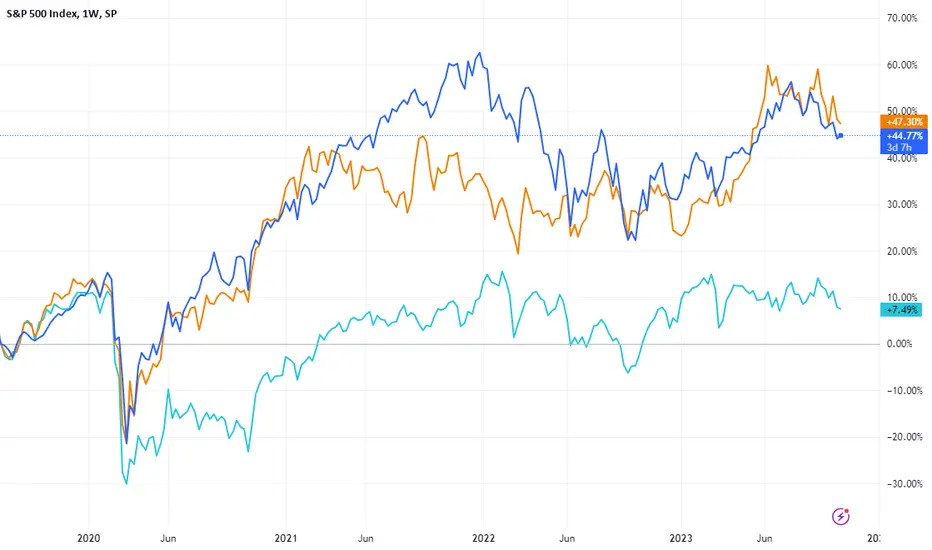
Soft landing calls for tough choices2023 has been a tough year for stock pickers. The gap between equity factor styles has been vast over H1. Growth, riskier in nature, posted the best performance up 24% year-to-date (YTD) followed closely behind by quality up 20% YTD1. The excitement around artificial intelligence (AI) reached a fever pitch in H1 2023, supporting growth-oriented technology stocks.
As we enter H2 2023, we remain constructive on select areas of global equity markets. The resilience of the US economy has defied all odds. The strength of the US consumer (accounting for 70% of GDP), alongside the fiscal impulse, has been the cornerstone of the US’ extraordinary resilience. While inflation has shown encouraging signs of decline in the US, strong economic momentum alongside a rebound in commodities raises the risk of a re-acceleration of inflation. In turn, rates could remain higher for longer, resulting in Federal Reserve (Fed) rate cuts being delayed until Q1 2024. In such an environment, an enhanced equity income approach could fit well. Even if the earnings outlook weakens in China, proactive policy support via rate cuts could support its stock multiples.
In Europe, where we are likely to witness a mild recession, we believe adopting a more cautious and defensive approach is warranted. Earnings revision ratios remain the strongest in Japan while they are the weakest in emerging markets.
US equities are the belle of the ball
It was the narrowest market in history, with just 25% of stocks outperforming the S&P 500. Expectations of cooling inflation aiding the Fed to end its current tightening cycle supported the performance of higher-duration growth stocks. For investors calling for a soft landing, rates are likely to remain at current levels or higher for a longer duration of time. A tight US labour market, with unemployment at historic lows and rising wages, is likely to slow the downward pricing momentum in the service sector. As the market regime transitions, it should provide a ripe opportunity for market breadth2 to improve. Markets may begin to favour value and dividend-paying stocks. History has shown us that breadth tends to improve as the economy recovers from a downturn.
Peak pessimism towards China
China’s reopening rebound has faded. The transition to a less debt-fuelled, less property-reliant and more consumer-driven economy is an important adjustment. We expect government stimulus policies to be aimed at enhancing the efficiency of the private sector. Further iterations of policy rate cuts by the People’s Bank of China (PBOC) are likely to follow; however, outright quantitative easing won’t be on the cards, as it is likely to further weaken the yuan, which the PBOC would like to avoid. With a low correlation to US equities (at 20x P/E)3 coupled with a high valuation discount, pockets of China continue to provide good investment prospects.
Pockets of opportunity in non-state-owned enterprises
Non-state-owned enterprises, particularly within the Technology, Communication Services and Health Care sectors, faced the brunt of China’s regulatory crackdown. These regulatory interventions stifled growth in key sectors such as e-commerce, mobile payment, ride-hailing, and online education. It also resulted in the suspension of initial public offerings (IPOs) and delisting of Chinese internet companies. Growing political frictions in supply chains are incentivising China to regain independence in the semiconductor and hardware space. Chinese technology companies are trading at a significant discount compared to US peers, offering plenty of room to catch up.
Prefer defensives over cyclicals as Europe runs out of steam
Nearly six months back, investors marvelled at how the euro-area economy had emerged from the energy crisis. That momentum appears to be fading as China’s recovery slows down, consumer confidence declines, and the impact of tighter monetary policy gains a stronghold on the economy. Higher inflation over the past year is holding back demand from households, which is hurting growth.
The monetary tightening over the past year not only triggered an increase in real rates, it also impacted borrowers’ credit metrics. Owing to this, eurozone banks have tightened their lending standards.4 Banks remain the primary source of corporate funding in Europe. The credit impulse—that is, the annual change in the growth of credit relative to GDP—in the euro area reached its lowest point since 2010.
TINA is alive in Japan
There is no alternative (TINA) to equities is still alive in Japan. This is evident from higher equity risk premiums of 2.97% for Japan compared to 0.41% in the US.5 While the rest of the world has been busy trying to quell the inflation fires, Japan has emerged from the COVID-19 lockdowns with a faster pace of growth and higher inflation. A combination of higher equity risk premiums, a weaker yen supportive of the Japanese export market, corporate reforms, and attractive valuations have been important catalysts for equities.
Policy shift still remains loose
The Bank of Japan (BOJ) took a significant step towards normalisation in July by announcing a further adjustment to its yield curve control (YCC) regime. The BOJ formally changing its course constitutes an acknowledgement that inflation is returning to the Japanese economy. Yet the BOJ lowered its (median) inflation forecast for fiscal year (FY) 2024 to +1.9% and left its FY 2025 projection unchanged at +1.6%, in effect justifying ongoing easing by the BOJ. With Japan’s nominal growth rising over the coming years, the revised policy by the BOJ still remains loose, supporting the case for Japanese equities. Historically, a weaker yen has benefitted the performance of Japanese exporters as it enhances their competitive advantage. Adopting a tilt towards dividend-paying Japanese equities is likely to reap the benefits of not only a weaker yen but also corporate governance reforms.
Conclusion
As we progress into year-end, the outlook remains more nuanced. In the US, we favour value and dividend stocks as equity market breadth improves. While China’s problems in the housing sector are likely to remain a drag on domestic demand, we do see pockets of opportunity in undervalued sectors – technology and healthcare. Given the strong manufacturing headwinds facing Europe, we expect weak growth in the eurozone for the remainder of 2023, potentially favouring a tilt towards defensive stocks.
Sources
1 Bloomberg as of 11 October 2023.
2 Breadth is measured by comparing the equal weighted performance versus the market cap-weighted performance of the US stocks listed on the S&P 500 Index.
3 P/E = price to earnings ratio.
4 Euro area Bank Lending Survey (BLS), April 2023.
5 Bloomberg, WisdomTree, as of 29 September 2023. Equity risk premium is the difference between the earnings yield and the respective 10-Year Government Bond Yield.
This material is prepared by WisdomTree and its affiliates and is not intended to be relied upon as a forecast, research or investment advice, and is not a recommendation, offer or solicitation to buy or sell any securities or to adopt any investment strategy. The opinions expressed are as of the date of production and may change as subsequent conditions vary. The information and opinions contained in this material are derived from proprietary and non-proprietary sources. As such, no warranty of accuracy or reliability is given and no responsibility arising in any other way for errors and omissions (including responsibility to any person by reason of negligence) is accepted by WisdomTree, nor any affiliate, nor any of their officers, employees or agents. Reliance upon information in this material is at the sole discretion of the reader. Past performance is not a reliable indicator of future performance.
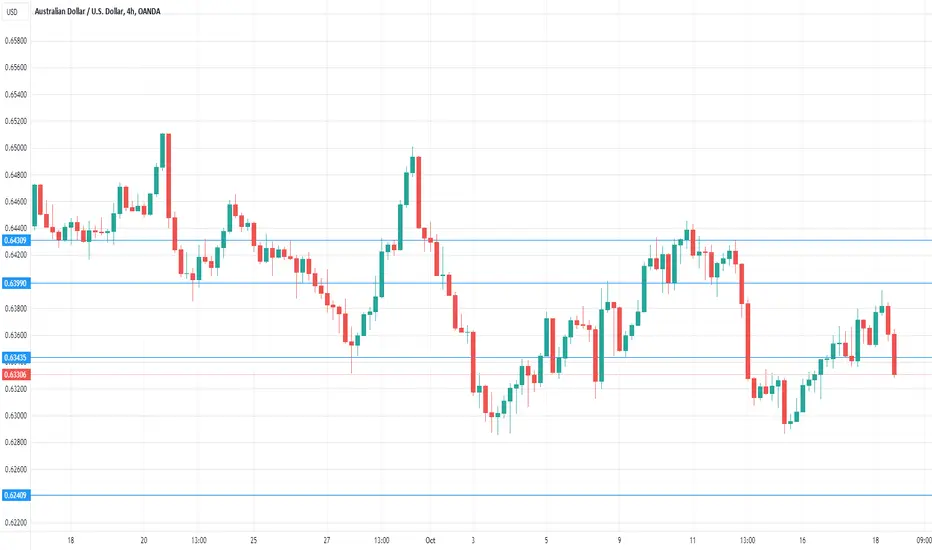
AUD/USD edges lower, China data beats expectationsThe Australian dollar started the day higher but has reversed directions. In the North American session, AUD/USD is trading at 0.6357, down 0.13%.
The US dollar has steamrolled the Aussie, which hasn't posted a winning week since September and dropped close to a one-year low last week. The Australian dollar has bounced back this week, however, gaining 1.08%.
The situation in the Middle East remains perilous, with the risk that the Israel-Hamas war could spread and ignite a regional war. President Joe Biden has arrived in Israel, a move intended as a warning to Iran and others not to enter the conflict. The fighting has not affected risk sentiment, as investors haven't panicked and snapped up greenbacks. Still, the Middle East is a powder keg at present and if the situation worsens, we could see a flight to the US dollar.
Australia will release employment numbers on Thursday. Job growth has been solid and posted a strong gain of 64,900 in August. Employment is expected to fall sharply to 20,000 in September. Unemployment has been at low levels and is expected to remain at 3.7% for a third straight month.
China is Australia's number one trading partner, which means that Chinese releases can have a significant impact on the Australian economy. China's post-Covid recovery has been much weaker than expected, and deflationary pressures and a property crisis could have negative implications for the global economy.
Chinese released key data on Wednesday and all three releases beat expectations. GDP for Q3 rose 4.9% y/y, above the consensus estimate of 4.4% but well shy of second-quarter growth of 6.3%. Retail sales for September climbed 5.5% y/y, up from 4.6% in August and above expectations of 4.9%. Finally, industrial production was unchanged in September at 4.5% y/y, compared to the consensus estimate of 4.3%. China's economy may be in better shape than expected, but the road to recovery is likely to be a bumpy one.
AUD/USD is putting pressure on support at 0.6343. Below, there is support at 0.6240
0.6399 and 0.6430 are the next resistance lines
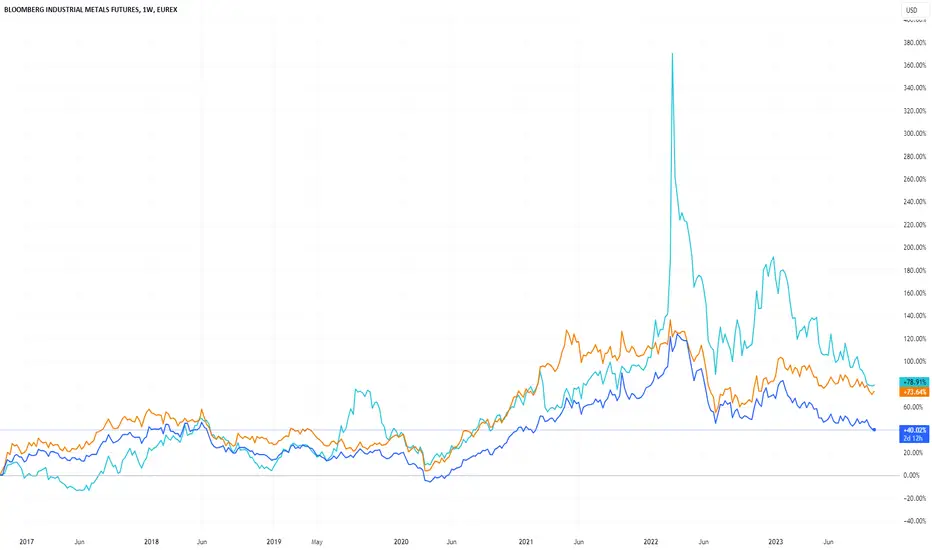
London Metals Exchange Week 2023 reviewAs London Metals Exchange Week 2023 wraps up, we summarise some of the key observations for the state of the base metals in 2023 and what are likely to drivers for the markets going into 2024.
Better than the macro data would indicate
Despite the challenging macroeconomic backdrop especially in China, metal demand is holding up fairly well. Demand indicators are generally holding up better than macroeconomic data would suggest, indicating other forces are at play. The main diver of the discrepancy is likely to be the shift in demand for metals coming from the energy transition.
The upside surprise in Chinese demand can be linked to accelerated grid spending in the country which is a metal intensive activity (Figure 1). China has ‘net zero’ ambitions and has been using this era of relatively low copper prices to accelerate the buildout of its grid infrastructure that will be essential for increasing the capacity of electric vehicles on its roads.
More broadly, China’s piece-meal stimulus activity is starting to bear fruits. Aggregate financing to the real economy has turned a corner after several months of disappointment and is now rising faster than consensus expectations, which could bode well for further metal demand. It’s worth noting that copper demand in China had not fallen as much as aggregate financing data would have indicated (Figure 2). We believe the stimulus will continue to support the metals market into 2024, although we note that China has not yet offered a big ‘bazooka’ of a stimulus package yet.
More metal supply in 2024
Markets are concerned that the supply outages in a range of metals could reverse course next year and therefore start to weigh on price. In its latest projections, the International Copper Study Group (ICSG) now envisages a massive supply surplus of 467,000 tonnes in 2024 (previously 298,000 tonnes). This is thanks to a considerable expansion of refined copper production, especially in China, though new production capacities in Indonesia, India and the US are also set to contribute to nearly 5% year-on-year production growth in 2024. However, the group maintain a deficit forecast in 2023 in the order of 27,000 tonnes, albeit a narrower deficit compared to their April forecast of 114,000 tonnes. Other metal study groups (such as the International Nickel Study Group, International Lead and Zinc Study Group) that met the prior week also expect higher supplies. However, we note that a lot of European metal smelters that went offline during the energy crisis of 2022 are unlikely to come back. Furthermore, these forecasts are based on all planned production coming to the market, which is rarely the case. Usually a 1-2% supply disruption takes place and that has the potential to significantly alter the balance.
Nickel oversupply spilling into Class 1
Market participants are increasingly worried about a Class 1 nickel oversupply in 2024. Indonesia’s mining and processing expansion has largely impacted Class 2 nickel. That is the material most suitable for meeting Chinese demand for nickel pig iron (NPI). High quality, Class 1 nickel, however, has been in a supply deficit in recent years. Class 1 has seen increasing demand from battery applications as electric vehicles expand production (and utilisation). However, conversion of Class 2 to Class 1 is looking increasingly economically feasible and Indonesia is at the forefront. There is even potential for a trade deal that could see Indonesian supply become Inflation Reduction Act compliant. That could see US battery demand be met by a new source of metal supply. At the same time, what was thought to be a localised shift to less nickel-intense battery technology in China, could become a more global trend. That is also a source of concern for the market.
Market developments
The London Metal Exchange (LME) Chief Executive Matthew Chamberlain announced at the main LME dinner that the LME has launched a new collaboration on product development with its Chinese rival, the Shanghai Futures Exchange (SHFE). The announcement came after news last month that SHFE was looking into the possible launch of a nickel futures contract for international use. A much larger proportion of industrial nickel use today is Class 2 rather than Class 1. China is seen as the main venue for transactions in Class 2 nickel and should have a greater role in benchmark price formation. The Class 1 LME contract thus has a degree of disconnect with the bulk of current industrial use and therefore has been seen as an imperfect hedging tool. While the LME didn’t offer much detail about its collaboration with the SHFE, an obvious area for joint work is in nickel.
Conclusions
Overall, the mood at the LME week was sombre, not just because of the geopolitical events that took place the weekend before the event. However, many were surprised at the strength of current demand. As we have highlighted, commodities tend to be late-cycle performers and we are likely seeing that in play in the current economic cycle. The energy transition is adding further fuel to metal demand that could help the complex during otherwise challenging times if a perfect soft-landing is not achieved.
This material is prepared by WisdomTree and its affiliates and is not intended to be relied upon as a forecast, research or investment advice, and is not a recommendation, offer or solicitation to buy or sell any securities or to adopt any investment strategy. The opinions expressed are as of the date of production and may change as subsequent conditions vary. The information and opinions contained in this material are derived from proprietary and non-proprietary sources. As such, no warranty of accuracy or reliability is given and no responsibility arising in any other way for errors and omissions (including responsibility to any person by reason of negligence) is accepted by WisdomTree, nor any affiliate, nor any of their officers, employees or agents. Reliance upon information in this material is at the sole discretion of the reader. Past performance is not a reliable indicator of future performance.
$GOLD Index - Q3/2023 *3M (Quarterly)
Looking at TVC:GOLD on the 3M(Monthly) Tf(Time-frame)
from an investor perspective view of positioning;
(long-term investing on the yellow stone)
we can see it sitting at no men's land at the current price,
as well Changing Character and Breaking Market Structer (Lower Low) in price action ;
(Lows of Q2)
Despite its Bearish Price Action on *3M ,
States and Central Banks around the World have continued accumulating,
spreading wide their balance sheets in-to TVC:GOLD Reserves .
And so have done many another States,
including 2 out of three Global Superpowers of
China ECONOMICS:CNGRES and Russia ECONOMICS:RUGRES
