CHINA STOCK A50 (another confirmation )hello dear trader
i am still in buy position ... we buy at bottom
we must waiting for target filll
good luck
Chinastocks

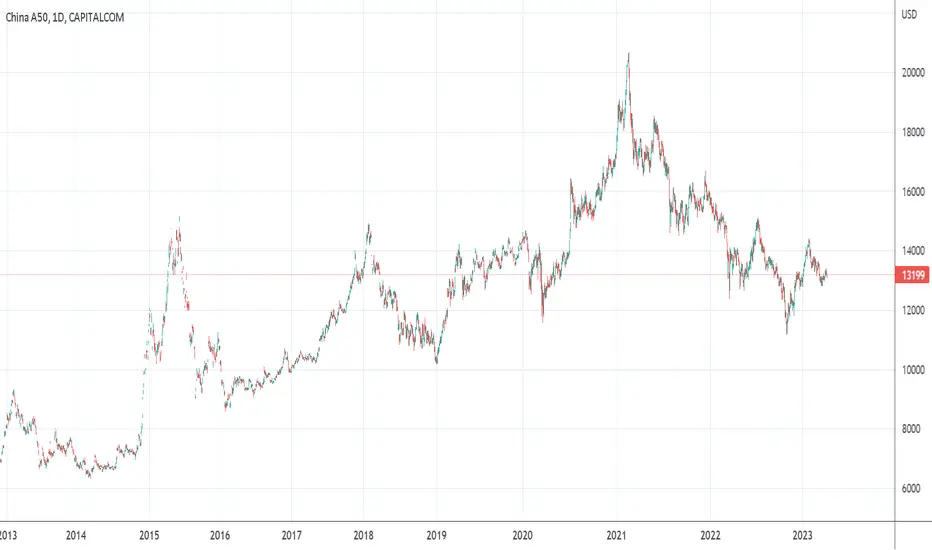
China A50 holds 12400 with conviction. Bullish breakout pending?The China A50 trades within a bearish channel on the daily chart, although we strongly suspect it wants to break out of it to the upside.
If you look at the steady stream of weak data coming out of China over the past few months, why is the China A50 not breaking to new lows? In fact, each time the market has pulled back to the 12,400 area since early June buyers have stepped in. And they returned in force yesterday to produce a strong bullish engulfing candle at support.
Bulls could either wait for a break of the 12,857 high to confirm breakout. But if confident that some sort of ‘plunge protection team’ is defending the 12,400 level, any pullback towards it may prove to be a gift for bulls who are anticipating a countertrend breakout.

NIO Options Ahead of EarningsIf you haven`t bought NIO here:
Then Analyzing the options chain of NIO prior to the earnings report this week,
I would consider purchasing the 8usd strike price Calls with
an expiration date of 2023-7-21,
for a premium of approximately $0.65.
If these options prove to be profitable prior to the earnings release, I would sell at least half of them.
Looking forward to read your opinion about it.
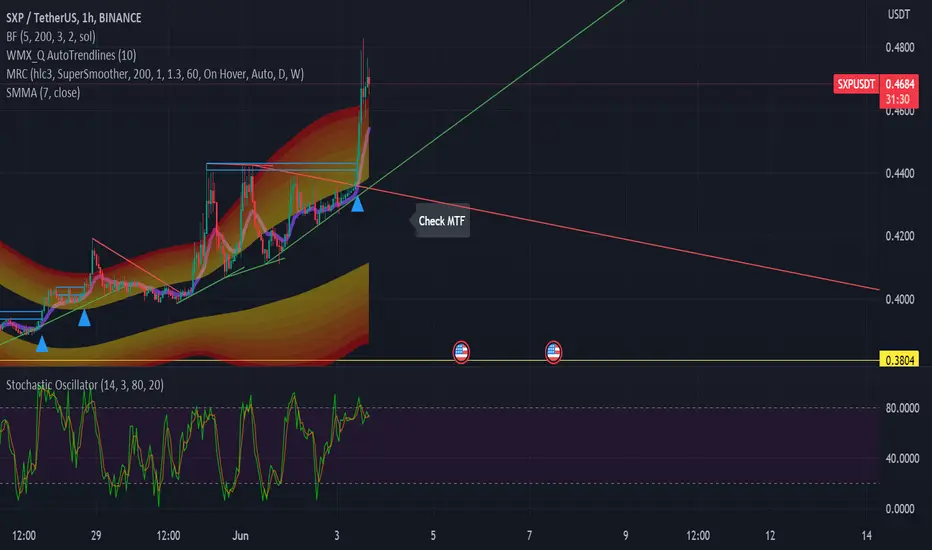
SXP retest and trip to the topChina narrative coin made its full top to bottom after the huge FVGs it created last pump so now we watch the rise.
china A50 (bottom here)hello dear trader
this price action of (chinaA50)
FTSE China A50 Index is a stock market index by FTSE Group, the components were chosen from Shanghai Stock Exchange and Shenzhen Stock Exchange, which issue A-share; B-share were not included. Other similar product were CSI 300 Index by China Securities Index Company and "Dow Jones China 88 Index" by S&P Dow Jones Indices
price can reverse in this area because : PRZ fibou 0.618 + priceaction level
good luck

VIPS Vipshop to $25 as China RecoversVIPS is one of the best looking China stocks at the moment. It is a similar business to JD except about 1/10 the marketcap. I am long VIPS looking for some strong action into the low to mid 20s over the next few months. stop is a close under $12

The Chinese low float that could run!LICN has been on our radar ever since it broke out of a VCP type setup. The stock ran into resistance and now has seen a heavy amount of trading around the $2.30 - $2.50 range.
In our opinion, the stock provides a low risk, high reward setup with our target being the AVWAP from the IPO high.
Strong support is current present from the rising 50 day MA and the AVWAP from the all time low.

The AVWAP from the June 2022 highs now belong to the buyers!A good long setup here with earnings out of the way. The stock gapped up on heavy volume after a good earnings report. This gap up also happened to be above the AVWAP from the June highs.
Currently the stock is consolidating after the strong run up from the $21 area all the way towards the $30 area.
In my opinion, the $26 - $27 range provides a good buying opportunity in anticipation of a move towards the $40 level.

BABA Alibaba Options Ahead of EarningsIf you haven`t sold BABA here:
and bought it here:
Now Analyzing the options chain of BABA Alibaba prior to the earnings report this week,
I would consider purchasing the 90usd strike price Calls with
an expiration date of 2023-6-16,
for a premium of approximately $4.45
If these options prove to be profitable prior to the earnings release, I would sell at least half of them.
Looking forward to read your opinion about it.

iHuman - A stock just breaking out in stage 2iHuman in FY2022 put its first ever profitable financial year. On top of this, despite rough macro conditions in #china, the company has been able to grow its revenue on an YoY basis.
Margins remains strong and with the reopening of China, earnings momentum is very likely to come back again. Gross margins are at 70%.
After a series of quarterly NI losses, they have put in 4 consecutive quarters of positive growth.
Liquidity position has improved rapidly (Current ratio from 2018 to 2022 has grown from 0.22 to 2.19).
They barely have any debt and their cash per share is 2.86 and book value of 2.10 as of Dec 2022.
Adjust cash per share and you are buying this stock for 90cents.
The stocks PE is 8.67x while its industry PE is 18x.
Technically, the stock is still a fresh stage 2. A couple of sessions back, IH managed to breakout above its AVWAP from the most recent high on strong volume. With the recent throwback on very low volume, a long entry with a stop below 3.03 seems a solid trade.
Target price is around 5.00 - 5.30 assuming prices have a successful breakout above 4.30 - With a risk of 73c and a target worth 154c, the trade provides a R/R of 1:2.11

VIPS (Long) - Undervalued Outperforming Chinese GemFundamentals
The Chinese market has not performed rather well year-to-date, which makes the price action of VIPS that more impressive .
Despite the wider market struggling, the firm showed strong growth last year with 35% growth in earnings. The recovering Chinese market might propel even more demand (which is the Chinese government actively supporting) and of which NYSE:VIPS would be one of the major beneficiaries
The company is also quite undervalued with P/E = 9.8 and P/S = 0.6
The fundamentals are pristine with negligible amount of debt and high returns on equity and assets
The market is smelling internal strength and earnings next week might serve as a perfect propellent to rocket the stock out of the base
Technicals
The company has been basing and creating a rounding base since the start of the year
My main selling point is the impressive relative strength . While the Chinese tech market has been deteriorating since the start of the year, VIPS has been standing strong, buying back every possible breakdown. I have been actively watching price action on this stock for two months and investors are actively buying any potential downside.
Relative strength against AMEX:KWEB is shown at the bottom of the chart, clearly pointing higher; RSI is breaking above 60; MACD is breaking out; stochastics are showing strength and the A/D line has been strengthening throughout the basing process
Overall, the pattern very much looks like a bull flag about to break out
Trade
One option is to enter now and catch a perfect buy point, but then there is a need to risk a negative earnings surprise (I chose this option and entered today)
Or wait until after the earnings which would be safer but risking a worse buying point; decision is up to your risk appetite
Follow me for more analysis & Feel free to ask any questions you have, I am happy to help
If you like my content, Please leave a like, comment or a donation , it motivates me to keep producing ideas, thank you :)

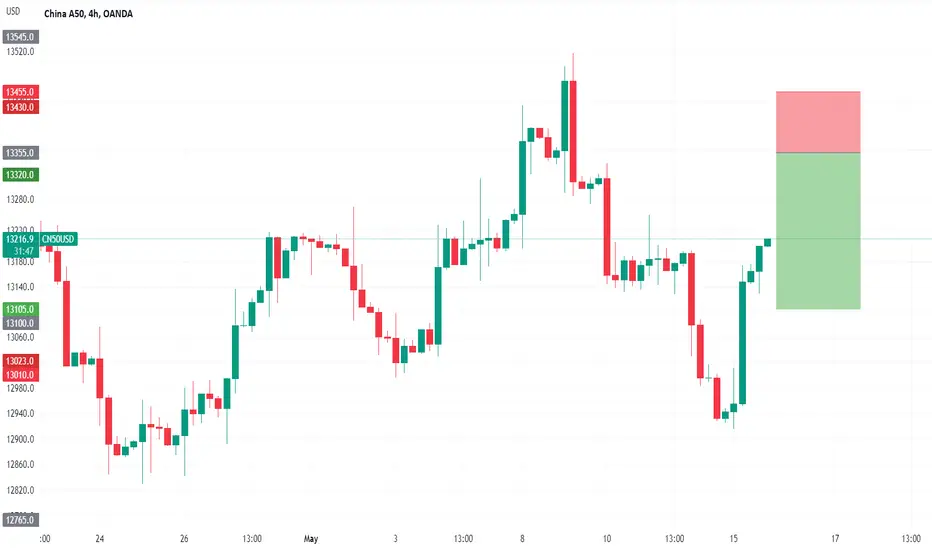
Looking for CN50 rallies.CHN50 - 24h expiry
Buying pressure from 12916 resulted in prices rejecting the dip.
The current move higher is expected to continue.
The bias is still for lower levels and we look for any gains to be limited.
We therefore, prefer to fade into the rally with a tight stop in anticipation of a move back lower.
Further downside is expected although we prefer to sell into rallies close to the 13355 level.
We look to Sell at 13355 (stop at 13455)
Our profit targets will be 13105 and 13055
Resistance: 13660 / 14440 / 15080
Support: 12790 / 12400 / 11845
Risk Disclaimer
The trade ideas beyond this page are for informational purposes only and do not constitute investment advice or a solicitation to trade. This information is provided by Signal Centre, a third-party unaffiliated with OANDA, and is intended for general circulation only. OANDA does not guarantee the accuracy of this information and assumes no responsibilities for the information provided by the third party. The information does not take into account the specific investment objectives, financial situation, or particular needs of any particular person. You should take into account your specific investment objectives, financial situation, and particular needs before making a commitment to trade, including seeking advice from an independent financial adviser regarding the suitability of the investment, under a separate engagement, as you deem fit.
You accept that you assume all risks in independently viewing the contents and selecting a chosen strategy.
Where the research is distributed in Singapore to a person who is not an Accredited Investor, Expert Investor or an Institutional Investor, Oanda Asia Pacific Pte Ltd (“OAP“) accepts legal responsibility for the contents of the report to such persons only to the extent required by law. Singapore customers should contact OAP at 6579 8289 for matters arising from, or in connection with, the information/research distributed.
CN50 to find support at previous resistance?CHN50 - 24h expiry
Selling posted in Asia.
The current move lower is expected to continue.
Short term bias has turned positive.
We therefore, prefer to fade into the dip with a tight stop in anticipation of a move back higher.
Further upside is expected although we prefer to buy into dips close to the 13200 level.
We look to Buy at 13205 (stop at 13125)
Our profit targets will be 13405 and 13445
Resistance: 13660 / 14440 / 15080
Support: 13180 / 12790 / 12400
Please be advised that the information presented on TradingView is provided to Vantage (‘Vantage Global Limited’, ‘we’) by a third-party provider (‘Signal Centre’). Please be reminded that you are solely responsible for the trading decisions on your account. There is a very high degree of risk involved in trading. Any information and/or content is intended entirely for research, educational and informational purposes only and does not constitute investment or consultation advice or investment strategy. The information is not tailored to the investment needs of any specific person and therefore does not involve a consideration of any of the investment objectives, financial situation or needs of any viewer that may receive it. Kindly also note that past performance is not a reliable indicator of future results. Actual results may differ materially from those anticipated in forward-looking or past performance statements. We assume no liability as to the accuracy or completeness of any of the information and/or content provided herein and the Company cannot be held responsible for any omission, mistake nor for any loss or damage including without limitation to any loss of profit which may arise from reliance on any information supplied by Signal Centre.

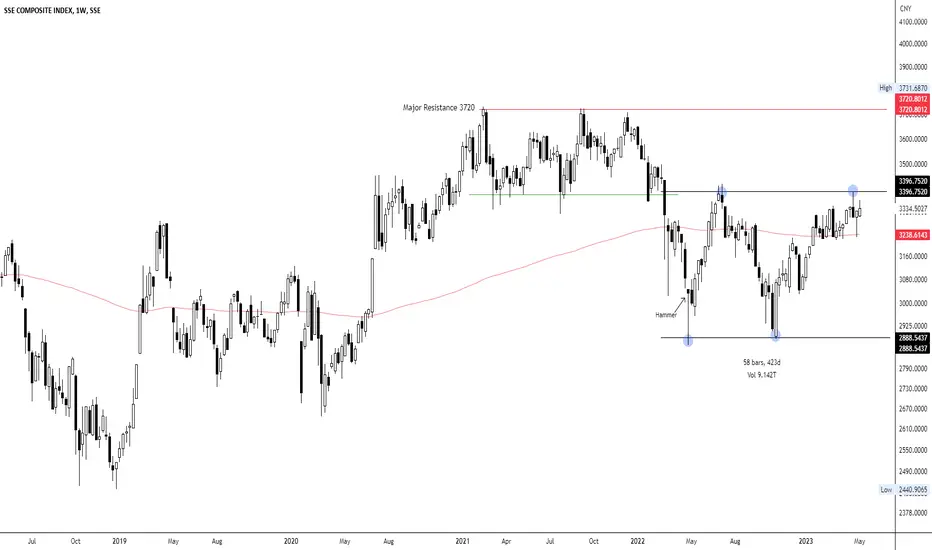
SSE Composite Index WCA - Classic Rectangle Introduction:
Hello and thank you for taking the time to read my post. Today, we analyze the SSE Composite Index on the weekly scale, focusing on a classic price pattern called the "Rectangle Pattern." The SSE Composite Index is the most important stock index in China, excluding Hong Kong. It is a price index weighted by market capitalization and includes all public companies listed on the Shanghai Stock Exchange. The index is published by the China Securities Index Company. Analyzing an index helps enormously with top-down approaches, as it provides a broader perspective of the market and allows investors to gauge the overall sentiment before diving into individual stocks.
Rectangle Pattern:
The rectangle pattern is a chart pattern formed when the price of an asset moves between two parallel horizontal lines—representing support and resistance levels—over a period of time. In essence, it reflects a consolidation phase where the market is undecided about the direction of the trend.
Remember, this is just a brief introduction to the technical aspects of the rectangle pattern. As you delve deeper into this topic, you'll discover more nuances and practical applications that can enhance your trading strategies.
Additional Analysis:
On the SSE Composite Index chart, we can observe some fascinating insights. The general trend was downward until 25/04/2022, which changed with the formation of a hammer. Since then, the price has been bound within a range, which is depicted as a classic rectangle pattern. This pattern has been forming for 423 days, which is notable because the longer a pattern remains consistent, the higher the probability that the subsequent breakout will be volatile.
The support of the range is at 2890, while the resistance is at 3400. Currently, the price is above the 200 EMA, making a long entry more attractive. We will closely monitor the price pattern and wait for a break above 3400 while examining the sectors or stocks from the SSE Composite Index more closely. The next potential resistance after 3400 would be 3720.
Top-Down Approach Significance:
A top-down approach is a method that investors use to analyze the market, beginning with a broad overview and then narrowing down to individual stocks. This method helps investors identify the overall market sentiment and trends, allowing them to make more informed decisions when selecting stocks within specific sectors or industries. Analyzing the SSE Composite Index, as shown in this post, provides a valuable starting point for investors looking to employ a top-down approach in their decision-making process.
Conclusion:
The SSE Composite Index weekly chart showcases a classic Rectangle Pattern, reflecting a consolidation phase in the market. By closely monitoring the support and resistance levels, as well as the general trend, traders can be better prepared for any potential price action in the future. Utilizing a top-down approach enables investors to gain a broader perspective and make more informed decisions when selecting stocks. As always, it's essential to consider risk management and proper position sizing when trading based on chart patterns.
Please note that this analysis is not financial advice. Always do your own due diligence when investing or trading.
If you found this analysis helpful, please like, share, and follow for more updates. Happy trading!
Best regards,
Karim Subhieh
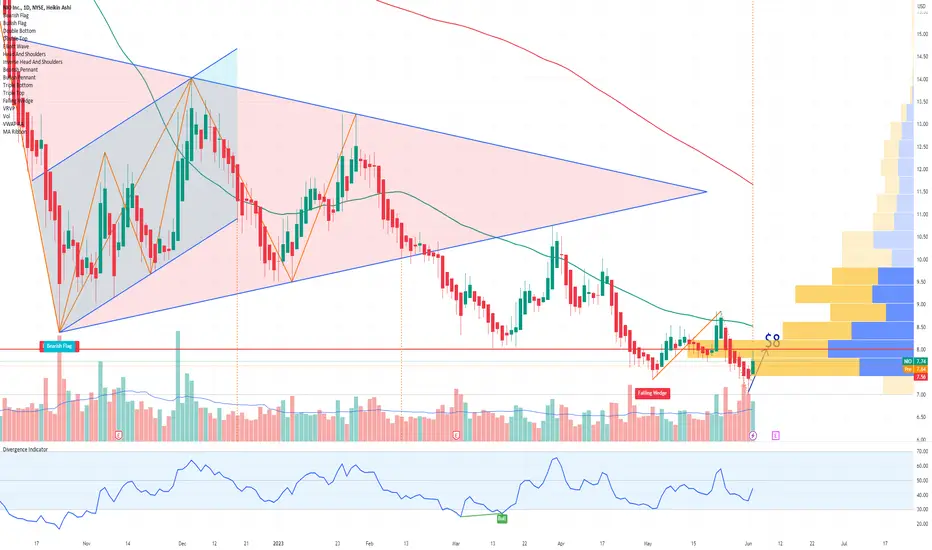
NIO is on a bounceNIO has descended into its demand zone as shown on the 2H Chart.
It is now above the POC line of the near-term volume profile.
I will take a trade here setting a stop loss of 7.33 below the near-term high
volume area. The first target will be 7.6 which is approximately the anchored
VWAP ( thick black line ) confluent with the POC line of the intermediate
term volume profile to take half the profits. The remainder of the position
will target 8.9 which is just below the selling volume shelf at 9.0.
Tipranks has a longer term target of 14 ( see the link below)

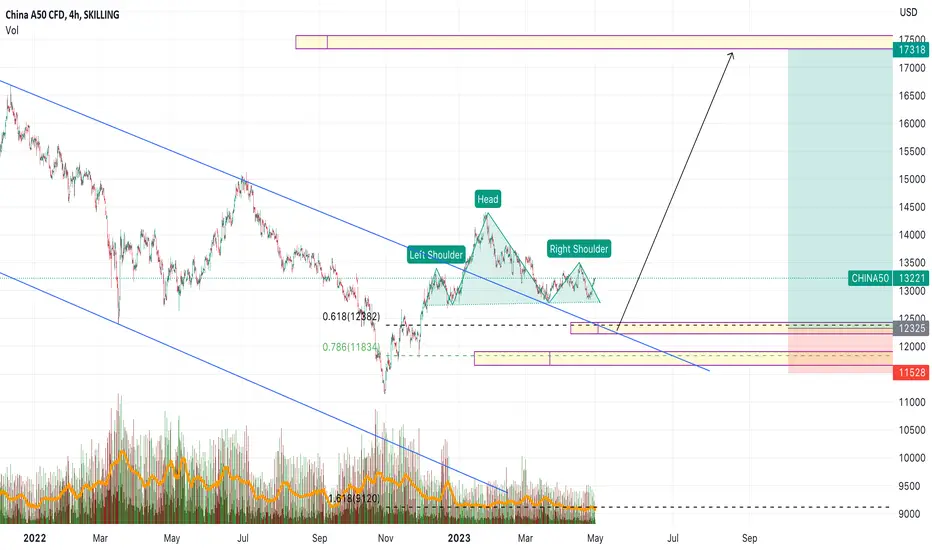
China A50 hello traders
i am looking for buy zone in chinna A50 , you can see this head and shoulder ... you can buy in the price reversal zone on fibo 0.618 + and dynamid supourt ...
what is A50????
The FTSE China A50 Index is the benchmark for investors to access the China domestic market through A Shares – securities of companies incorporated in mainland China and traded by Chinese and institutional investors under the Qualified Foreign Institutional Investor and Renminbi Qualified Foreign Institutional Investor (QFII & RQFII) regulation. It is a real-time, tradable index comprising the largest 50 A Share companies by full market capitalisation of the securities listed on the Shanghai and Shenzhen stock exchanges.
The FTSE China A50 Index is a free-float adjusted, liquidity-screened index. It is reviewed quarterly in March, June, September and December to ensure the index remains representative of the underlying China market. The index offers the optimal balance between representativeness and tradability for China’s A Share market. It can be used as the basis for on-exchange and OTC derivative products, mutual funds and ETFs.
TOP Financial GroupI think I may have been the first person in the world to call it back in November 2022.
Next one I ride ;0
Let me know if you want more tips I got many! ;)

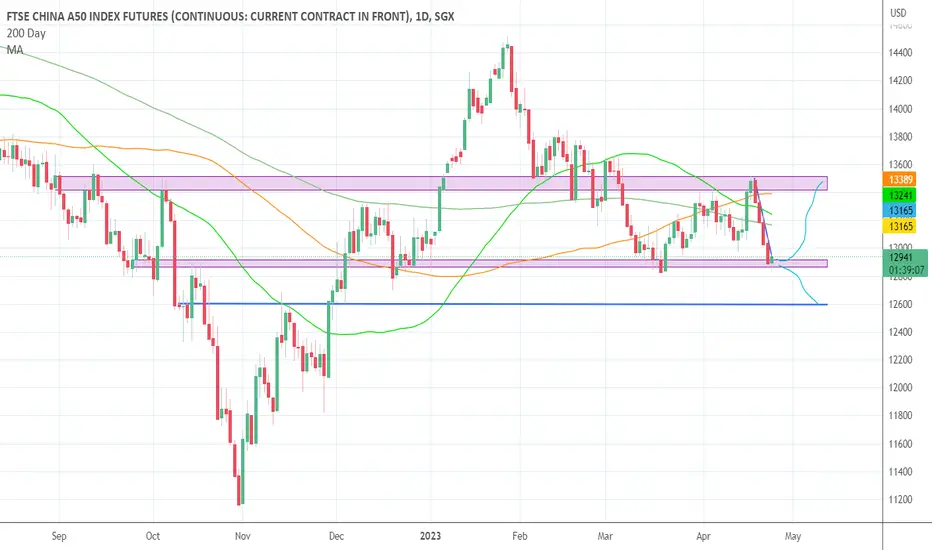
Decisive moment for A50 We are getting closer to a decisive moment for A50. Hold the box and run back to 13.4k-13.5k or lose it and go down to 12.6k. No trade zone now, wait for breakdown or breakup. NFA.
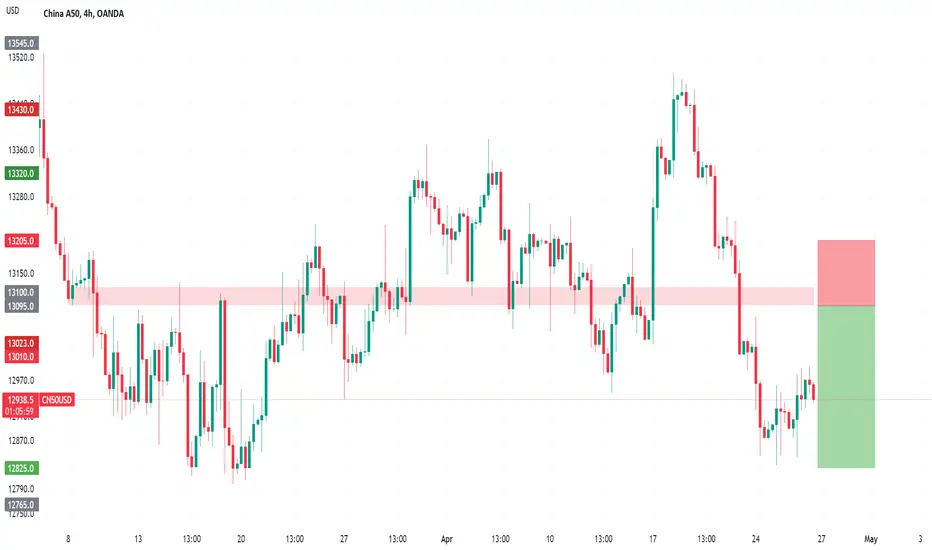
China50 to see a limited rally?CHN50 - 24h expiry -
Buying pressure from 12830 resulted in prices rejecting the dip.
The current move higher is expected to continue.
With the Ichimoku cloud resistance above we expect gains to be limited.
We therefore, prefer to fade into the rally with a tight stop in anticipation of a move back lower.
Further downside is expected although we prefer to sell into rallies close to the 13100 level.
We look to Sell at 13095( stop at 13205)
Our profit targets will be 12825 and 12765
Resistance: 13180 / 13660 / 14440
Support: 12790 / 12400 / 11845
Risk Disclaimer
The trade ideas beyond this page are for informational purposes only and do not constitute investment advice or a solicitation to trade. This information is provided by Signal Centre, a third-party unaffiliated with OANDA, and is intended for general circulation only. OANDA does not guarantee the accuracy of this information and assumes no responsibilities for the information provided by the third party. The information does not take into account the specific investment objectives, financial situation, or particular needs of any particular person. You should take into account your specific investment objectives, financial situation, and particular needs before making a commitment to trade, including seeking advice from an independent financial adviser regarding the suitability of the investment, under a separate engagement, as you deem fit.
You accept that you assume all risks in independently viewing the contents and selecting a chosen strategy.
Where the research is distributed in Singapore to a person who is not an Accredited Investor, Expert Investor or an Institutional Investor, Oanda Asia Pacific Pte Ltd (“OAP“) accepts legal responsibility for the contents of the report to such persons only to the extent required by law. Singapore customers should contact OAP at 6579 8289 for matters arising from, or in connection with, the information/research distributed.
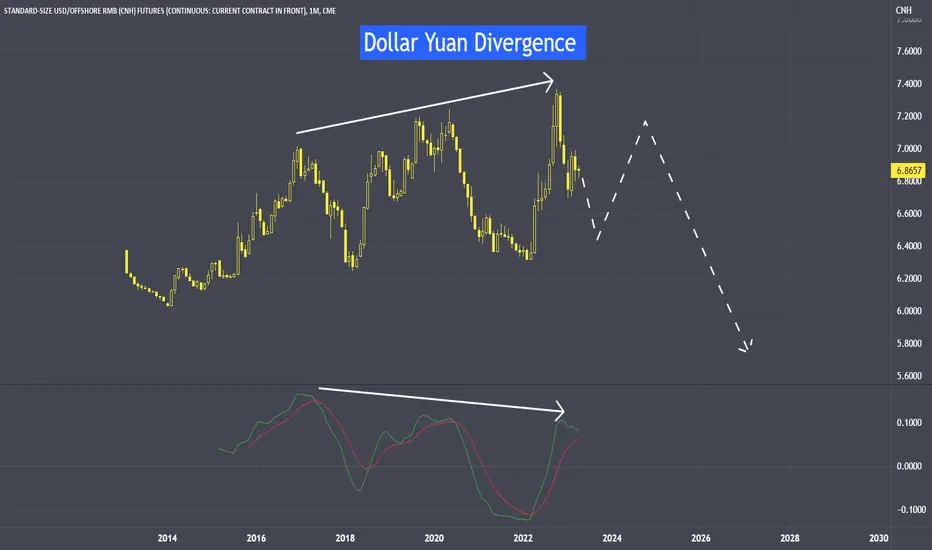
Dollar vs Yuan Divergence US Dollar vs Yuan or US Dollar vs Offshore Yuan, technically they are establishing divergence. Above chart is my projection in time to come.
When Dollar vs Yuan moves lower, this means we are seeing a weaker Dollar and a stronger Yuan. See the following link for its video version.
The Chinese yuan, also known as RMB, is the official currency of China. It is used both onshore in mainland China and offshore in international markets.
The offshore yuan, also known as the CNH (Chinese yuan - Hong Kong), is the version of the yuan that is traded outside of mainland China. It is traded in offshore financial centers, such as Hong Kong, Singapore, and London. The offshore yuan is not subject to the same restrictions and regulations as the onshore yuan.
The main difference between the onshore and offshore yuan is that the onshore yuan is subject to capital controls imposed by the Chinese government, while the offshore yuan is not subject to these same restrictions. This means that the offshore yuan is more freely tradable and can be used for a wider range of international transactions, such as international trade and investment, while the onshore yuan is more restricted in its use.
Offshore Yuan -
Standard-Size USD/Offshore RMB (CNH)
Outright:
0.0001 per USD increment = 10 CNH
MICRO USD/CNH FUTURES
0.0001 offshore Chinese renminbi per USD
CNH Option
Google search:
USD/CNH Monthly Options Contract Specs - CME Group
Google search
Frequently Asked Questions: USD/CNH options - CME Group
Disclaimer:
• What presented here is not a recommendation, please consult your licensed broker.
• Our mission is to create lateral thinking skills for every investor and trader, knowing when to take a calculated risk with market uncertainty and a bolder risk when opportunity arises.
CME Real-time Market Data help identify trading set-ups in real-time and express my market views. If you have futures in your trading portfolio, you can check out on CME Group data plans available that suit your trading needs tradingview.sweetlogin.com
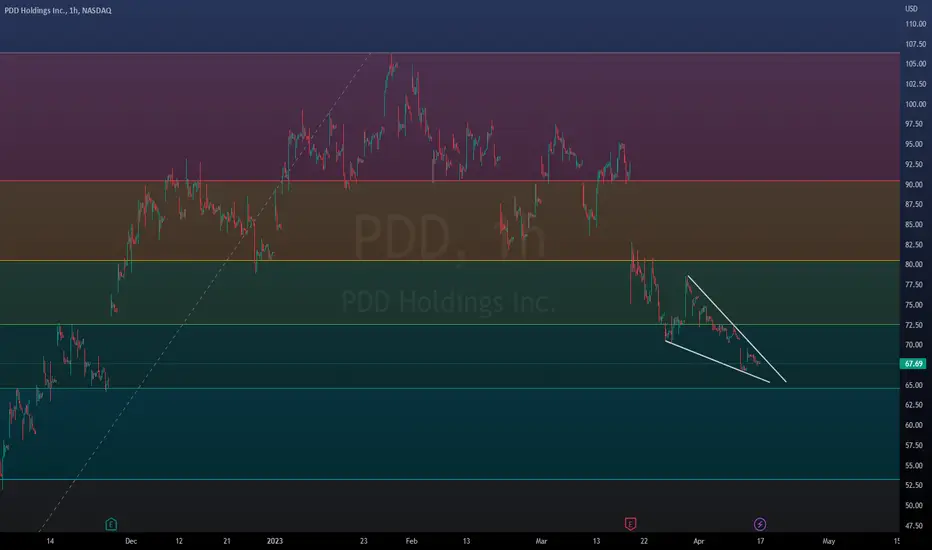
Falling wedge on $PDD There appears to be a falling wedge pattern on NASDAQ:PDD around the HKEX:65 area also lines up with 0.618 Fib. RSI is near oversold and Stochastic is curling up. This area has acted well as both support and resistance previosly.
'Can China’s Long-Term Growth Rate Exceed 2–3 Percent?' SummaryThis is a summary of Michael Pettis' 'Can China’s Long-Term Growth Rate Exceed 2–3 Percent?' carnegieendowment.org
As the text was quite long, this summarizes some critical points.
China's high investment share of GDP and growing debt burden are interrelated, stemming from an investment-driven growth model that began in the 1980s when the country needed significant investment in infrastructure, urban property development, and manufacturing facilities. High domestic investment required high domestic savings, leading to a rapid savings increase by constraining household consumption and income growth. Policymakers now recognize the need to rebalance China's economy towards domestic consumption.
High investment levels initially benefited the Chinese economy, as productive investment grew at the fastest pace in history. However, a successful development model should make itself obsolete, and China has closed the gap between its actual investment level and the level its businesses and workers can productively absorb. As productivity benefits of additional investment decline, more investment begins to generate less economic value than the value of employed resources. This can be observed in China's increasing debt numbers.
Countries that followed this growth model experienced a period of rapid, sustainable growth with stable debt levels, followed by a period of rapid, unsustainable growth driven by a surging debt burden. China entered this phase around fifteen years ago. Therefore, the investment share of China's GDP must decline sharply in the next few years, as the conditions that made high investment levels sustainable no longer exist. Historical precedents suggest that reducing the investment share of GDP to a sustainable level is better for the economy's long-term health, growth, and stability.
In this context, rebalancing the Chinese economy will require significant adjustments in its economic structure. Beijing must focus on boosting domestic consumption, though this would likely result in a decline in China's annual GDP growth to around 2-3 percent for many years. The current investment share of GDP is extraordinarily high, making it difficult to reduce it without significantly affecting overall economic activity.
Policymakers in Beijing have increasingly called for an expansion in the role of consumption, but there are significant political constraints in implementing such policies. Rebalancing would require consumption to grow faster than GDP and GDP to grow faster than investment. This implies transferring income from governments and businesses to households, a process that has not yet seen concrete proposals.
The decline in growth will be unevenly distributed, with local governments bearing the brunt of the adjustment while ordinary Chinese people experience less impact. This also means that sectors of the global economy that depend on Chinese investment growth will be more affected, while those reliant on Chinese consumption will be less impacted.
China's investment share of GDP currently stands at around 42-44 percent, which is unsustainable in the long run. For the purposes of this analysis, it is assumed that China should reduce its investment share to 30 percent over ten years, a level typical of rapidly developing economies. As investment declines, the consumption share of GDP must rise.
Michael presents five scenarios under which China can rebalance its economy:
A. Rebalance with a surge in consumption: China's consumption would need to grow by 6-7% annually, while investment grows by 0-1% annually, resulting in a GDP growth rate of 4% over ten years. However, this requires politically difficult income transfers from local governments and wealthy individuals to households.
B. Rebalance while maintaining current consumption growth rates: Consumption growth would remain at 3-4%, with investment contracting by 1-2% annually. This would lead to an average annual GDP growth rate of 1.5% over ten years.
C. Rebalance with a sharp decline in consumption growth: If consumption growth drops to 1-2% annually, the investment must decline by nearly 3% annually, leading to flat GDP growth.
D. Rebalance with a sharp contraction in GDP: This scenario involves a short-term, severe GDP contraction but is considered politically disruptive and unlikely.
E. Rebalance over a much extended period: If China takes 15-20 years to rebalance, with consumption growth at 3-4% annually, GDP growth will drop to 2% and 2.5%, respectively.
Key points include the limited ways China can rebalance, the difficulty in maintaining a high investment share indefinitely, and the necessity of a surge in consumption growth for a more balanced economy. Rebalancing will involve slower GDP growth without faster consumption growth, driven by significant and politically challenging income transfers.
In conclusion, China's rebalancing process will require significant adjustments in its economic structure. The country must reduce its reliance on investment and increase the role of consumption in driving growth. However, the political constraints and the impact on various sectors of the economy make this a challenging task for policymakers. The five scenarios presented illustrate the complexities of the rebalancing process and emphasize the need for a well-thought-out and carefully executed strategy.
China's future economic health depends on its ability to navigate these challenges and transition to a more sustainable growth model. Beijing must strike a delicate balance between addressing political constraints and implementing policies that promote consumption growth while minimizing the negative impacts on various sectors and local governments.
Moreover, the global economy is intricately connected to China's growth trajectory. As China undertakes the rebalancing process, the repercussions will be felt in sectors reliant on Chinese investment and consumption. Businesses and governments worldwide must closely monitor the situation and adapt to these changes.
This analysis highlights the importance of understanding the complexities of China's rebalancing process and its implications for the Chinese and global economies. As China grapples with these challenges, the world must brace itself for the changes arising from this monumental shift in the world's second-largest economy. Only time will tell if China's rebalancing efforts will successfully pave the way for a more stable and sustainable economic future.
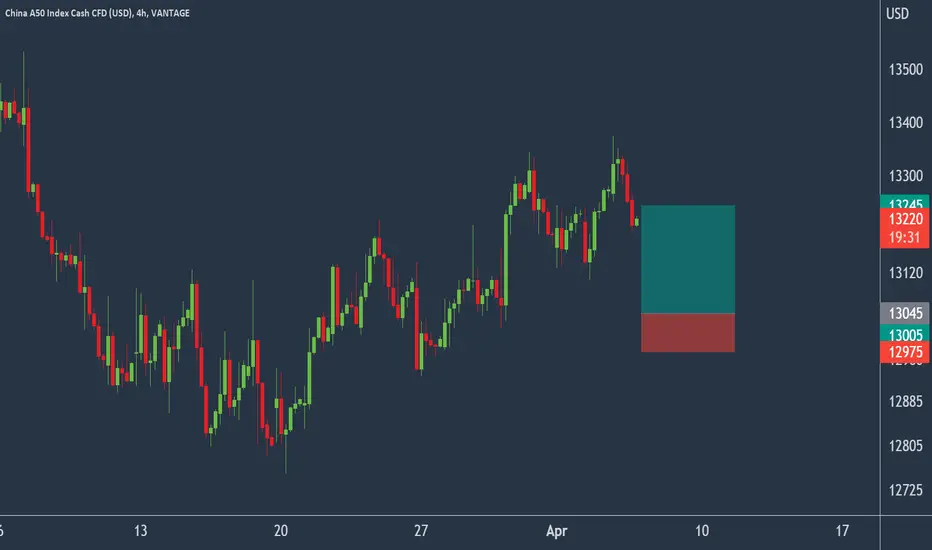
Lower correction expected from CN50.CHN50 - 24h expiry - We look to Buy at 13045 (stop at 12975)
There is no sign that this bullish momentum is faltering but the pair has stalled close to a previous swing high of 13369.
Price action looks to be forming a top.
A lower correction is expected.
Short term bias is mildly bullish.
We therefore, prefer to fade into the dip with a tight stop in anticipation of a move back higher.
Our profit targets will be 13245 and 13660
Resistance: 13660 / 14440 / 15080
Support: 13180 / 12790 / 12400
Please be advised that the information presented on TradingView is provided to Vantage (‘Vantage Global Limited’, ‘we’) by a third-party provider (‘Signal Centre’). Please be reminded that you are solely responsible for the trading decisions on your account. There is a very high degree of risk involved in trading. Any information and/or content is intended entirely for research, educational and informational purposes only and does not constitute investment or consultation advice or investment strategy. The information is not tailored to the investment needs of any specific person and therefore does not involve a consideration of any of the investment objectives, financial situation or needs of any viewer that may receive it. Kindly also note that past performance is not a reliable indicator of future results. Actual results may differ materially from those anticipated in forward-looking or past performance statements. We assume no liability as to the accuracy or completeness of any of the information and/or content provided herein and the Company cannot be held responsible for any omission, mistake nor for any loss or damage including without limitation to any loss of profit which may arise from reliance on any information supplied by Signal Centre.