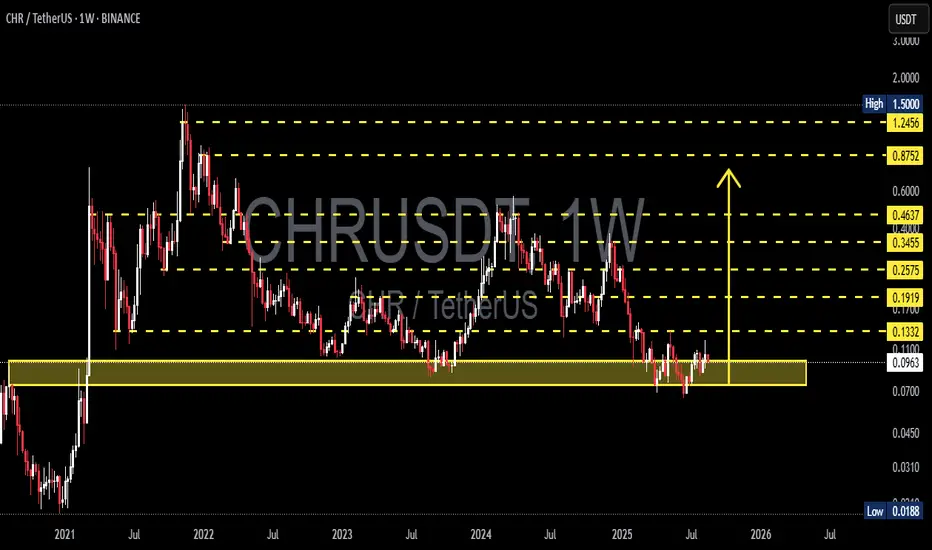
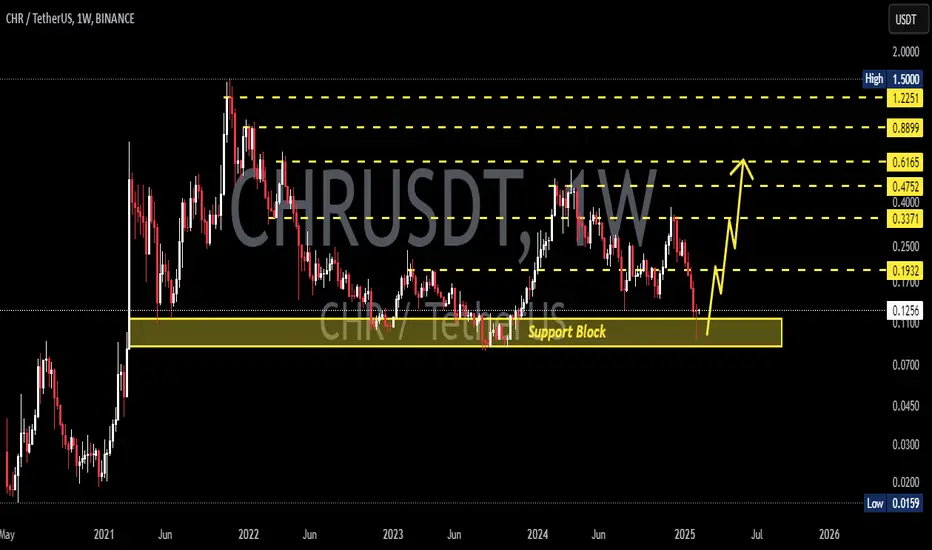
CHR/USDT — Sitting on Demand Zone, Rebound or Breakdown Ahead?CHR/USDT is currently trading around $0.0971, right inside the historical demand zone $0.07–0.12, which has been a strong accumulation area since 2021.
This zone has acted as a launchpad for multiple rallies, but at the same time, it holds a pool of equal lows liquidity that could be swept if buyers fail to defend it.
Key technical levels from the chart:
Major demand/support: 0.0700 – 0.0900
Step resistances: 0.1100 – 0.1332 – 0.1710 – 0.1919 – 0.2575 – 0.3455 – 0.4637 – 0.8752 – 1.2456 – 1.5000
Historical low: 0.0188
---
🔹 Market Structure & Pattern
Price is building a multi-year horizontal accumulation base between 0.07–0.12.
Each historical rally was triggered from this zone, making it a high-value demand block.
However, repeated tests without a strong breakout increase the risk of demand exhaustion and potential breakdown.
In other words, this area can either act as the foundation of the next bull rally or the last line before capitulation.
---
🟢 Bullish Scenario
Bias remains bullish as long as 0.0700 holds.
First trigger: A weekly close above 0.1100 → opens the path toward 0.1332.
Stronger confirmation: A break and close above 0.1332 → sets targets at 0.1710 → 0.1919.
Mid-term swing targets: 0.2575 → 0.3455.
In case of a full bullish cycle, reclaiming higher zones around 0.4–0.8 and even 1.2–1.5 remains possible.
---
🔴 Bearish Scenario
Warning sign: A weekly close below 0.0900 suggests fading buyer strength.
A breakdown below 0.0700 would unlock deeper downside: 0.0450 → 0.0310, with extreme risk toward the historical low at 0.0188.
This would mark a failed demand block and transition into a bearish market structure.
---
🎯 Conclusion & Strategy
CHR/USDT is at a critical crossroad:
Bullish case: Holding above 0.07–0.12 keeps the rebound potential alive.
Bearish case: Losing 0.07 would confirm structural weakness and open deeper downside.
💡 For aggressive traders: consider accumulation within the current zone with a tight stop below 0.0700.
💡 For conservative traders: wait for a weekly close >0.1332 as confirmation before entering long, targeting 0.1710–0.1919.
#CHRUSDT #Chromia #CryptoAnalysis #AltcoinTrading #PriceAction #SupportResistance #SwingTrading #CryptoTA #WeeklyChart
Chrusdtanalysis
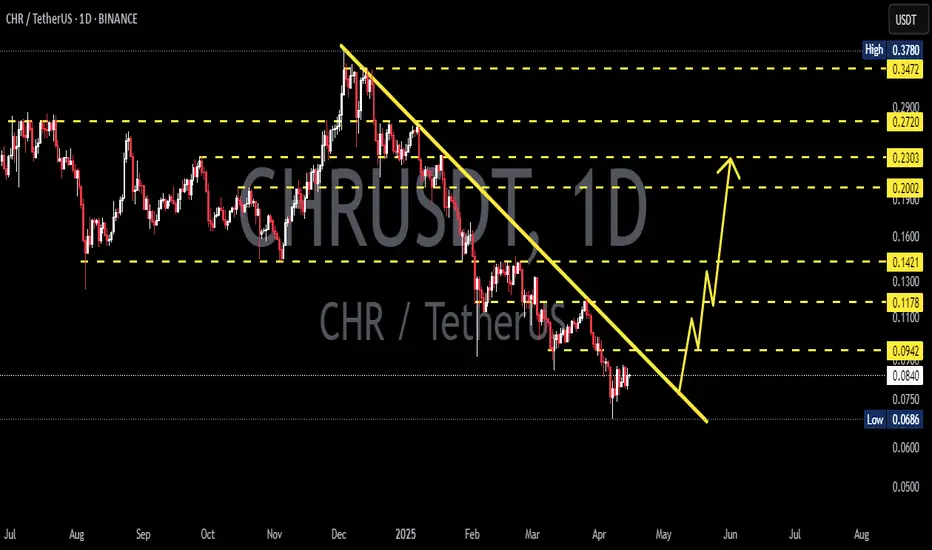
CHR/USDT Major Breakout! Bullish Momentum Ignites🧠 Complete Technical Analysis:
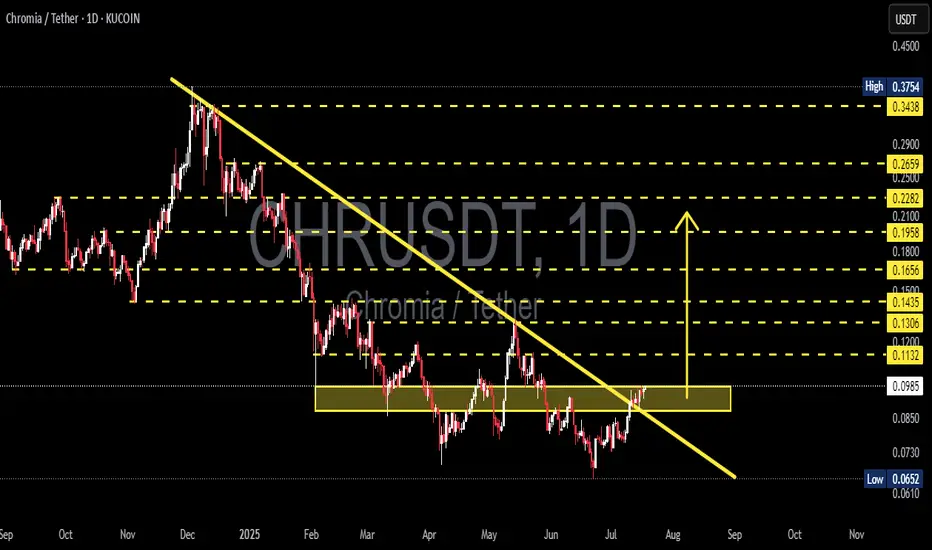
After months of being trapped in a prolonged downtrend since December 2024, Chromia (CHR) has finally shown signs of awakening. The price has successfully broken out of a major descending trendline, while also breaching a critical consolidation resistance zone between $0.093–$0.098 (highlighted in yellow).
This breakout not only indicates a potential trend reversal, but also opens the door for a medium-term bullish rally if sustained.
📊 Structure and Pattern Highlights:
Descending Trendline Breakout: CHR has decisively broken out of the long-standing bearish structure.
Validated Accumulation Zone: The $0.075–$0.098 range has proven to be a strong accumulation base after multiple tests.
Layered Horizontal Resistances: A clear ladder of resistance levels awaits as price pushes upward.
Potential Bullish Patterns: With a healthy pullback and higher low, CHR could form an Inverse Head and Shoulders or a Bullish Flag continuation pattern.
📈 Bullish Scenario:
If CHR can hold daily candle closes above the $0.098 breakout zone, the following targets come into play:
Target Level Description
$0.113 Breakout confirmation zone
$0.120 Psychological mini-resistance
$0.130 Historical horizontal resistance
$0.143 Previous local top
$0.165 Key breakdown level
$0.180 – $0.228 Medium-term target range with historical supply
$0.265 – $0.290 Strong resistance area from past distribution
$0.343 – $0.375 Long-term bullish target
💡 Note: If buying volume increases and BTC remains stable or bullish, these targets become increasingly realistic.
📉 Bearish Scenario:
However, if this breakout turns out to be a fakeout, CHR may fall back below the $0.093 zone and retest:
$0.085 (minor support)
$0.075 (base support)
As low as the demand zone around $0.065–$0.070
📌 Candle close and volume confirmation are critical. Avoid chasing price without solid validation!
📎 Conclusion & Strategy:
> CHR/USDT is currently at a pivotal moment. This breakout from a multi-month downtrend signals a potential trend reversal and a medium-term opportunity for swing traders and position holders.
📈 Trading Strategy Suggestion:
Entry: After a successful retest of the $0.095–$0.098 zone
Stop Loss: Below $0.085
Take Profit: Scale out at resistance levels listed above
#CHRUSDT #Chromia #CryptoBreakout #TrendReversal #AltcoinSeason #TechnicalAnalysis #CryptoTrading #BullishPattern #BreakoutSignal #ChartSetup
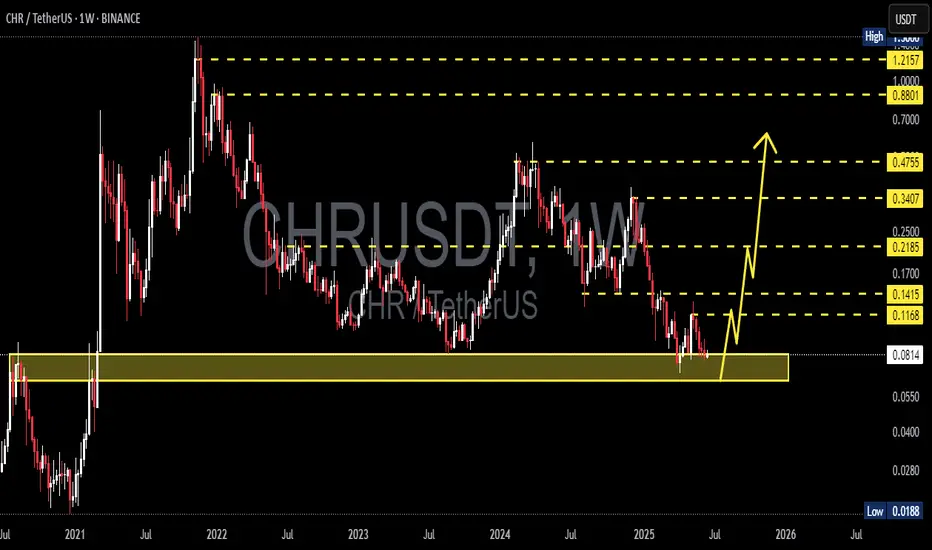
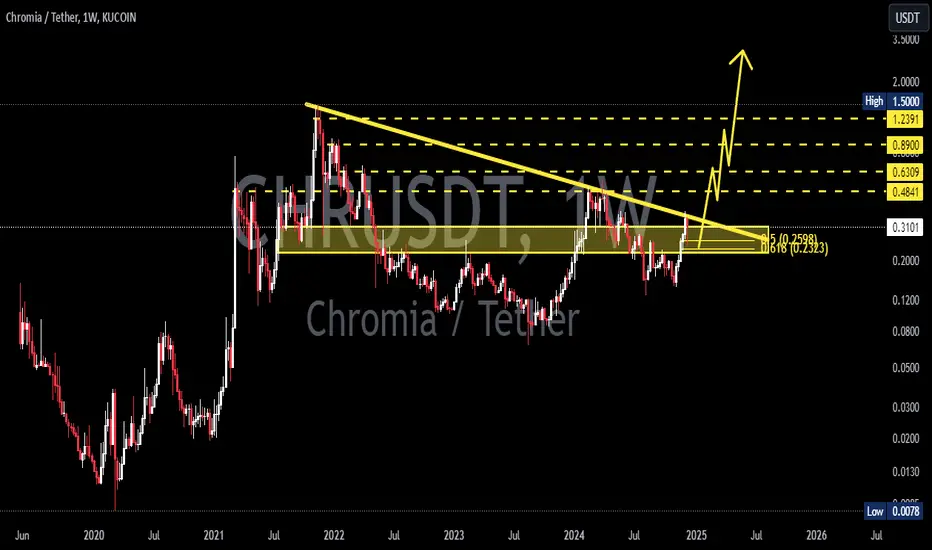
CHRUSDT 1W AnalysisCHR ~ 1W Analysis
#CHR Buy back gradually from here if you still have confidence in this coin with a short term target of at least 20%+ from here.
CHRUSDT 1D AnalysisCHR ~ 1D Analysis
#CHR Buy gradually from here if you still have confidence in this coin with a short term target of at least 15%+ from here.
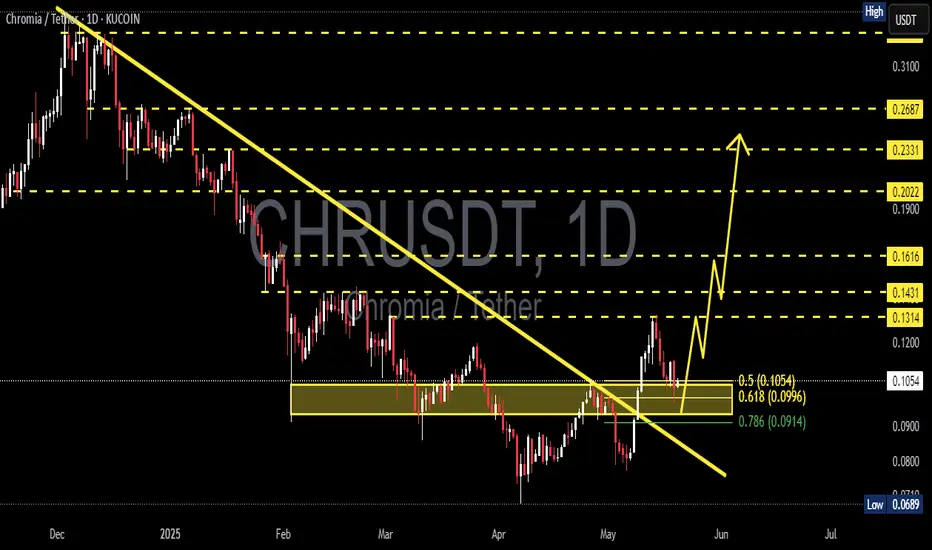
CHRUSDT 1DCHR ~ 1D Analysis
#CHR Buy after successfully penetrating this resistant line with a short -term target of at least 10%+ from here.
CHRUSDT 1WCHR ~ 1W Analysis
#CHR If you still have a Conviction on this coin,. Maybe you can consider this support to start buying back from here.
CHRUSDT 1WCHR ~ 1W
#CHR If you still have Conviction on this coin,. Buy in stages from here with a minimum target of 20%++

CHRUSDT 1WCHR Update ~ 1W
#CHR Again rejected from this resistance line. If you still have Conviction on this coin,. This support block would be a very good buying place for now,. with a minimum target of 20%++, it is only a matter of time until this resistance line is successfully penetrated.
CHRUSDTCHR ~ 4D
#CHR Continue moving in this descending pattern. Wait for this descending pattern to be successfully broken to start buying this coin.

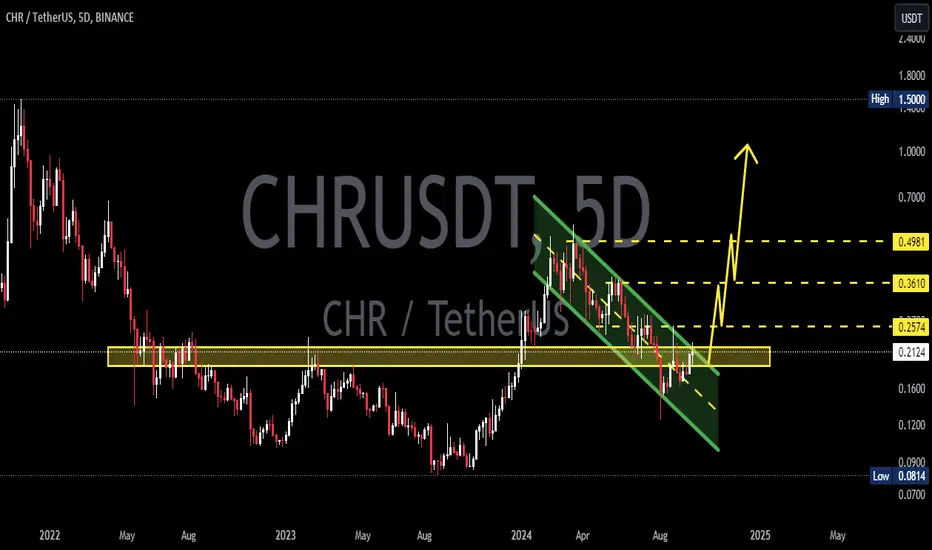
CHRUSDTCHR ~ 5D ✅
#CHR Make purchases in stages from here. it's just a matter of time until the bulls come back and start pumping these Coins.