#CHZ/USDT Reversal Potential Breakout & Fibonacci Retest in Fo#CHZ
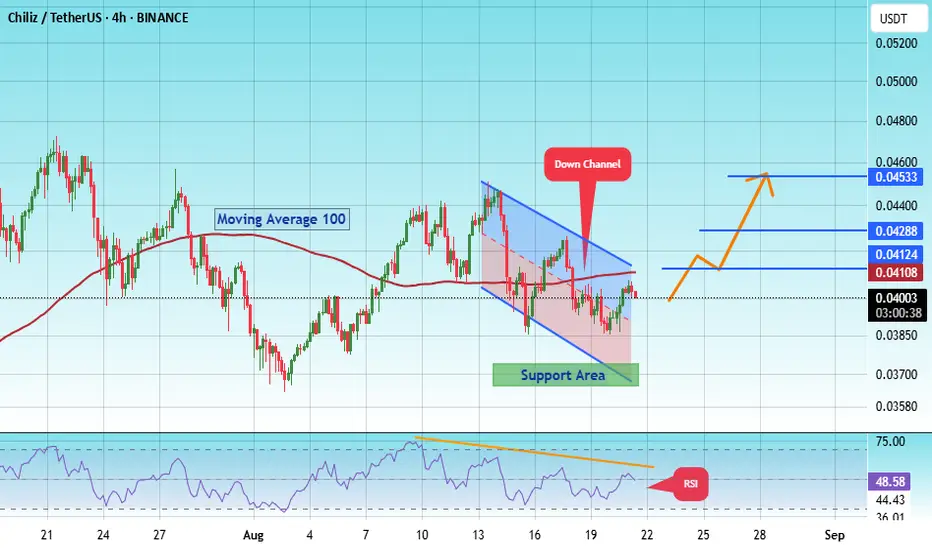
The price is moving within a descending channel on the 1-hour frame, adhering well to it, and is heading for a strong breakout and retest.
We have a bearish trend on the RSI indicator that is about to be broken and retested, supporting the upside.
There is a major support area (in green) at 0.03700, which represents a strong basis for the upside.
For inquiries, please leave a comment.
We are in a consolidation trend above the 100 moving average.
Entry price: 0.4000
First target: 0.04108
Second target: 0.04288
Third target: 0.04533
Don't forget a simple matter: capital management.
When you reach the first target, save some money and then change your stop-loss order to an entry order.
For inquiries, please leave a comment.
Thank you.
CHZ
CHZ : BUY OR SELL? Hello friends
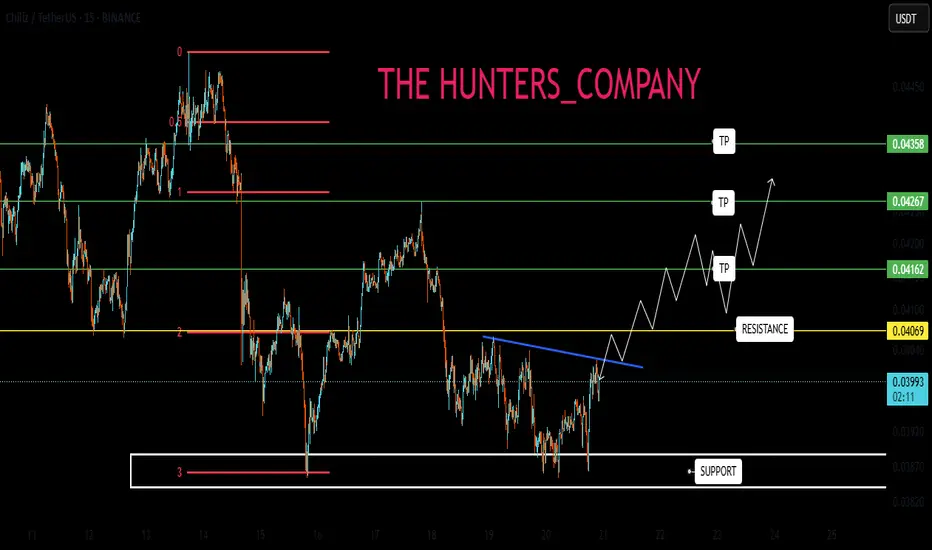
According to the price drop, you can see that the price is in the support area specified by the buyers. The specified support is also specified with Fibonacci, which is from our own strategy.
Now, if the support is held and the specified resistance is broken, the price can move to the specified targets. Don't forget risk and capital management.
*Trade safely with us*
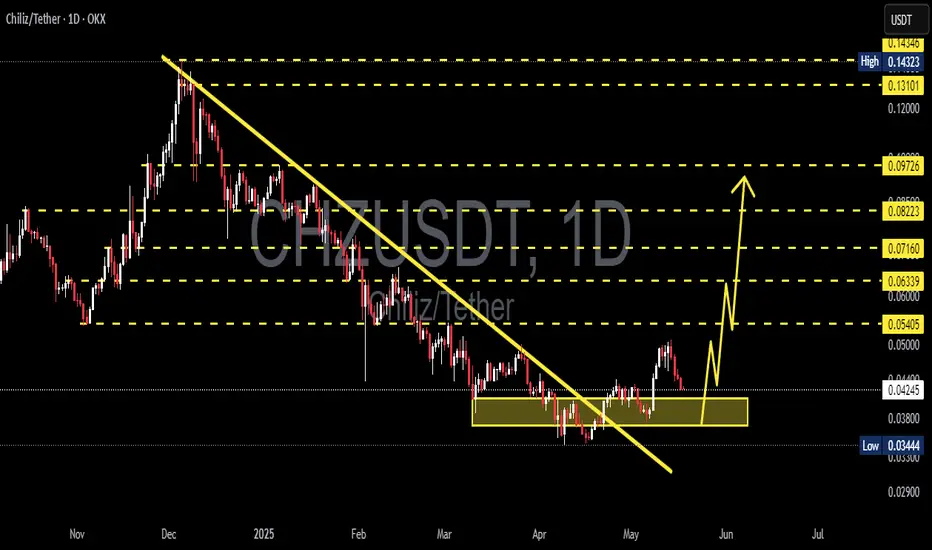
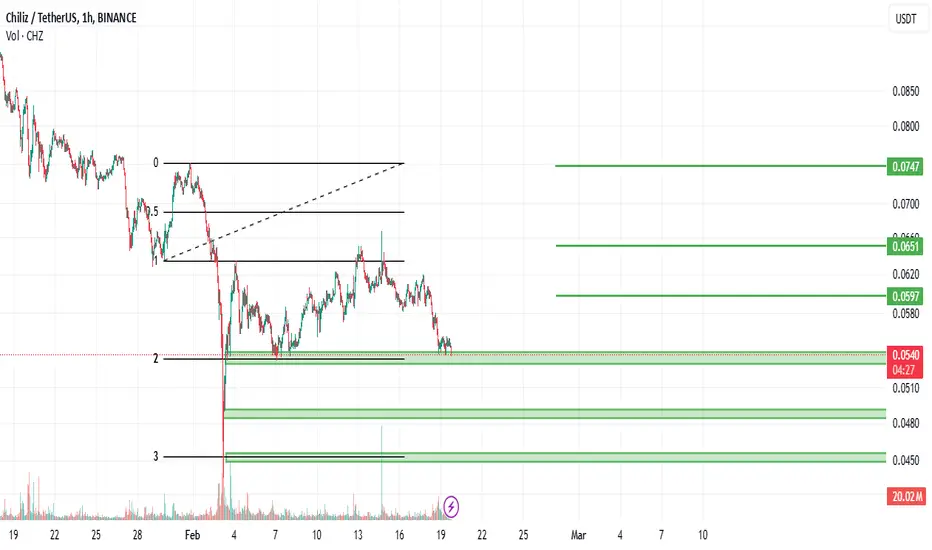
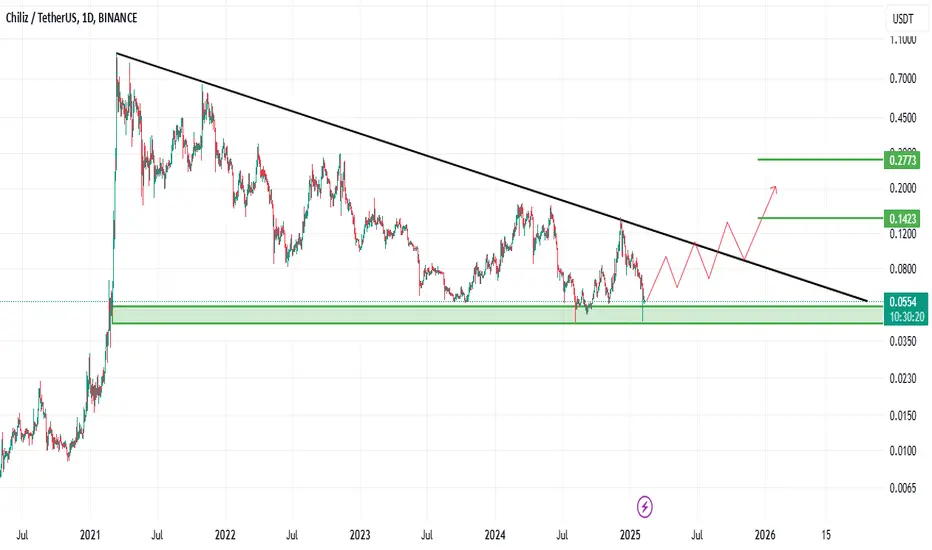
CHZUSDT Reversal Potential Breakout & Fibonacci Retest in FocusChart Analysis:
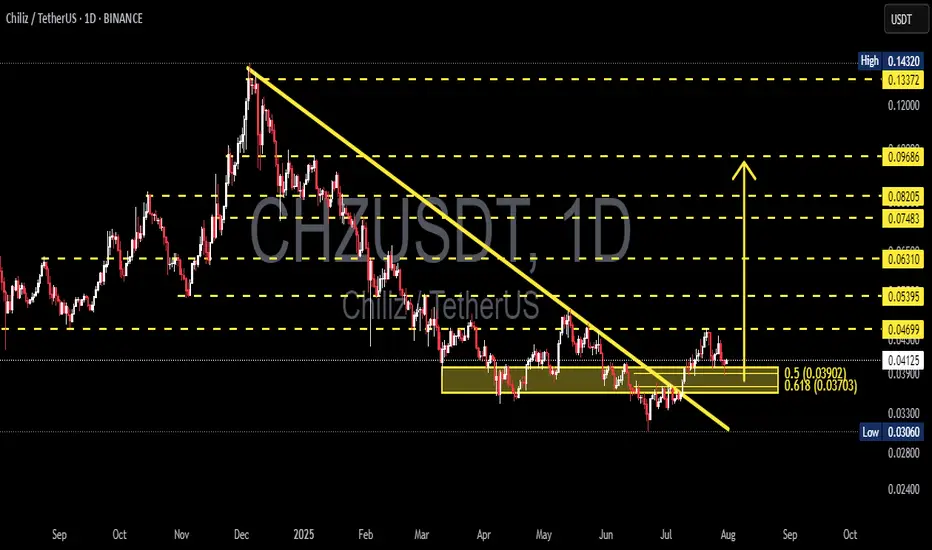
The CHZ/USDT pair on the 1D timeframe has successfully broken out of a long-term descending trendline, which had been acting as resistance since December 2024. The breakout occurred with a strong bullish candle, suggesting a potential trend reversal.
Currently, the price is performing a retest of the breakout zone, which aligns perfectly with the Fibonacci retracement levels:
0.5 at $0.03902
0.618 at $0.03703
This confluence zone is critical as it may serve as a base for a continued bullish move.
---
Pattern Identified:
Descending Triangle Breakout → Signaling the end of a distribution phase and the potential start of accumulation.
Bullish Retest Zone → Price is testing the previous resistance turned support + Fibonacci confluence.
---
Bullish Scenario:
✅ If price holds above the $0.037–$0.039 support area and forms a bullish rejection candle, potential upside targets include:
$0.04699 (minor resistance)
$0.05395
$0.06310
$0.07483
Up to psychological resistance at $0.09686
---
Bearish Scenario:
❌ If price breaks below the $0.03703 level, further downside could be seen toward:
$0.03306 (local support)
And possibly the recent low at $0.03060
However, as long as the price stays above the 0.618 Fibonacci, the bias remains bullish.
---
Conclusion:
CHZ/USDT is at a critical decision point. A successful retest of the breakout zone combined with Fibonacci support could provide a strong accumulation opportunity for buyers. Watch closely for bullish confirmation candles in the yellow zone before entering.
#CHZ #CHZUSDT #CryptoBreakout #FibonacciLevels #TechnicalAnalysis #AltcoinWatch #TrendReversal #CryptoTrading #TradingViewAnalysis
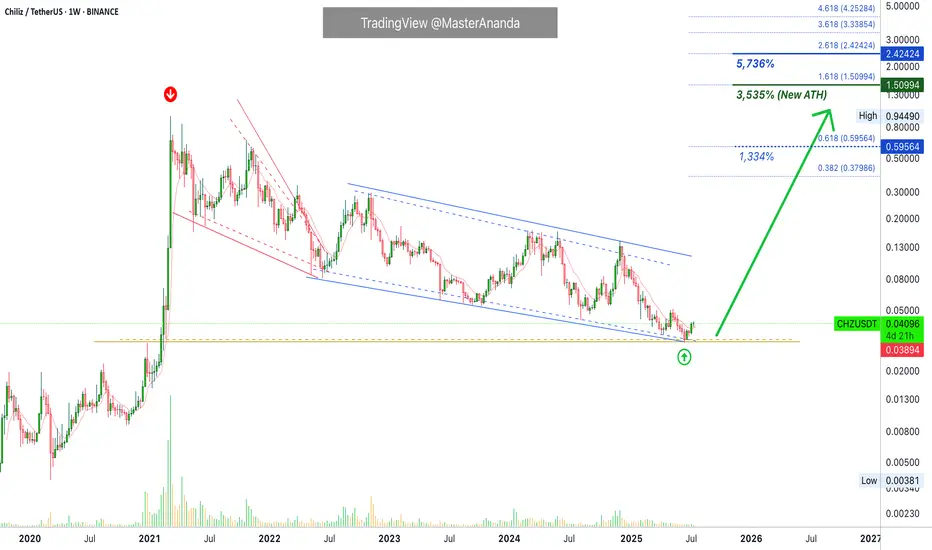
Chiliz Hitz Bottom · Opportunity Buy Zone (PP: 3,535%)Chiliz is trading at a true bottom right now after producing the lowest price in more than three years. The lowest since February 2021. No need to worry though, an early recovery is already happening and we are sure the bottom is in.
The past three weeks have been green while CHZUSDT managed to close above EMA8. This means that the trend is changing or is about to change and we know it will change because we are right in front of the 2025 altcoins bull market. Chiliz will not stay behind, it will also grow. We don't know how strong but there is plenty of room for rising prices. You will be surprised by what the market does.
What the market does is to condition you in some way. First, you become conditioned to seeing higher prices, unlimited potential and that's the start of the bear market, long-term a downturn. But this isn't the end.
When you are conditioned to seeing the market go down, more down; down, down, down, forever more, then it changes suddenly, as if by surprise and prices start to grow. The growth feels strange because it is something not seen in a while and we wonder, will it last? I don't know.
That's the first answer if you don't have access to years of data and this amazing chart.
Seeing the chart long-term coupled with marketwide action and what Bitcoin does, yes, the market growth will last a long time because an uptrend means higher highs and higher lows.
Right now we are looking at the best possible entry prices, an opportunity buy-zone. Buying now can result in incredible gains in the coming months.
Thanks a lot for your continued support.
Namaste.
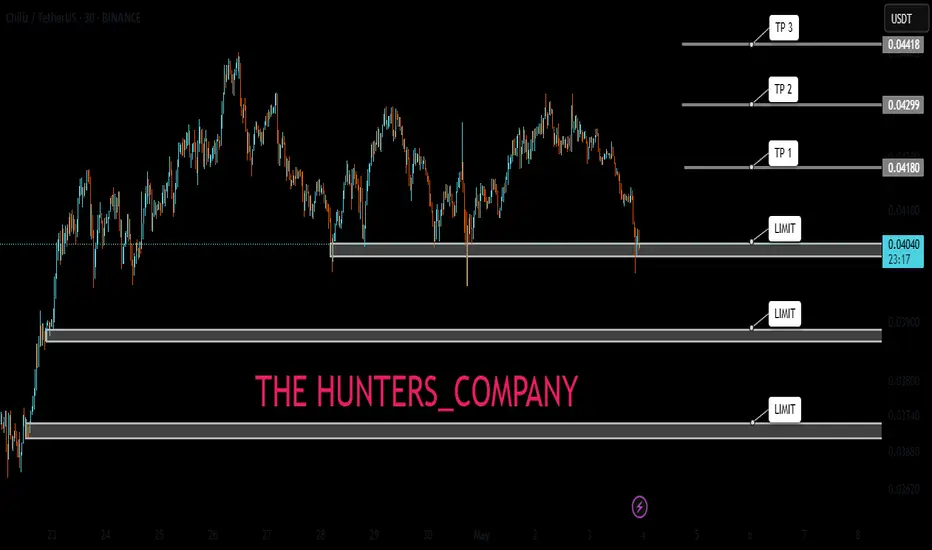
CHZ LIMIT FOR BUY(FREE)Hello friends
Due to the price drop, we can buy on the drop within the specified limits and move with it to the specified targets, of course with capital and risk management.
*Trade safely with us*
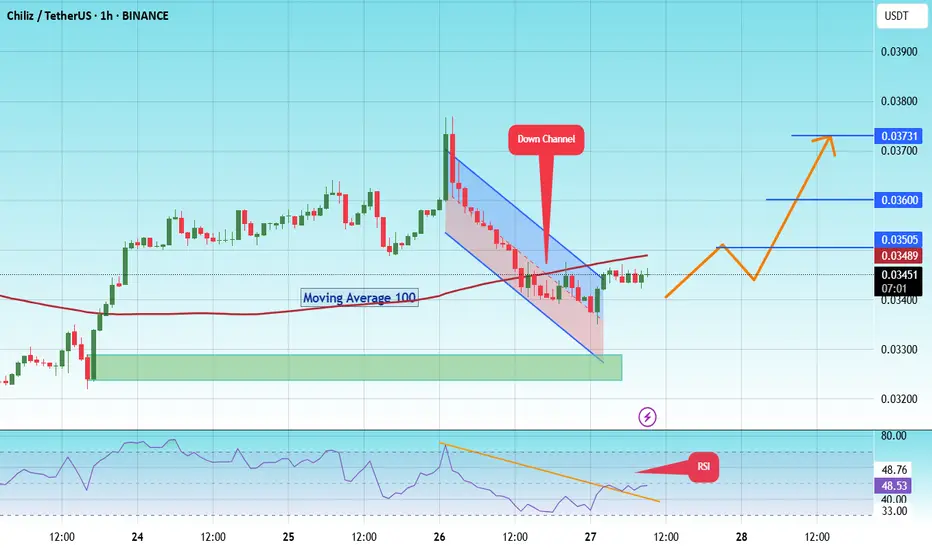
#CHZ Price is testing the Descending channel resistance #CHILIZ
The price is moving within a descending channel on the 1-hour frame and is expected to break and continue upward.
We have a trend to stabilize above the 100 moving average once again.
We have a downtrend on the RSI indicator that supports the upward break.
We have a support area at the lower boundary of the channel at 0.03320, acting as strong support from which the price can rebound.
We have a major support area in green that pushed the price upward at 0.03200.
Entry price: 0.03440
First target: 0.03505
Second target: 0.03600
Third target: 0.03730
To manage risk, don't forget stop loss and capital management.
When you reach the first target, save some profits and then change the stop order to an entry order.
For inquiries, please comment.
Thank you.
CHZUSDT 1D Analysis CHZ ~ 1D Analysis
#CHZ Buy back on retesting this support block with a short term target of at least 10%++ from here.
#CHZ/USDT#CHZ
The price is moving within a descending channel on the 1-hour frame and is expected to break and continue upward.
We have a trend to stabilize above the 100 moving average once again.
We have a downtrend on the RSI indicator that supports the upward move with a breakout.
We have a support area at the lower boundary of the channel at 0.04400, which acts as strong support from which the price can rebound.
Entry price: 0.04516.
First target: 0.04650.
Second target: 0.04820.
Third target: 0.05011.

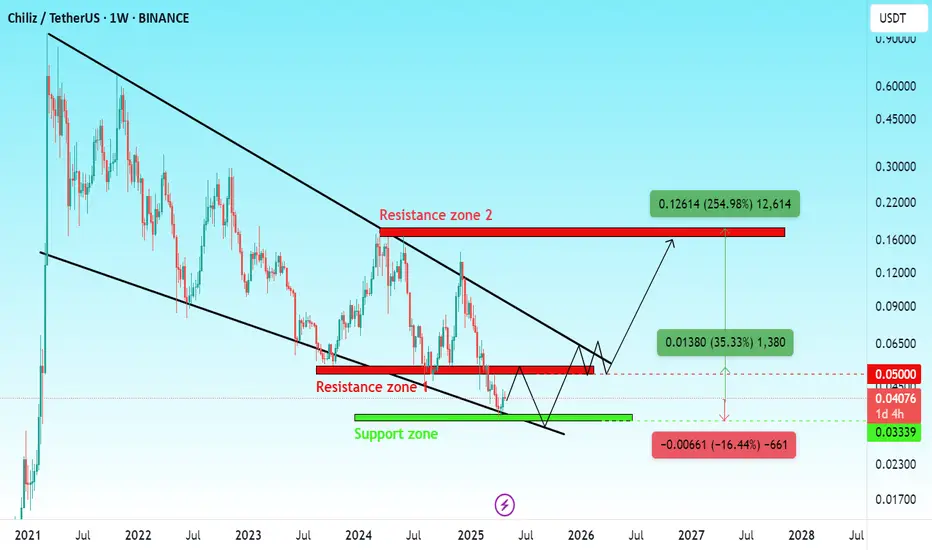
CHZ Weekly AnalysisCHZ Weekly Analysis
CHZ is showing a positive divergence on the weekly timeframe, indicating a possible bullish move.
Risk-tolerant traders may start entering at the current price, placing their stop-loss below the weekly support zone, and considering an additional entry around the weekly support.
However, for a more confident entry, it’s better to wait for a strong breakout above Resistance Zone 1.
Support us with your energy by following us, and feel free to ask if you have any questions!
CHZ 50x plus tradeTraders,
Here we are again pointing out an amazing trade idea for you, the solicitors 👧🏿 and dealers 🙍🏿♂️who will likely end up transacting all of your winnings with! CHZ a great wagering project that will make you a killing this run. This one is cut and dry, we have a wedge pattern along with a possible flag that will likely play our by the end of this year!
We hope you enjoy the free trades that we have been sharing from the VIP group and look forward to seeing you enjoy these gains year round if you come check us out!
As always, stay profitable folks!
Savvy!
#CHZ/USDT#CHZ
The price is moving within a descending channel on the 1-hour frame, adhering well to it, and is on its way to breaking it strongly upwards and retesting it.
We are seeing a bounce from the lower boundary of the descending channel, which is support at 0.03470.
We have a downtrend on the RSI indicator that is about to break and retest, supporting the upward trend.
We are looking for stability above the 100 moving average.
Entry price: 0.3570
First target: 0.03643
Second target: 0.03736
Third target: 0.03888

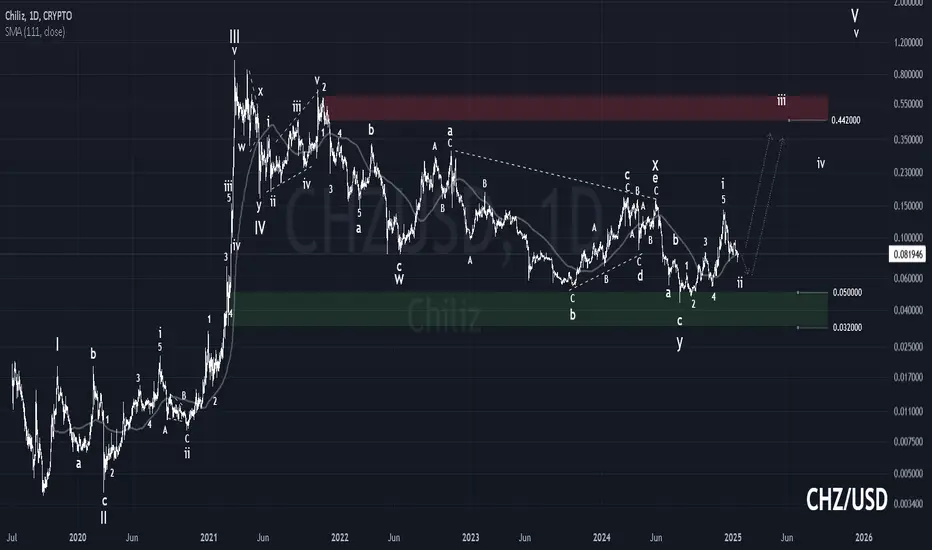
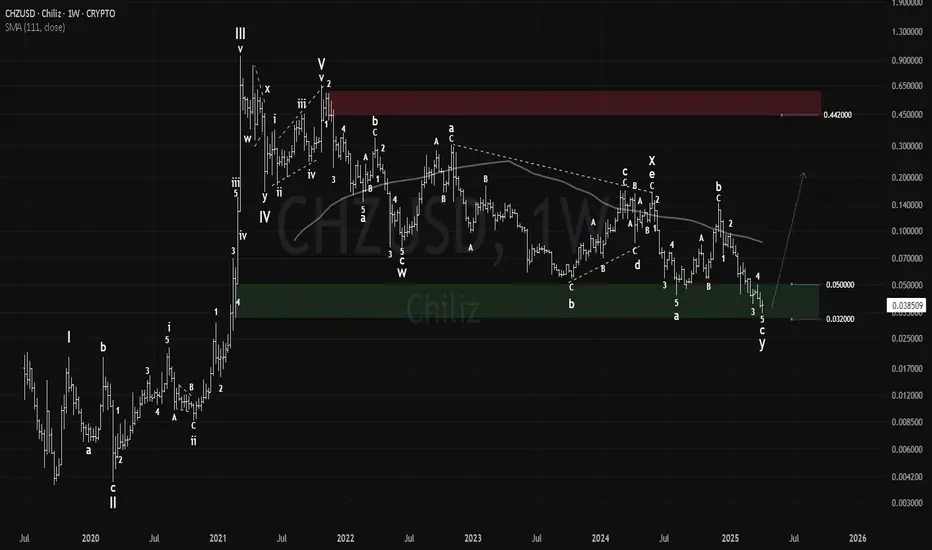
CHZ: The Safe BetAlthough #Chiliz has been in a bearish trend since March 2021, many still bet on a strong comeback.
A complex double combo appears to be complete, with the current range holding and bullish divergence showing on several indicators.
Passing $0.14 confirms a shift in trend.
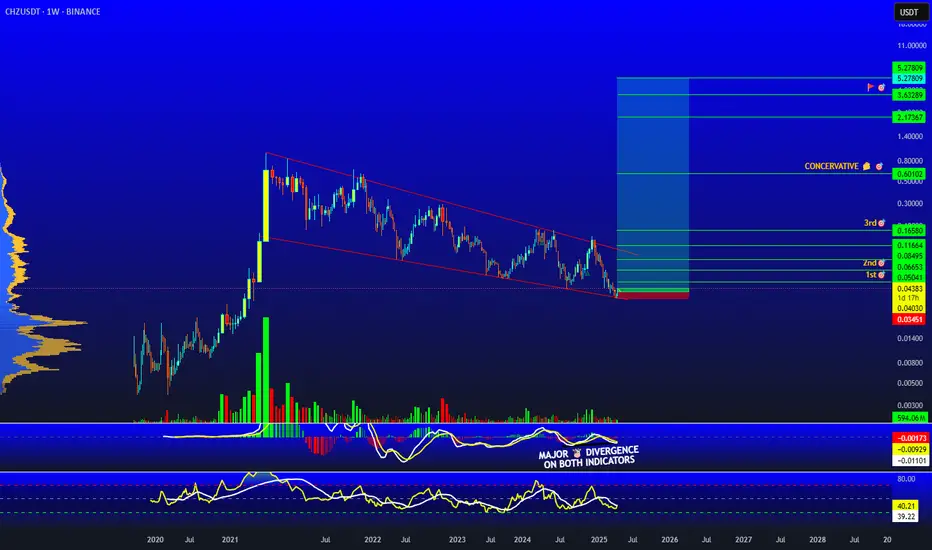
Chiliz: Your Altcoin ChoiceChiliz (CHZUSDT) can break $1 on a strong bull-market. To reach $3, we would need an extra-ordinary bullish wave and this target seems less likely, but still possible...
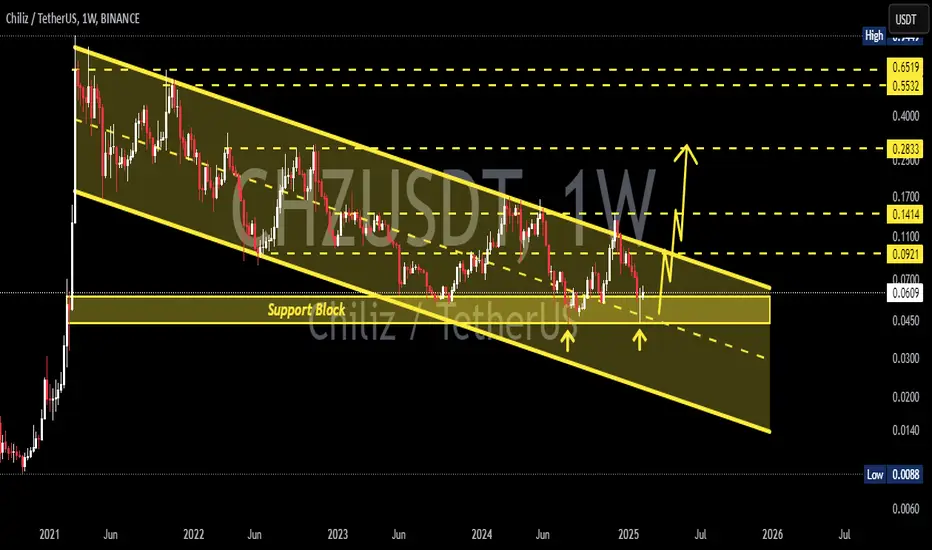
How are you doing my cherished reader?
I hope you are having a wonderful day.
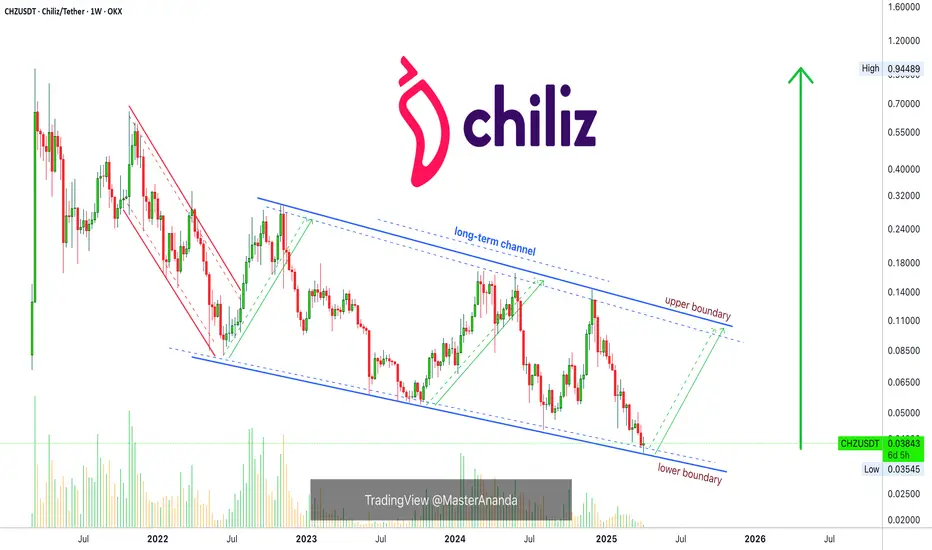
This a great chart. Chiliz hit a new All-Time Low today and the action is turning bullish with high volume. It is possible that we are looking at a bottom catch.
There are always many ways to approach a chart; so many tools available.
Here we are looking mainly at the chart structure and long-term price dynamics.
There is a channel with the lower boundary being tested. This is a classic, when the lower boundary of a channel is tested, the next logical move is a test of the upper boundary, but this would only be the start as we are in a bull-market year. This is to say that higher prices are possible after the first strong resistance level is hit.
The decline that started in December 2024 is very steep, a strong decline. This type of action tends to reverse strongly once the low is hit. If the drop is more balanced, it can last longer and produce multiple lows. When the drop goes straight down, once the bounce happens it is over. So, if we get green and see green be ready, it means we are going up.
This is definitely a good choice. Buyers should be happy because prices as now are rarely possible to find. Once we hit bottom, there is no other place left to go but up.
Strategy: Buy and hold. Go LONG.
Thanks a lot for your continued support.
Namaste.
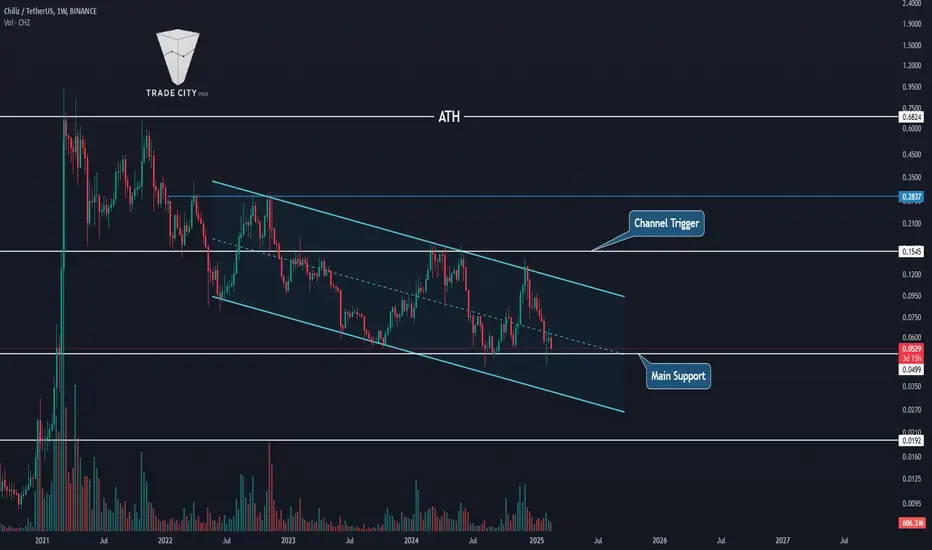
TradeCityPro | CHZ: The Sports Enthusiast's Crypto Play👋 Welcome to TradeCityPro!
In this analysis, I want to review the CHZ coin. Chiliz is a sports project within crypto that creates fan tokens for world-famous clubs.
🔍 For example, clubs like Atlético Madrid, Barcelona, Manchester City, Juventus, and others use this project to create their fan tokens, and fans of these teams can support their favorite team by purchasing these tokens. Currently, the CHZ coin has a market cap of $499 million and is ranked 122 on CoinMarketCap.
📅 Weekly Timeframe
As you can see in the weekly timeframe, after the sharp price pump that occurred in 2021, the price reached the area of 0.6824. After reaching this area, the price changed direction and underwent a downward trend down to the support at 0.0499, experiencing more than a 90% decline.
🔽 In this downward trend, we observe a descending channel where the price has reacted well to both the channel’s ceiling and its floor. In the latest upward movement, as you can see, the price did not reach the bottom of the box, and if you notice, each time in the previous two upward and downward movements within this channel, the upward movements had more volume than the downward ones, indicating the buyers' strength.
⚡️ Currently, the most important support for this coin is at 0.0499, which is near this area. If this area is broken, we might witness a price drop to the channel's bottom or even to the next support area at 0.0192.
🚀 On the other hand, if this support can push the price back up and the price also breaks out of the downward channel, the channel's trigger area will be 0.1545, which is also a very important resistance. If this trigger is broken, we can say that the price’s upward trend will start, and the price can move towards higher targets.
💥 The price targets, if this trigger is activated, might be the area at 0.2837, which is very important, and the ATH area at 0.6824.
📅 Daily Timeframe
Moving on to the daily timeframe, we can see more details of the price movement within the range box.
✨ As you observe, the price has had an upward trend up to the area of 0.1333 and hasn’t reached the top of the box, which itself indicates the weakness in the buyers' power. After changing direction, it engulfed 100% of the previous upward leg.
✅ Currently, there is a very important support area and a significant demand zone at the bottom of the box, where the price has entered, and we need to see how it will react to this area. I have marked this area on the chart for you.
🔑 We will confirm the change in direction and the onset of an upward price trend if the 0.0641 level is broken, which would activate a Double Bottom pattern. However, keep in mind that there is currently no Double Bottom, and if the price is supported from this range and moves upward again, a Double Bottom pattern would occur if the 0.0641 level is broken.
📈 So be careful not to preempt this pattern. The main triggers for buying are areas 0.1333 and 0.1659, which if broken, could see the price move towards the weekly targets I specified, such as 0.2837. However, if the supply area is broken and the trend turns downward, the price could move downwards, and the next downward leg could occur, with targets for this scenario also specified in the weekly timeframe.
📊 The volume of this coin in the daily timeframe, as you can see, does not display well and is not very good. For this reason, I am not going to lower timeframes to find futures triggers because coins with low volume and inaccurate volume data are not suitable for trading in futures. Therefore, I suggest not trading this coin in futures.
📝 Final Thoughts
This analysis reflects our opinions and is not financial advice.
Share your thoughts in the comments, and don’t forget to share this analysis with your friends! ❤️
CHZ BUY LIMIThello friends
According to the drop we had, a good opportunity has been provided for buyers.
Now we can buy in steps, of course, with capital management.
We have specified the goals for you...
Trade safely with us
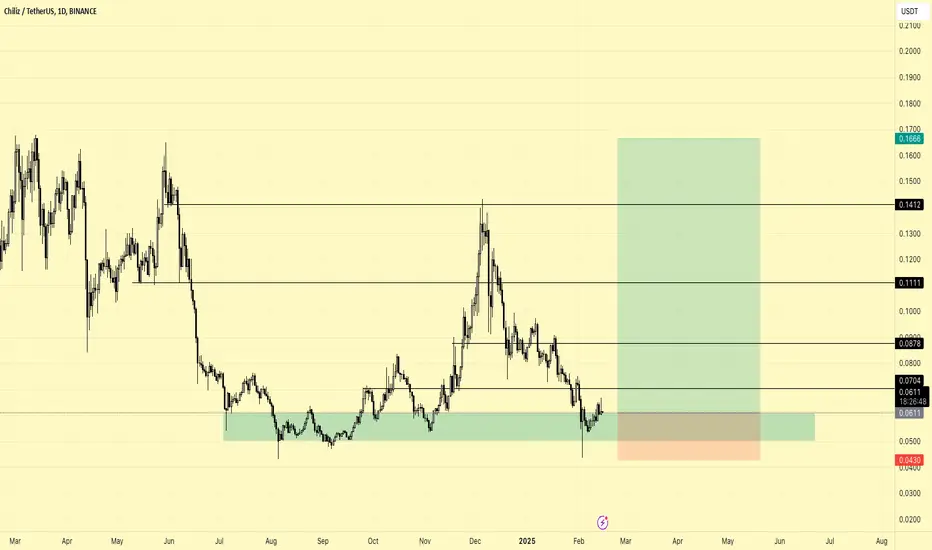
CHZ Mid TermChiliz (CHZ/USDT) Summary Analysis
•Support Zone: $0.0430 - $0.0610 USDT (strong demand area).
•Resistance Levels: $0.0704 → $0.0878 → $0.1111 → $0.1412 USDT.
•Trend: After a downtrend, there is a potential for recovery from support.
Scenarios:
✅ Bullish: If CHZ holds above $0.0610 USDT, the first target is $0.0704 USDT, followed by $0.0878 and $0.1111 USDT.
❌ Bearish: If CHZ falls below $0.0610 USDT, a drop to $0.0430 USDT is possible.
🔄 Neutral: Price may consolidate between $0.0610 - $0.0704 USDT.
Strategy:
🔹 Entry: Buy within the $0.0611 - $0.0500 USDT range, with a stop loss below $0.0430 USDT.
🔹 Sell: A close below $0.0610 USDT may accelerate the downtrend.
📊 Conclusion: The $0.0610 USDT level is critical—if CHZ holds above it, a rally could follow. 🚀
CHZUSDT 1WCHZ ~ 1W Analysis
#CHZ As long as this support is still maintained, there is still hope for the next increase. Target of at least 15%+ from here.
Good area to shop...hello friends
Considering that the price is in a triangle, now by reaching an important support range, it is expected that the price will break the resistance in front of it to move to the specified targets.
*Trade safely with us*
czh buy midterm"🌟 Welcome to Golden Candle! 🌟
We're a team of 📈 passionate traders 📉 who love sharing our 🔍 technical analysis insights 🔎 with the TradingView community. 🌎
Our goal is to provide 💡 valuable perspectives 💡 on market trends and patterns, but 🚫 please note that our analyses are not intended as buy or sell recommendations. 🚫
Instead, they reflect our own 💭 personal attitudes and thoughts. 💭
Follow along and 📚 learn 📚 from our analyses! 📊💡"

chz buy midterm"🌟 Welcome to Golden Candle! 🌟
We're a team of 📈 passionate traders 📉 who love sharing our 🔍 technical analysis insights 🔎 with the TradingView community. 🌎
Our goal is to provide 💡 valuable perspectives 💡 on market trends and patterns, but 🚫 please note that our analyses are not intended as buy or sell recommendations. 🚫
Instead, they reflect our own 💭 personal attitudes and thoughts. 💭
Follow along and 📚 learn 📚 from our analyses! 📊💡"
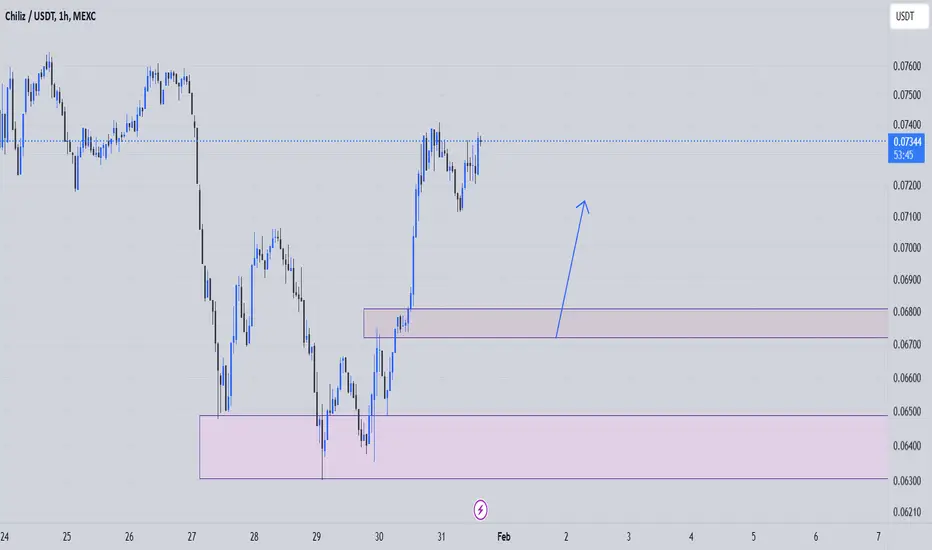
CHZ USDT
CHZ is currently trading within the Green support zone, between $0.0713 and $0.0745, and is still moving below a descending trendline that has been in play since early December. The chart signals a strong possibility of a bullish reversal, though a confirmed breakout is crucial before making any decisions.
For bullish momentum to build, CHZ must break above the descending trendline with conviction. If it manages to do so, the price could experience a sharp rally as buyers enter the market. This breakout could drive CHZ toward the Blue resistance zone, located between $0.0951 and $0.0994, where selling pressure is likely to increase. If the rally continues, the next target would be the Yellow resistance zone at $0.1311 to $0.1354.
On the other hand, if CHZ fails to hold the Green support zone, it might drop to the Pink support zone at $0.0605 to $0.0626. This area has historically attracted strong buying interest, and as long as it remains intact, the bullish outlook for CHZ stays valid.

Can #CHZ Really Make a Bullish Comeback or Not? Key Levels Yello, Paradisers! Will #CHZUSDT finally break out of its falling wedge, or are we heading for more downside first? Let’s dive into the current technical setup of #Chiliz:
💎#CHZ is currently trading within a falling wedge along with a triple bottom pattern established in an 8-hour timeframe chart and showing a high probability of a bullish reversal from its current trajectory. This setup often hints at a potential breakout, but confirmation is always key before taking action.
💎#CHZUSD is retesting its strong support in the triple bottom pattern zone. For the bulls to regain control, #CHZ needs to decisively break above the descending resistance and resistance around $0.0996. If the asset successfully breaks above the resistance, expect an impulsive rally as buyers step in. A successful breakout above this level could push prices higher toward the $0.12-$0.13 major supply wall, where sellers are expected to be active.
💎On the downside, the $0.076 zone has been acting as a solid demand area, attracting buyers every time the price dips here. As long as this demand zone holds, the bullish scenario remains intact. However, if this support fails then the asset will fall to the $0.061 support zone where buyers are expected to step in.
💎On the flip side, if #CHZ fails to hold the demand zone and closes below $0.0612, we could see a bearish continuation, with price retesting levels near $0.05-$0.045. This would signal a prolonged bearish phase.
Stay focused, patient, and disciplined, Paradisers🥂
MyCryptoParadise
iFeel the success🌴

The Bullish Case of CHZGETTEX:CHZ
As long as #CHZ is above $0.0486 (stop-loss), two bullish scenarios are expected.
Passing $0.1380 is a bullish confirmation to target a new ATH.
#Chiliz