CHZUSDT
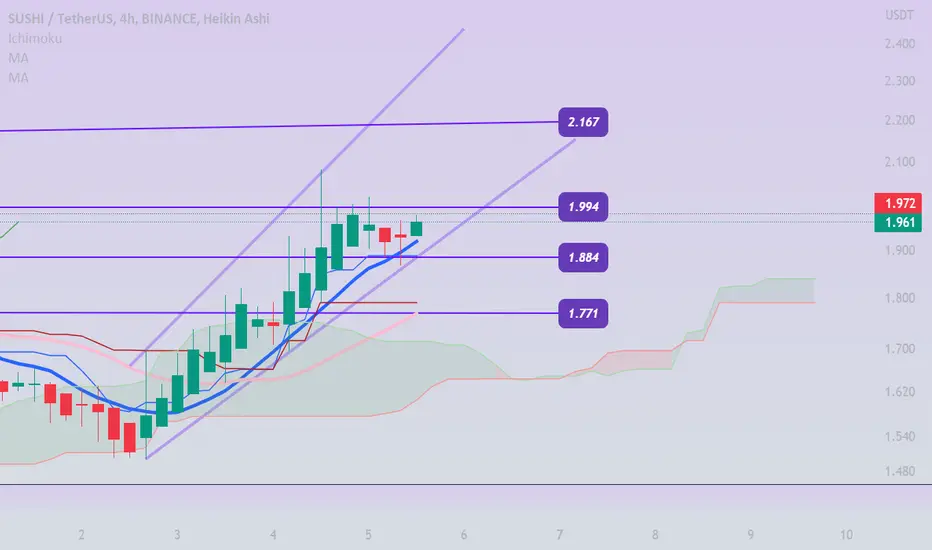
SUSHIUSDT 1DSUSHIUSDT 4H supports and resistors
S: 1,884 / 1,770
A: 1994/ 2,167
Highlight for the crossing of moving averages up, which graphically indicates bullish and the ichimoku cloud is gaining greenish thickness which indicates that buyers are in command of the asset.
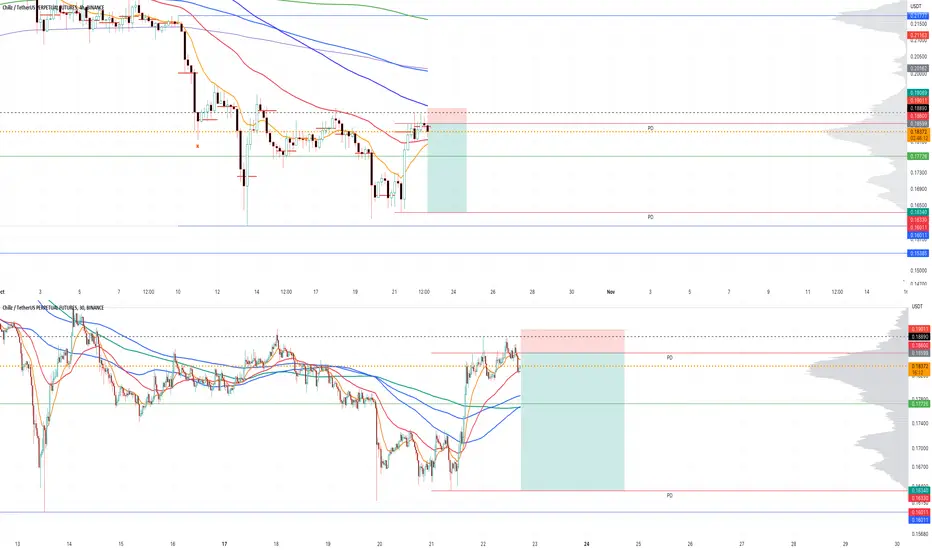
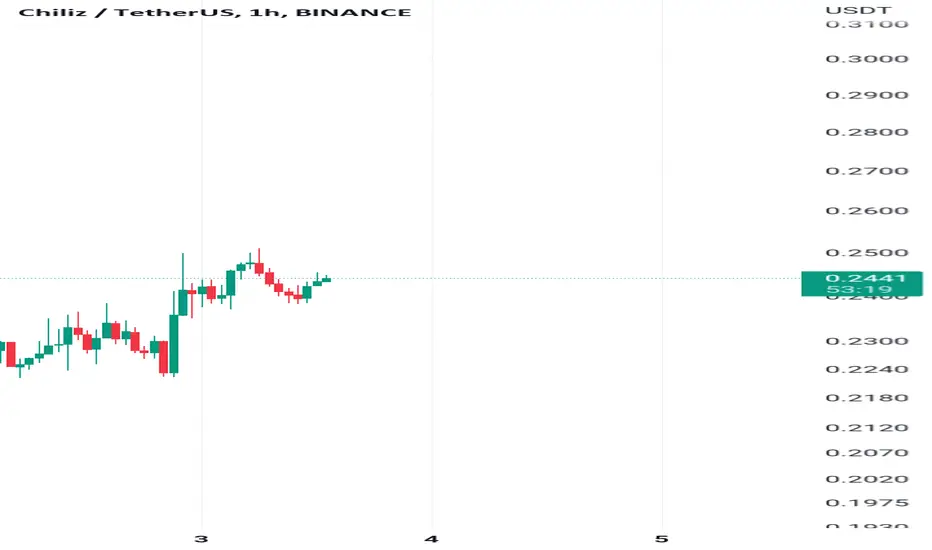
CHZ : DAY TRADING LOOKS ON CONFIRMATIONCHZ looks to have some confirmation for day trading - what seems that it can be very interesting coming time.


Chz Future Binance
Chzusdtp
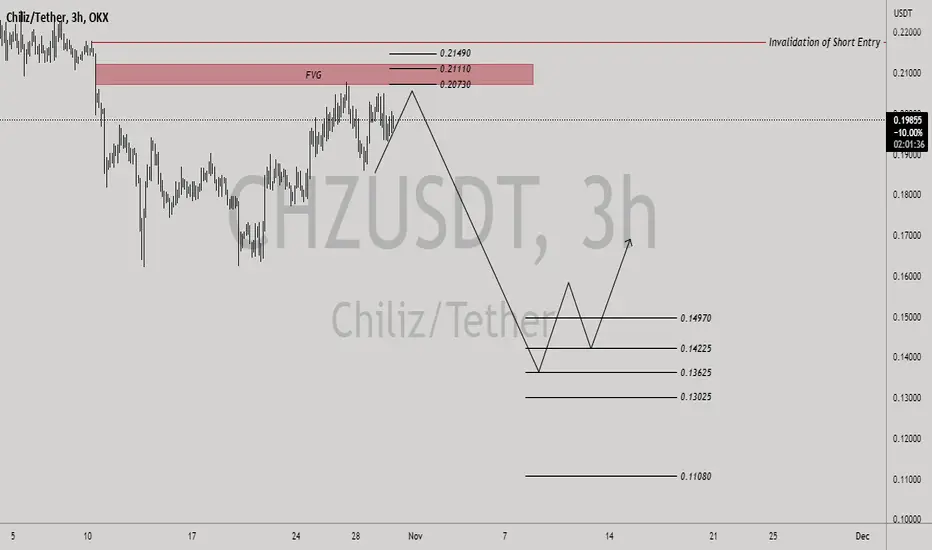
Short
5x
Cancel the order only if the price get close to the target ( less than 0.8 percent)
I hope you gain profits
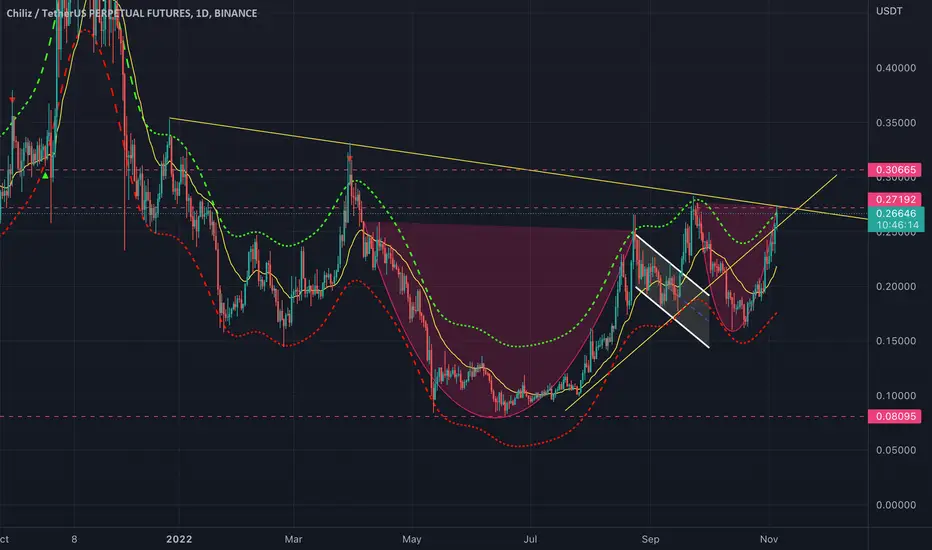
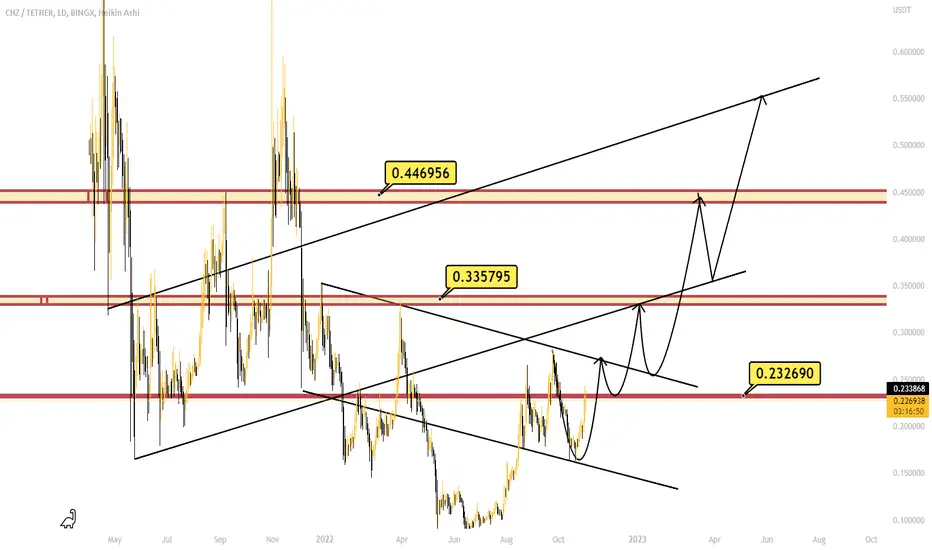
chiliz is hotpossible price will touch the 0.33 level first target, expect chz to go higher as the world cup is fast approaching.
Chiliz 1DEverything is clear in the chart, the area of support and sales is ready for the World Cup
CHZUSDTCHZ Looks good to long now breaking out bull flag
25 is the Target as this is previous in September
Chart Looks very bullish given previous price action
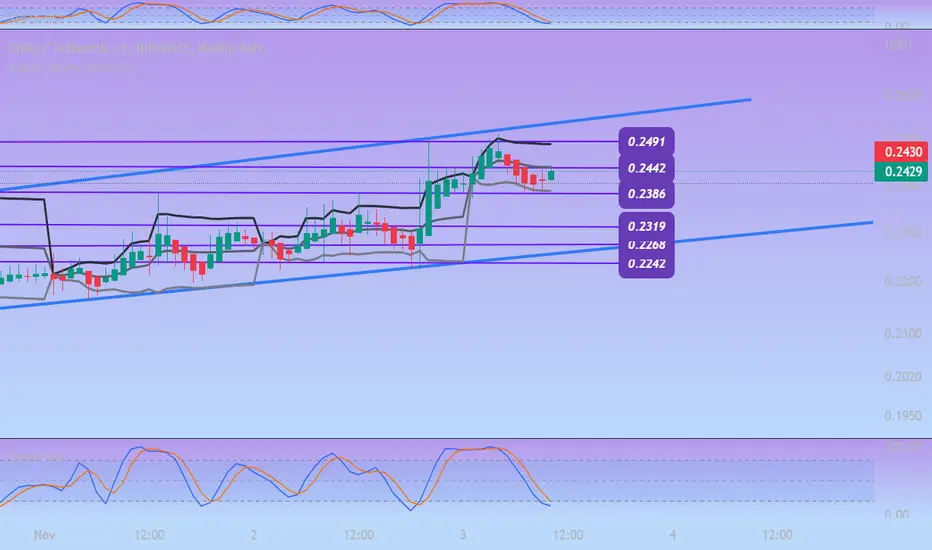
CHZ grew by more than 15% yesterday and 7% today!CHZ grew by more than 15% yesterday and 7% today. After the price entered the corrective wave, we saw a positive reaction to the support levels of the floor of the medium-term bullish channel. After the pullback to the support range, this good rally occurred before the Bitcoin price declined. The resistance range of $0.236 to $0.270 is very important in continuing its mid-term and long-term trend because it is considered an important resistance in the daily time frame. Because if this area is broken, the price can even leave its long-term downward channel. For the short term, until the bottom of the ascending channel is broken and the market conditions remain favorable, we can expect more price growth from this currency.

CHZNot financial advice. The essence of investing & trading is the intelligent and patient preying on the greed, fear, impatience, addiction and ignorance of the majority. It's definitionally Darwinian.
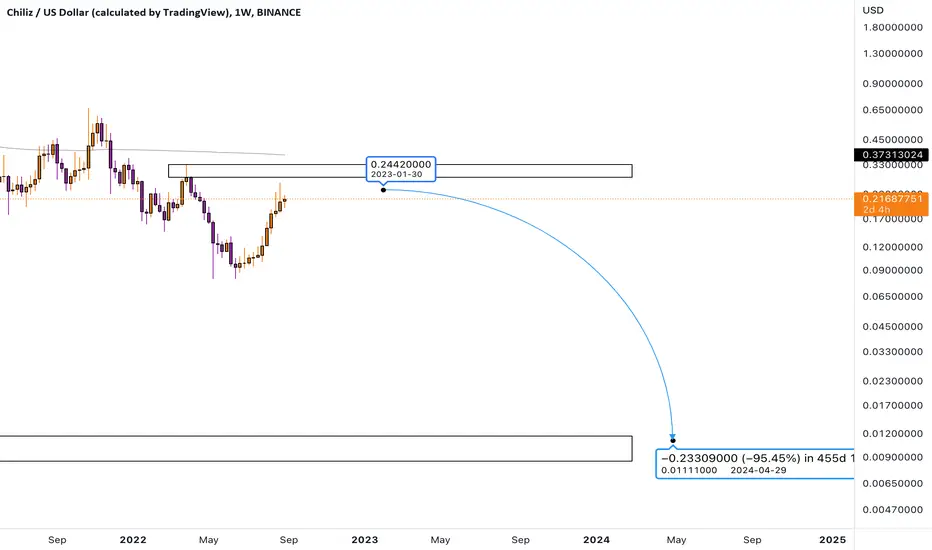
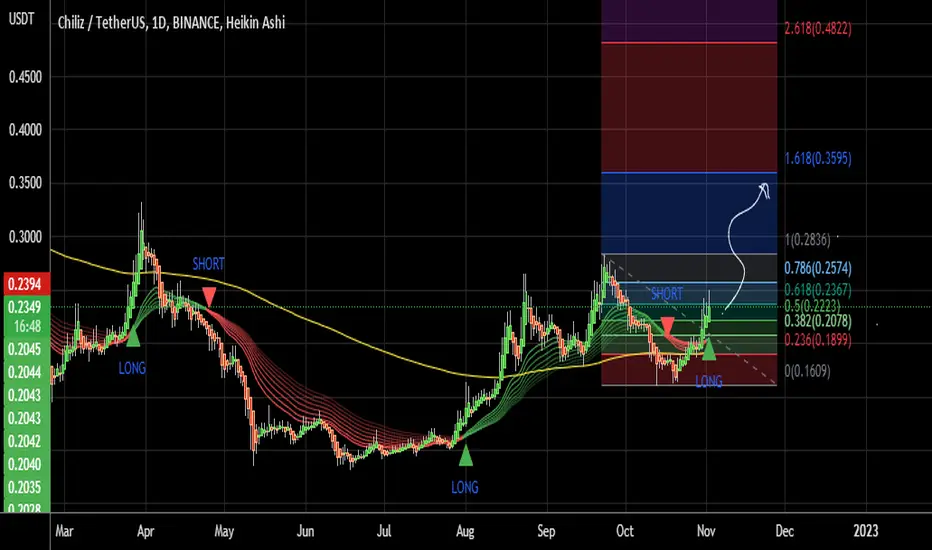
Chiliz (CHZ) is the most dangerous altcoin!Hello, everyone!
This is the bonus analysis for today. I decided to consider the Chiliz because it’s pumping and have a huge interest because of that. I wanna warn you, buying this altcoin could be dangerous, not because of it’s pumping against the market, because of how it is pumping. It has too clear structure that can give me an idea that the target for CHZ is very low.
This is the daily time frame of the CHZUSDT chart. Here we have the confirmed 5 waves structure which have been already ended. I defined it because the price reached it’s target zone and confirmed waves 3, 4 and 5 with the Awesome oscillator divergence and zero line cross under.
Today the price pumped and found resistance exactly at 0.61 Fibonacci retracement. I think the game is over. Wave 2 is finished and next couple of weeks we will see the huge crash in the wave 3. This thought perfectly confirms our setup for the Bitcoin. Crash is imminent, guys. Prepare your bags!
Best regards, Ivan
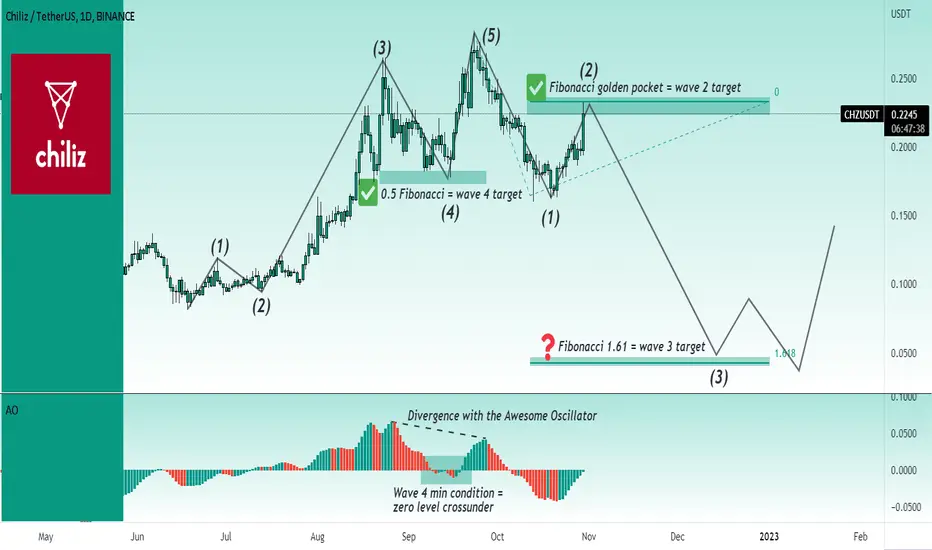
CHZUSDT:Elliot Wave correction 4HrFriends, after the completion of rising wave x, we have started the beginning of wave z, and of course, this wave is forming waves 1-2, and the abc correction of the second wave has been completed, and the beginning of the third wave is forming from wave Z.
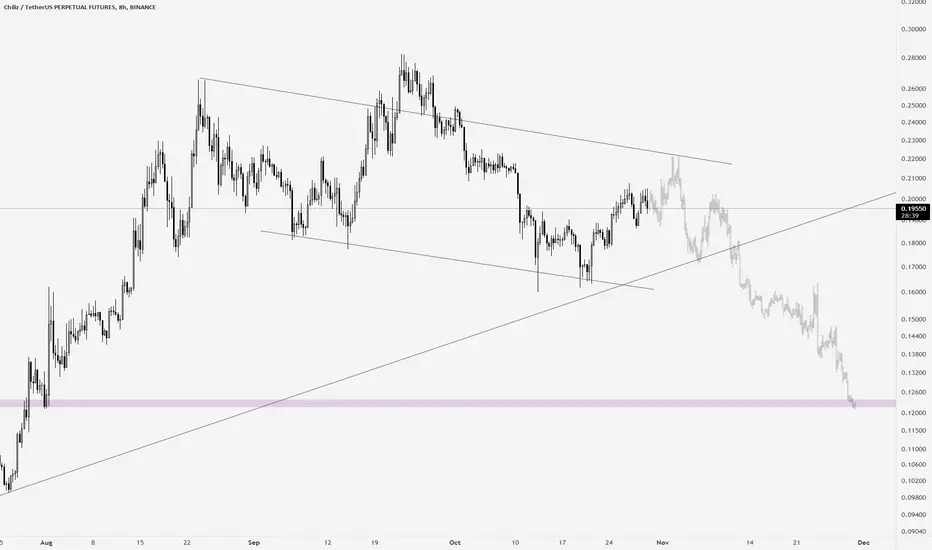
short chz...CHZ neowave behavior shows us that price can sink ant least 50% and we have good supply zoon for that

long CHZ$CHZ bounced off the support level. Bullish movement to resistance level at 0,2277$ is likely to happen.

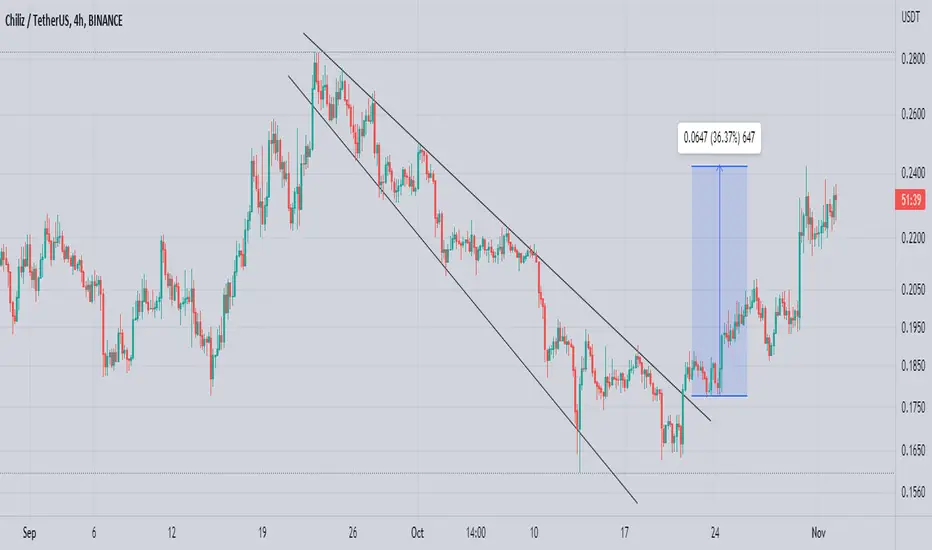
CHZ Take ProfitSince CHZ was able to break the long down trend, I have taken a long position around 0.18444. As of now my take profit target 1 for CHZ is 0.21400. Lets see hows the market works.

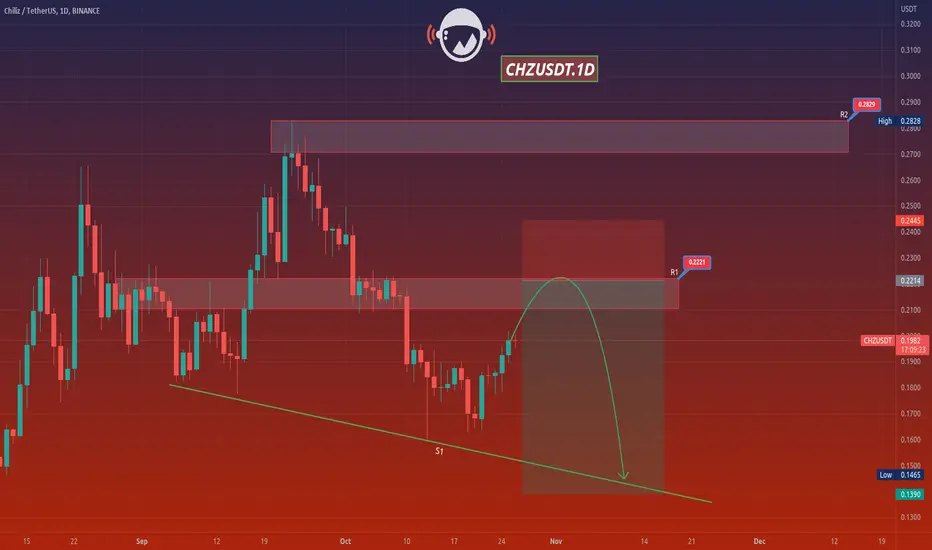
CHZUSDTHello Crypto Lovers,
Mars Signals team wishes you high profits.
This is a one-day-time frame analysis for CHZUSDT
There are R2 and R1 as the resistance areas which express the price was not able to rise. And S1 is a support line that shows the support of price at different points. Hence, we have the price fluctuating below R1 area and we believe it will rise to the height of R1 (this is a good point for saving profits) and there we should wait for some falling signs and then the short position of the chart is activated and a fall is waiting for it toward S1. If the price moves above R1 and fluctuates there, more rise is waiting for it.
Warning: This is just a suggestion and we do not guarantee profits. We advise you to analyze the chart before opening any positions.
Wish you luck
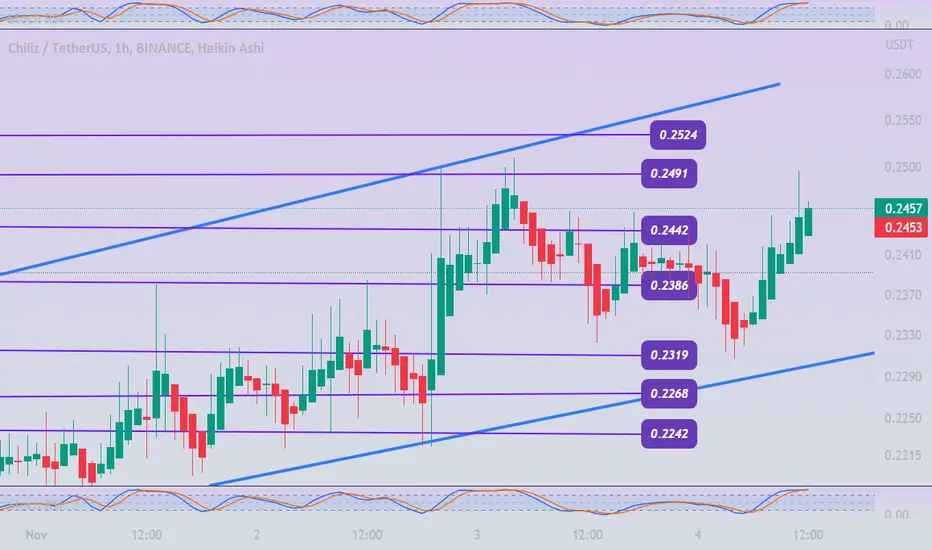
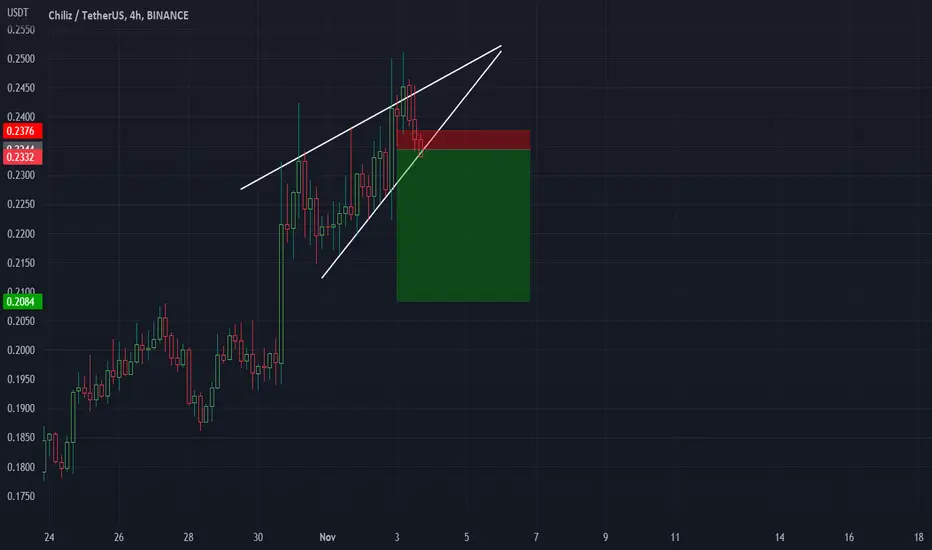
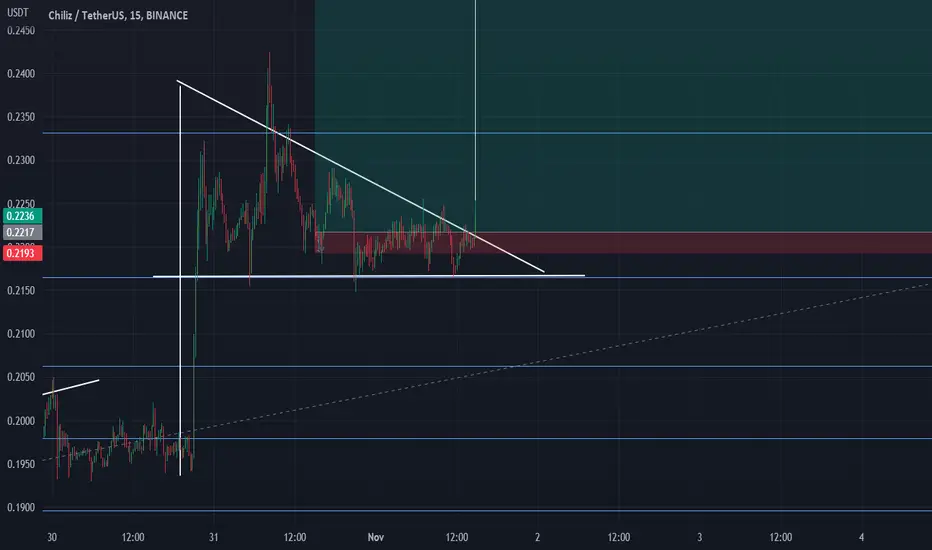
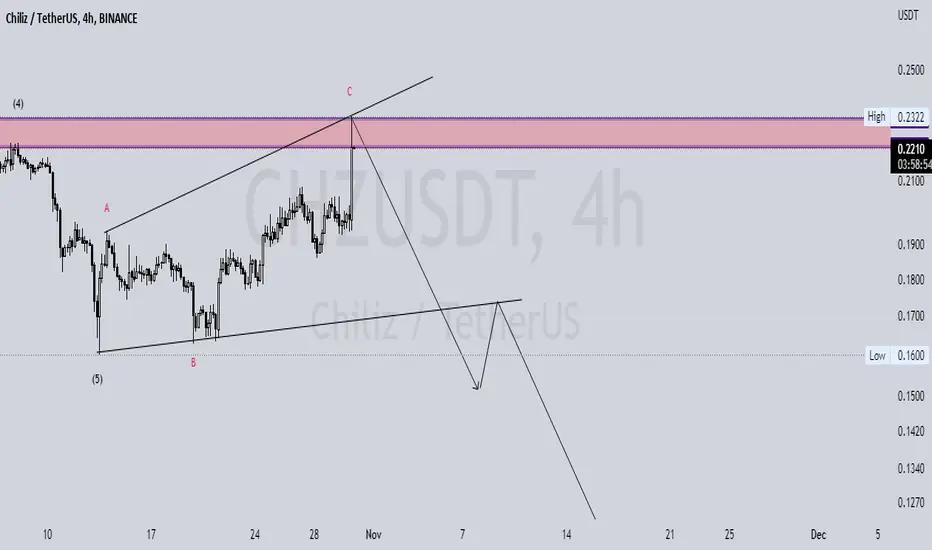
CHZ intraday rotationHey, quick intraday rotation on CHZ - lets see how we react on the re-test. What do u think?