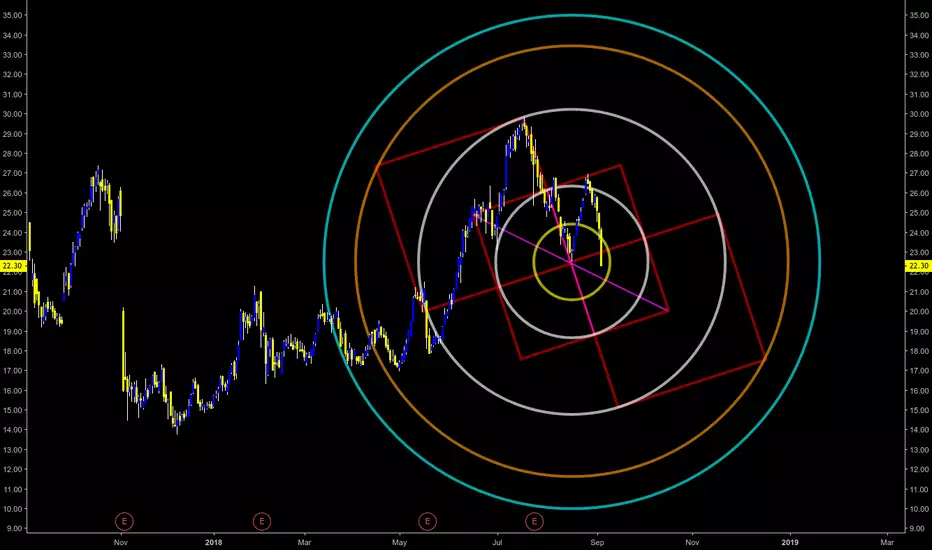
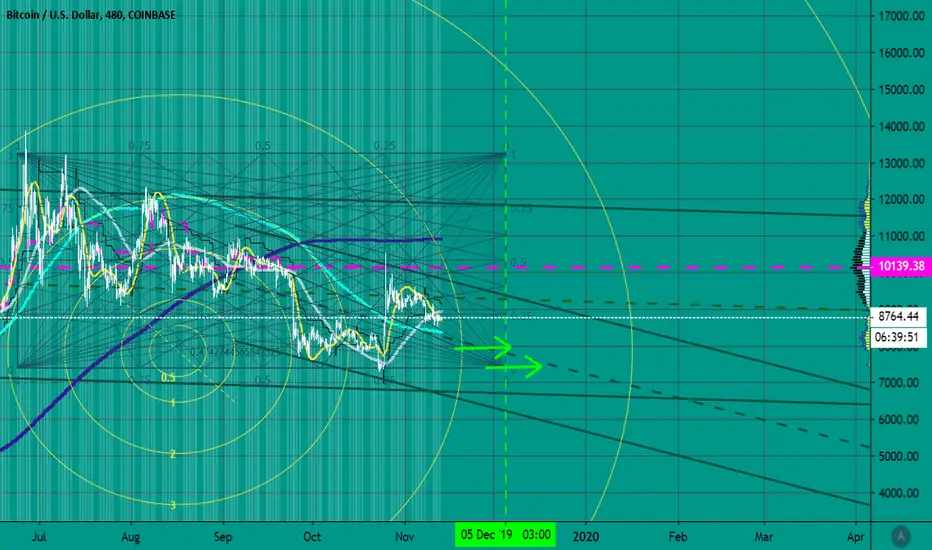
Interesting Fib Circle PeaksOn this chart it can be seen that Fib circles correspond to opposite peaks within the current uptrend (red ovals)
I'm not sure of the correlation and causation of this, but it is pretty cool to see
Price will likely continue up through the channel placed
Circle

Geometry: Chart ExhibitFirst and forever reminder: expand into your own, continually evolve and grow.
Press share "Make it Mine" to view the full interactive chart
Note: Relationship of numbers to each other
Note: The sequence of the various shapes
Note: Geometric Angles
Note: "45" angles up and down various intersection points
In-exhaustive book list
Law of Vibration - Tony Plummer
Michael Jenkins - Geometry of Stock Market Profits, Chart Reading for Professional Traders, Complete Stock Market Forecasting Course
Scott M. Carney - The Harmonic Trader, Harmonic Trading Volume I, Harmonic Trading Volume II, Harmonic Trading Volume III
H.M. Gartley - Profits in the Stock Market
Bill Wiliams - Trading Chaos, New Trading Dimensions, Trading Chaos 2nd Edition
J.M. Hurst - The Profit Magic of Stock Transaction Timing, Cyclic Analysis: A Dynamic Approach
Disclaimer: Not financial advice, no recommendations to buy or sell, no warranties of merchantability, profitability, or probabilities.
Forum:
blackcryptolink.com

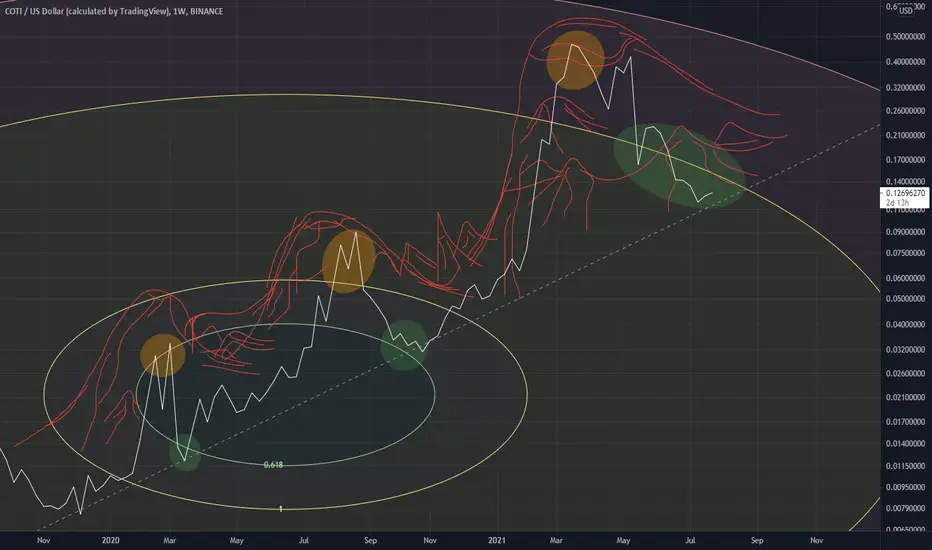
Fibonacci Mountains A more of an artistic piece
showing the climb of price then retreat back to the same fib level within the circle
they looked like mountains
so I decided to draw some mountains
Green oval best entry point for COTI
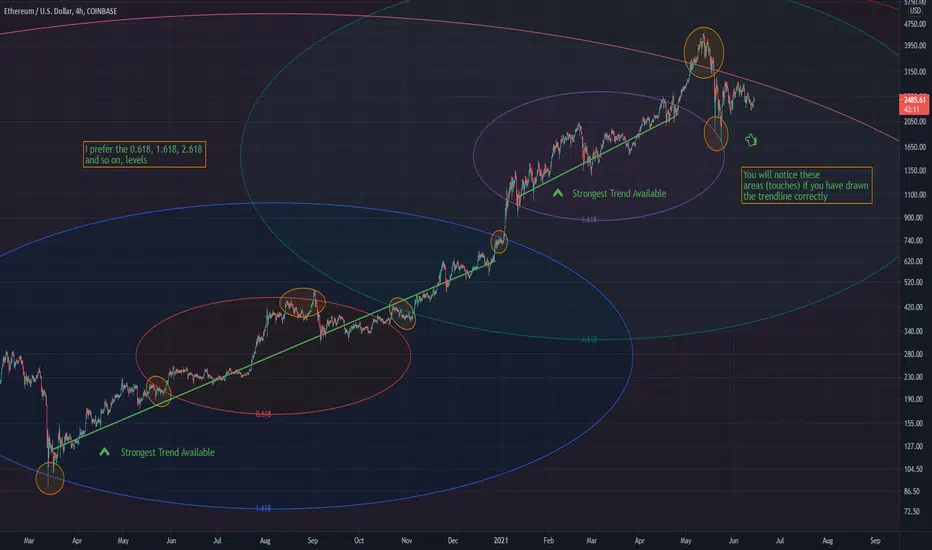
Fibonacci Circles GuideA guide for Fib circles
1 - Draw the trendline
2 - look for areas of confluence around the circle at levels for example 0.618, 1.618, 2.618, 3.618 ...
3 - Make an assessment
This is the 4Hour chart for Ethereum and isn't as reliable as using a higher timeframe, say drawing the trendlines through the entire bear market on the weekly for Ethereum would be more effective. Regardless it still serves its purpose.
This is little data for the current bull run.
This trendline drawing can be applied to any (weekly preferable) chart and assessments can be made based on the position of the price, above or below a key Fib level E.g (0.618)
Hope this helps aspiring chartists
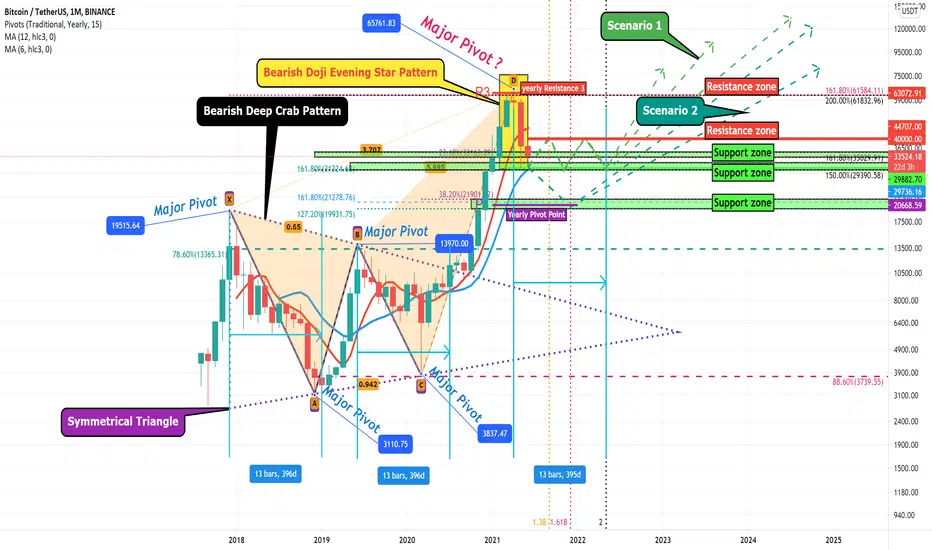
Bitcoin Long-term Analyze (Monthly Time frame)📆Today, I want to speak about Bitcoin's Long-term Analyze ( Monthly Time frame).
First, For long-term analysis , it is better to use logarithmic charts (Do not forget, if you want to use fibs , you have to turn on Fib Levels based on log scale ). I was able to find 4 Major pivots on the BTCUSDT chart, these pivots were able to make a Symmetrical Triangle .
Also, around 65761$ I found == Bearish Deep Crab Harmonic Pattern + Bearish Doji Evening Star Pattern ( it can verify our harmonic pattern / This pattern can make reverse or range on charts) + yearly Resistance 3
For finding the Next Major Pivot, first, we have to know the rules of Major pivots . If point D of our harmonic pattern wants to be a major pivot, the price must return at least 38.2% of point C to D (This rule makes Scenario 2 ) OR price has to rest ( at the time ) at least 38.2% of point C to D (This rule makes Scenario 1 ).
In addition, I found one circle on the Monthly Time frame . BTC wants about 13 months or one year to start the next bullish movement . This circle will happen again? 🧐
As I said, I have two Scenarios :
Scenario 1 : BTC will run between 30000$ until 40000$ ( Range channel ) for at least about 2 months and 22day (If Point D wants to be a Major pivot/ Time Retracement ) OR Maximum until May 2022 😱. I think that after this correction price can go UP 80$k-91$k // 104$k-107$k // even 130$k-140$k .
Scenario 2 : BTC will go down until 22000$ - 19900$ (If Point D wants to be a Major pivot/ Price Retracement ). I think that after this correction price can go UP 81$k-871$k // 119$k-128$k .
My Suggestion : please DO NOT buy Coins for Midterm and Long-term investment until the market finds a way.
Do not forget to put Stop loss for your positions (For every position you want to open)
Please follow your strategy , this is just my idea, and I will be glad to see your ideas on this post.
Please do not forget the 'like' button :) & Share it with your friends, Thanks, and Trade safe.
Good luck
Reset QQQ 3rd DiamondSet the yellow diamond to QQQ's pre-market high for a good fit the price action inside the diamond darts is full of choppy wicks..

AAPL 15 min Diamond Green ArrowScouting a weekly play for next week, Big Diamond Patterns, vs Diamonds made from Fib Res Speed Circles, in the Pattern Trading Definition of a Diamond, leave more Diamond Patterns in their wakes. Diamonds are for Theta Burn..

Fib circleI have question, why anchor points of fib circles, base line is placed between 100 - 162 % ring, not on a specific ring, ideally 100 % ring.
Kindly clarify
Thanks

XRP SHOWS A LONG TERM WEAKNESS FALLING CHART PATTERNS ATMi am not very optimistic with xrp in general, xrp suffers to hold its value in the past from my point of view
as i was seeing downwards chartpatterns i like to introduce you a possibility in the short term.

Altcoins - Trend Line or Fib Circle - something's gotta give!Here is a long term analysis of the altcoins market cap. We are sitting on a pretty strong horizontal resistance, but we are being pushed by this fib circle which was never broken before.
As its a 3D chart this will be resolved rather quickly, but as you see many fakeouts in history where we break a line, just to have a massive move on the opposite side in the next candle.
If we do break the fib line and confirm it as support it could be the beginning of a nice mini bull run for alts!


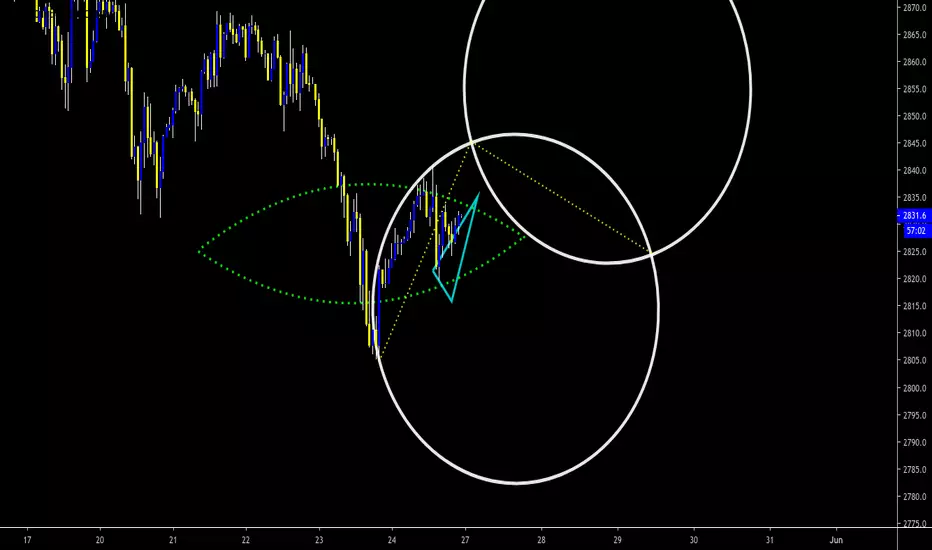
SILVER | D | CIRCLES & TRIANGLEGeo charting is a mix of math, art and love. Harmonic Resonance on display.. enjoy!!
Cheers,
Keops

the best fib circles for BTCyou can use this levels for another markets (altcoin/btc) these are the best levels

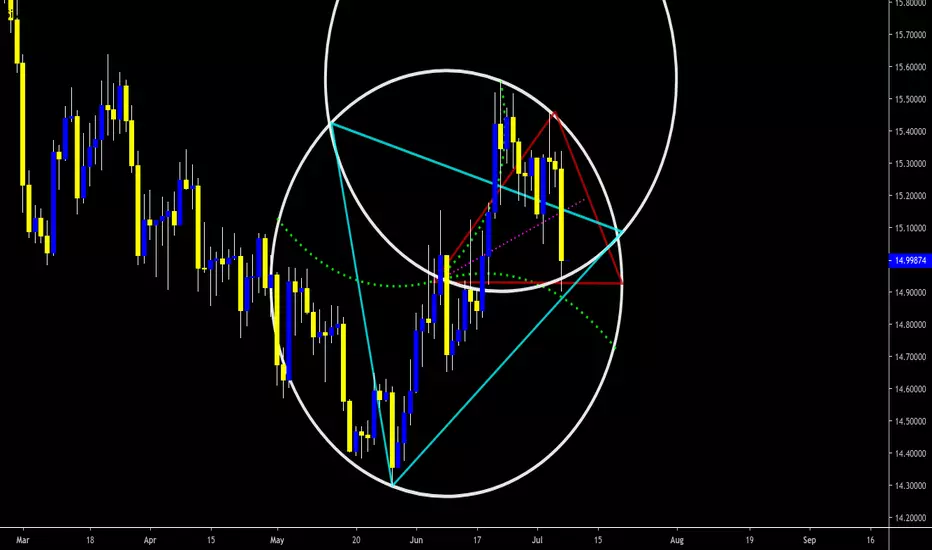
ETHUSD | 1H | CIRCLES & TRIANGLEPotential bounce for |eth| 1h. Testing this new long geo setup. enjoy!!
Cheers,
Keops


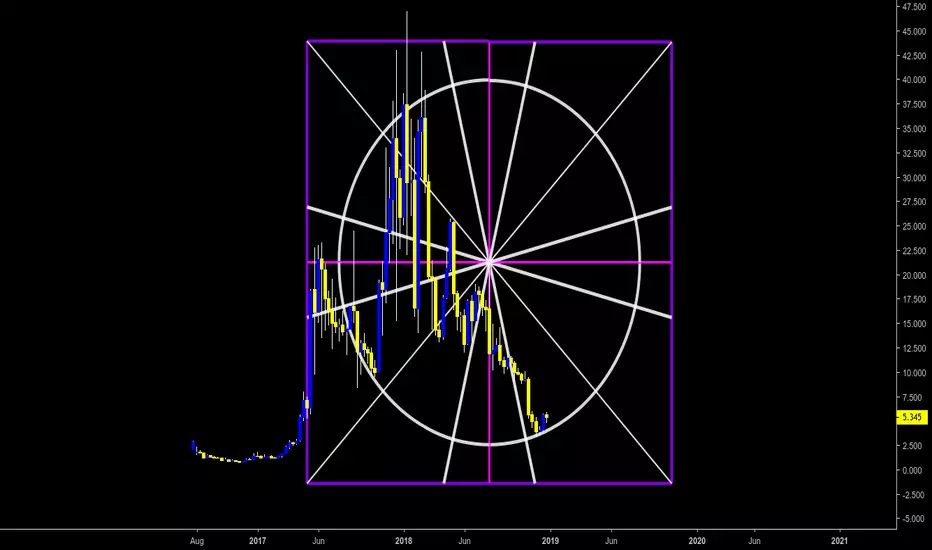
ETCUSD | 9D | FULL GANN CIRCLE SETUPSome short term resistance is expected shortly then a breakout in Jan 2019 (Jan 05+) is very likely. enjoy!
Cheers,
Keops
Crypto Bottom Seems To Be InMy technical analysis show that the bottom could be in here very well. Seems like a weird bottom, I know, but sometimes traders have to accept a weird bottom. I analyzed a few cryptocurrencies and all of them show bottom action.