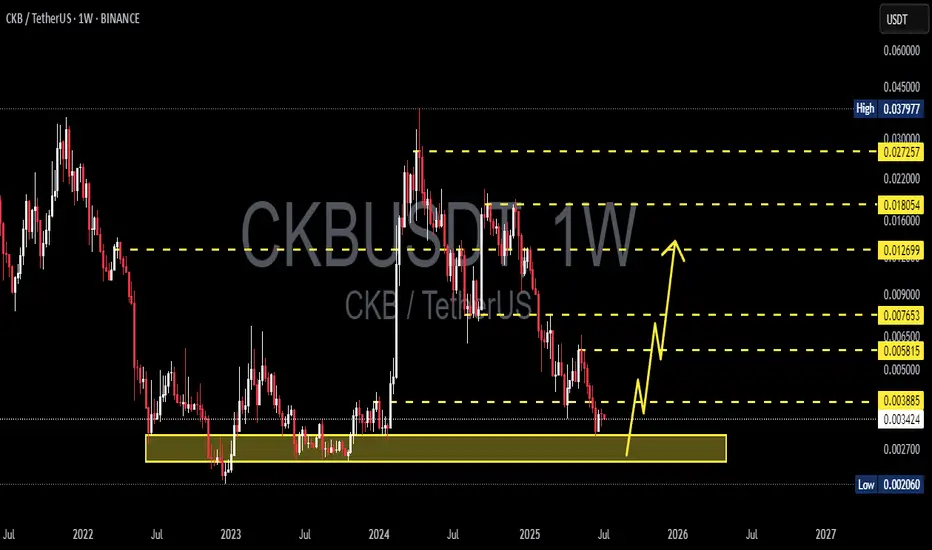
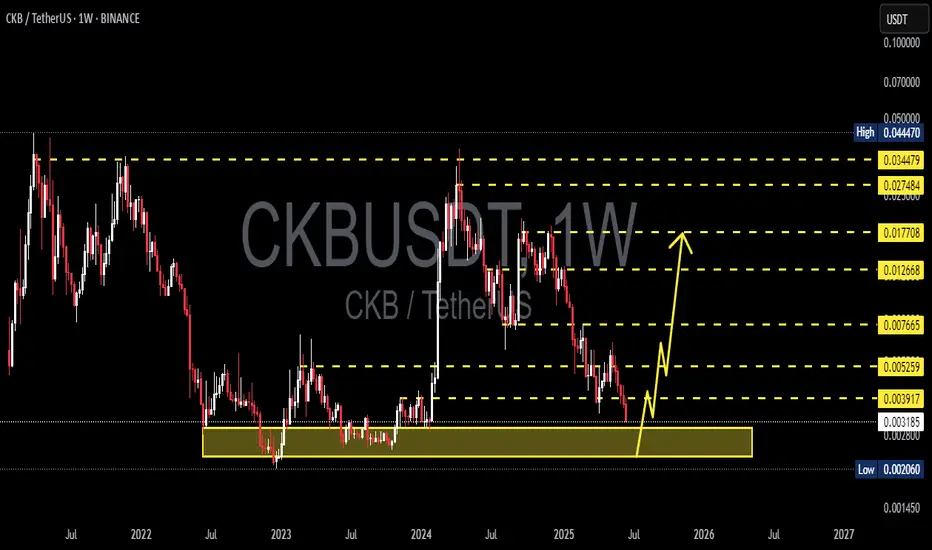
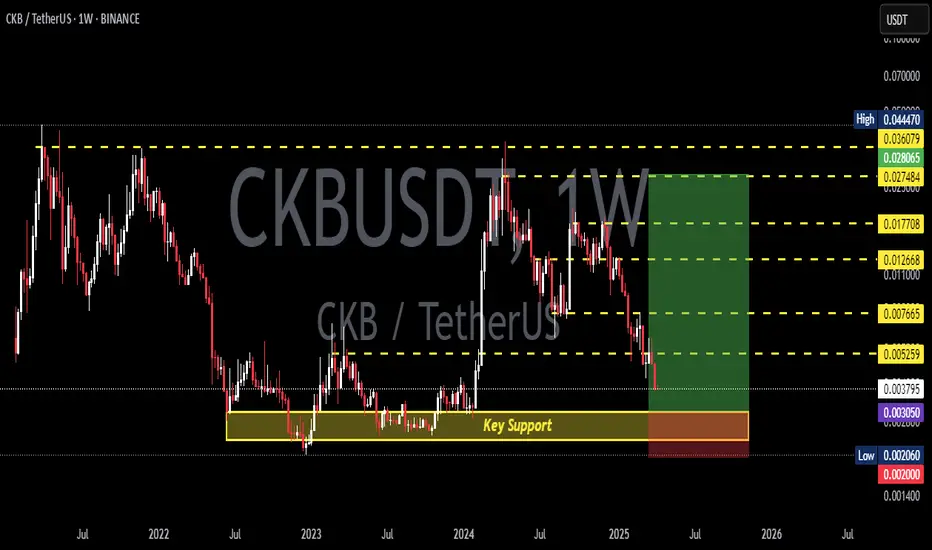
CKBUSDT Enters Critical Accumulation Zone – Multi-X Rebound🧠 Overview:
After a prolonged downtrend throughout early 2025, CKB/USDT has now returned to a major macro support zone between $0.0026 – $0.0035 — a historically strong accumulation range seen during 2022–2023. This area has previously triggered powerful rallies, and once again, the market is flashing early signs of a potential trend reversal.
📈 Bullish Scenario (Potential Rebound):
1. Well-Tested Demand Zone:
The area between $0.0026 – $0.0035 has acted as a long-term floor multiple times over the past 2 years.
This suggests strong institutional accumulation or smart money positioning.
2. Rising Volume Could Confirm Trend Reversal:
A surge in volume from this range could validate a transition into a markup phase (Wyckoff Theory).
3. Stair-Step Rally Potential:
Immediate resistance: $0.0050 – $0.0058
Mid-term target: $0.0076 – $0.0090
Major breakout zone: $0.0127 – $0.0180
4. Technical Projection:
Formation of a Double Bottom or Inverse Head & Shoulders could signal a strong macro reversal.
If confirmed, price could aim for $0.027 – $0.038+ in the longer term.
5. Market Sentiment & Timing:
Historically, altcoins like CKB rally after Bitcoin dominance cools off or when BTC moves sideways.
📉 Bearish Scenario (Breakdown Risk):
1. Losing Macro Support:
If price breaks below $0.0026, further downside may accelerate toward sub-$0.0020 levels.
2. Fakeouts Without Volume:
A weak bounce from support without volume could indicate a bull trap or short-term relief rally only.
3. Sideways Risk:
Extended consolidation or ranging may continue for weeks if there’s no strong catalyst or market-wide recovery.
📐 Structure & Pattern Insights:
Long-Term Accumulation Range: The current price action mirrors the accumulation phase from 2022–2023, possibly forming a Wyckoff Re-accumulation structure.
Reversal Patterns Forming: With a potential higher low next week, we may see an Inverse Head & Shoulders begin to take shape.
📝 Conclusion:
CKB is currently in a "high-reward, low-risk" zone from a swing trader’s perspective. Price is near macro bottom levels, and any breakout from here could result in multi-fold returns in the medium to long term.
However, confirmation through volume and structure breakout is essential. Without that, the risk of prolonged ranging or deeper correction remains.
#CKBUSDT #CKB #AltcoinSeason #CryptoBreakout #TechnicalAnalysis #InverseHeadAndShoulders #WyckoffAccumulation #BullishReversal #CryptoGems #CryptoSetup
Ckbusdtbuy
CKBUSDT 1W Analysis CKB ~ 1W Analysis
#CKB This is the lowest support for now. Buy here with a short term target of at least 15%+ from this support.
CKBUSDT 4D AnalysisCKB ~ 4D Analysis
#CKB Buy gradually from here if you still have confidence in this coin with a short term target of at least 20%+ from here.

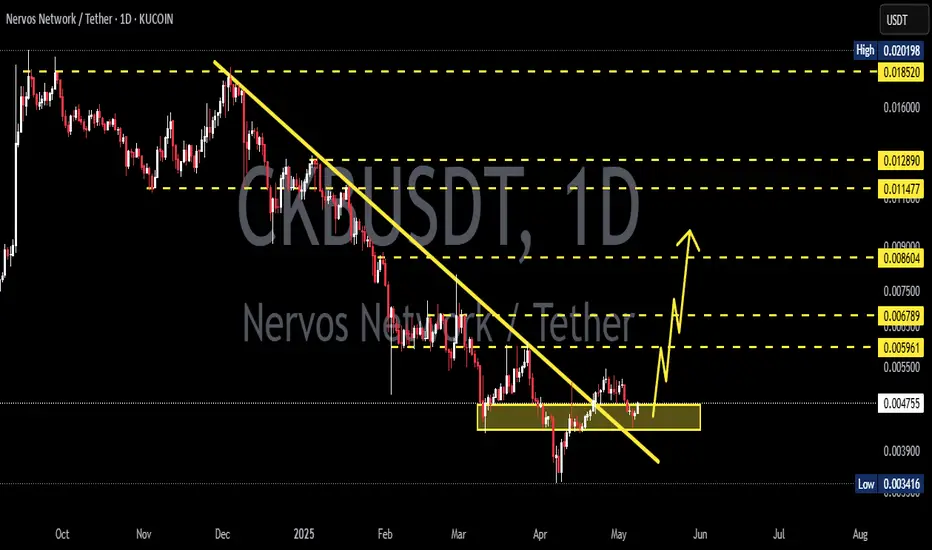
CKBUSDT 1D AnalysisCKB ~ 1D Analysis
#CKB Buy gradually from here if you still have confidence in this coin with a short term target of at least 10%+ from here.
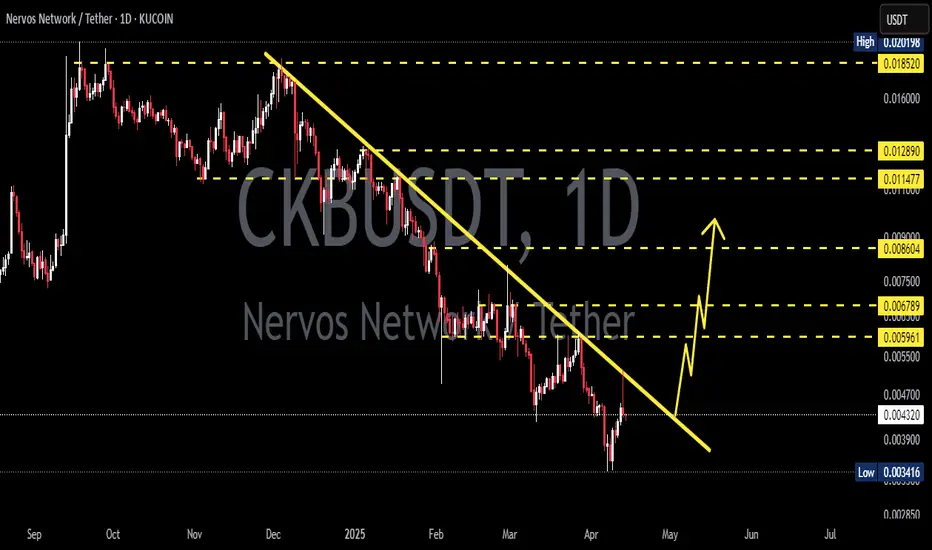
CKBUSDT 1DCKB ~ 1D Analysis
#CKB Buy after successfully penetrating this resistant line with a short -term target of at least 10%+ from here.
CKBUSDT 1WCKB ~ 1W Analysis
#CKB Buy when visiting this support with a short -term target of at least 15%+.
CKBUSDT 5DCKB ~ 5D Analysis
#CKB If you still have a Conviction on this coin,. This support you can consider to start buying back with a minimum target of 20%+.

CKBUSDT 5DCKB ~ 5D
#CKB Coming back to revisit this support,. If you still have Conviction on this coin,. This support block would be a very good buying place for now,. With minimal targets 20%++

#CKB/USDT#CKB
The price is moving within a bearish channel pattern on the 12-hour frame, which is a strong retracement pattern and was broken to the upside.
We have a bounce from a major support area in green at .008700
We have a tendency to stabilize above the Moving Average 100
We have a downtrend on the RSI indicator that supports the rise and gives greater momentum, and the price is based on it to rise after it was broken upward.
Entry price is 0.011000
The first target is 0.015500
The second goal is 0.019000
The third goal is 0.02230

CKBUSDT 1DCKB ~ 1D
#CKB Continue moving in this descending pattern.
The best way for now, Buy on breaking the resistance line of this pattern or buy on a retest of this key support.

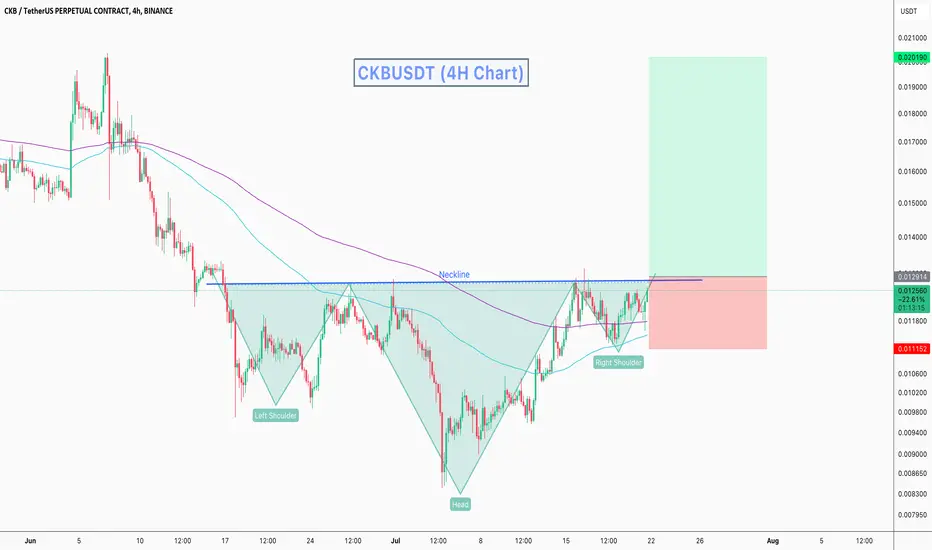
CKBUSDT Inverse Head and Shoulders PatternCKBUSDT Technical analysis update
CKB price is forming an inverse head and shoulders pattern. The price of the right shoulder is now moving towards the neckline for a potential breakout, 100 and 200 EMA act as good support for the right shoulder. If the breakout occurs, we can expect a strong bullish move in CKB.
Only buy after the neckline breakout.
Stop Loss: $0.0111
CKBUSDT 1DCKB ~ 1D
#CKB Make a purchase after successfully breaking through this resistance line. with a minimum target of 10%++

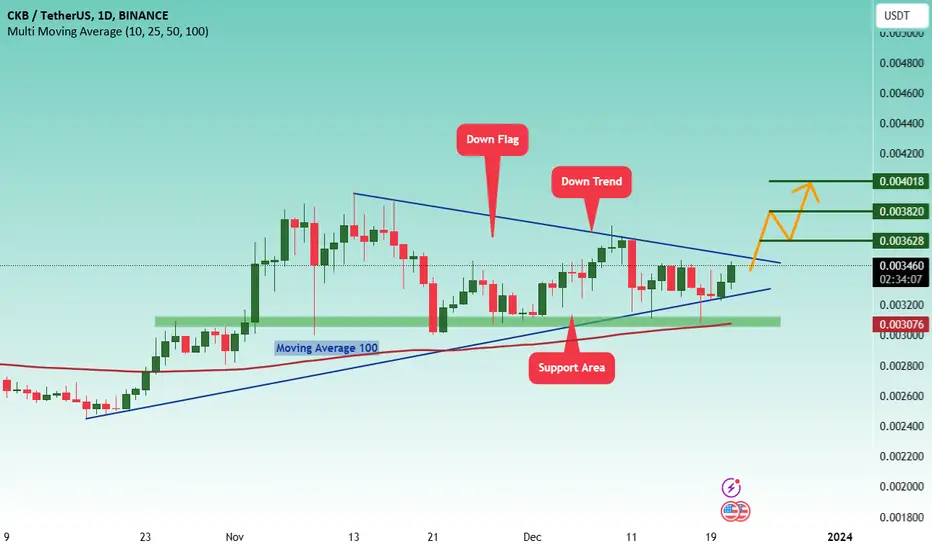
#CKB/USDT#CKB
The price is moving in a triangle from the beginning of November 2023
We are about to break the triangle strongly
We are top Moving Average 100
The price now is 0.003464
The first target is 0.003457
The second goal is 0.003820
The third goal is 0.004000
CKBUSDT Resistance Breakout!CKBUSDT Technical analysis update
CKB price has approached its resistance line, accompanied by a gradual increase in volume on the 1H chart. While this could suggest potential upward movement.
Buy zone : Below $0.0155
Stop loss : $0.0135
Regards
Hexa

Ckbusdt | Most Probably | Ckbusdt
Liq pending uper side, seems like forming abcd bullish pattern
Note : Always Trade With Our Own Research
If You Want Perfect Entry Targets Join Us
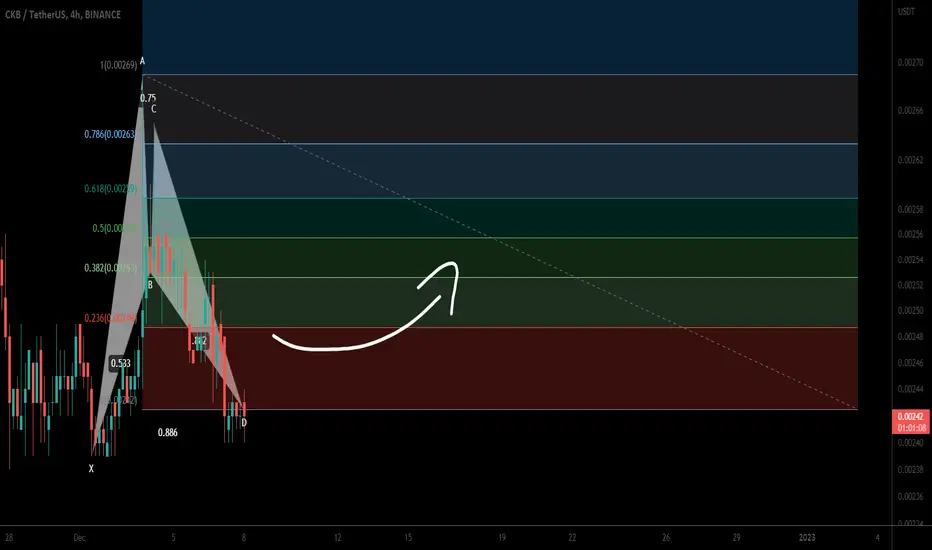
Nervos Network (CKB) formed bullish BAT for upto 10% moveHi dear friends, hope you are well and welcome to the new trade setup of Nervos Network (CKB) coin with US Dollar pair.
Recently we caught a nice pump of CKB
Now again on a 4-hr time frame, CKB has formed a bullish BAT pattern.
Note: Above idea is for educational purpose only. It is advised to diversify and strictly follow the stop loss, and don't get stuck with trade
CKBUSDT 1D: Possible LONGCKBUSDT 1D: Possible LONG
Based on the daily chart, the price rebounded from 0.01800, indicating a possible subsequent rise to 0.03600.

CKBUSD UpdateCKBUSD has formed two nice double bottoms, on a bit of a lean
The first double bottom led to a nice run, with a small pause in the middle of the channel that can be drawn
Applying this to the second double bottom we can assume that this 'pause' occurs at the lower band of the channel
After this, price should continue upwards, possibly even breaking the channel.
This is contrary to my last analysis on the coin. However I have taken another look and changed my mind.

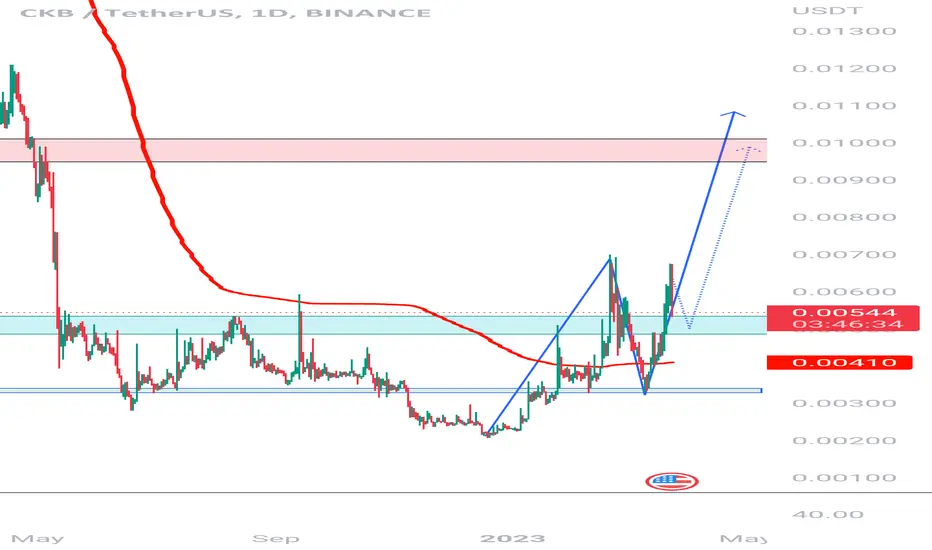
CKB double bottom Based on my TA, CKB formed a double bottom and broke above it achieving the targets.
if it crossed 0.0298 and closed above it, i will look to go long
SL: 0.0273
TP1: 0.0319
TP2: 0.035
TP3:0.038
TP4: 0.04312

CKBUSDT Daily TimeframeSNIPER STRATEGY (new version)
It works ALMOST ON ANY CHART.
It produces Weak, Medium and Strong signals based on consisting elements.
NOT ALL TARGETS CAN BE ACHIEVED, let's make that clear.
TARGETS OR ENTRY PRICES ARE STRONG SUPPORT AND RESISTANCE LEVELS SO THEY CAN ACT LIKE PIVOT POINTS AND REVERSE THE WAVE (or act like a mirror that can reflects light) BASED ON STRENGTH OF THAT LEVEL.
ENTRY PRICE BLACK COLOR
MOST PROBABLE SCENARIOS TARGETS GREEN COLOR
LEAST PROBABLE SCENARIOS TARGETS RED COLOR
TARGETS ARE NOT EXACT NUMBERS THEY ARE MORE LIKE A ZONE.
DO NOT USE THIS STROTEGY FOR LEVERAGED TRADING.
It will not give you the whole wave like any other strategy out there but it will give you a huge part of the wave.
The BEST TIMEFRAMES for this strategy are Daily, Weekly and Monthly however it can work on any timeframe.
Consider those points and you will have a huge advantage in the market.
There is a lot more about this strategy.
It can predict possible target and also give you almost exact buy or sell time on the spot.
I am developing it even more so stay tuned and start to follow me for more signals and forecasts.
START BELIEVING AND GOOD LUCK
HADIMOZAYAN
