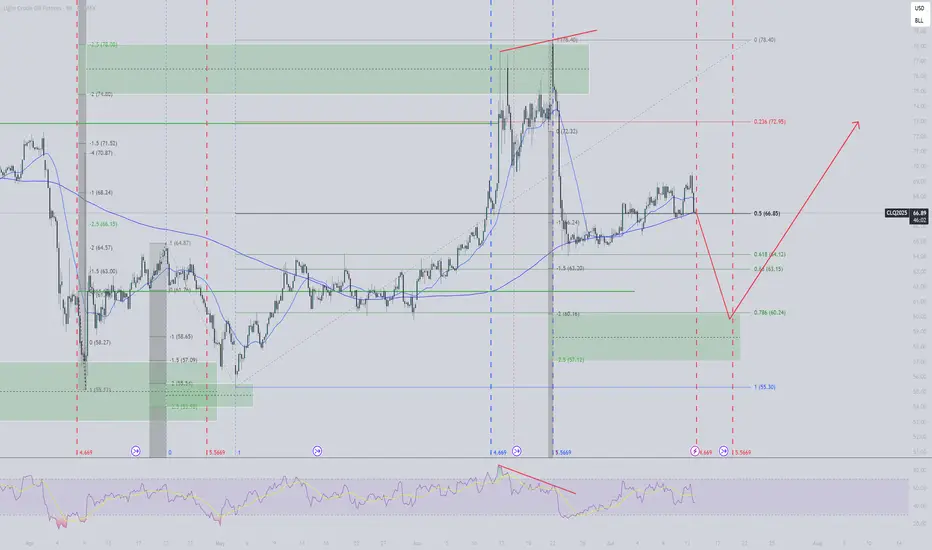
CL down sub $60 before moving up above $73Expected support or reversal zone based on last swing high for CL is at $60. This matches with 0.786 fib level of last move up, suggesting a standard SBS structure forming. Expecting a move up to at least $73 (fib 0.236), possibly also well beyond this.
Based on time fib of last swing high I expect the bottom to occur before July 20th.
Cl!
Futures Watchlist for week ending 6/27/2025Come join as i go through the future tickers that im watching this week and where i see them going. With war talks filling up on social media this will add to our volatility and we will look at key levels to capitalize off of it! Let me know your thoughts on these tickers. Also let me know if there is another symbol futures or stocks that you want me to breakdown for you!

What Is the Base Price for Oil?What is the base price for oil? Specifically, today we will discuss crude oil, and we can apply this understanding to other commodities as well.
I won't go into too much technical detail about the difference between the base price and the cost price for crude oil, but for most people, it helps to see the title as “Is there a bottom-line price or support level for crude oil?”
My answer is yes, and this is due to inflation. Over time, we tend to pay higher prices for food, gas and many others that we consume.
WTI Crude Oil Futures & Options
Ticker: MCL
Minimum fluctuation:
0.01 per barrel = $1.00
Disclaimer:
• What presented here is not a recommendation, please consult your licensed broker.
• Our mission is to create lateral thinking skills for every investor and trader, knowing when to take a calculated risk with market uncertainty and a bolder risk when opportunity arises.
CME Real-time Market Data help identify trading set-ups in real-time and express my market views. If you have futures in your trading portfolio, you can check out on CME Group data plans available that suit your trading needs tradingview.sweetlogin.com
Trading the Micro: www.cmegroup.com
www.cmegroup.com

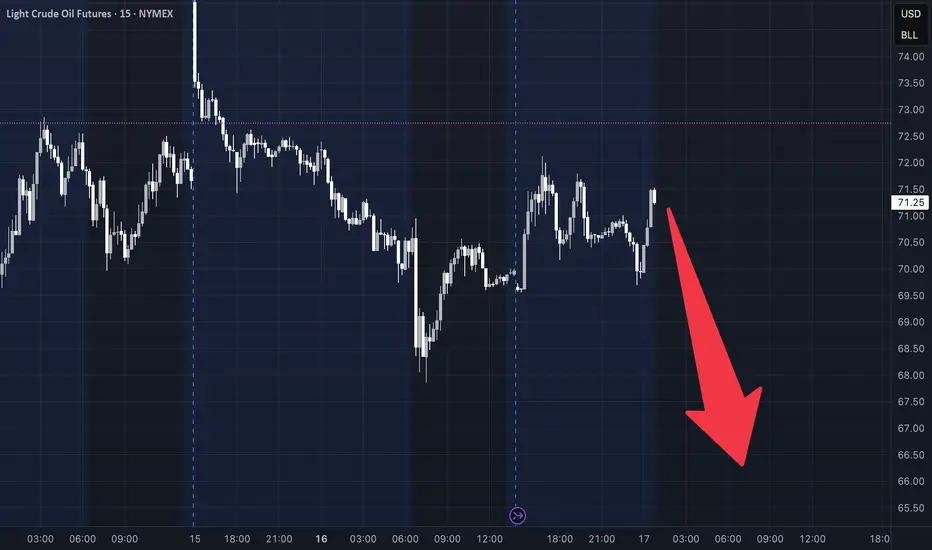
CL Futures Weekly Trade Setup — June 17, 2025🛢️ CL Futures Weekly Trade Setup — June 17, 2025
🎯 Instrument: CL (Crude Oil Futures)
📉 Strategy: Short Swing
📅 Entry Timing: Market Open
📈 Confidence: 68%
🔍 Model Insights Recap
🧠 Grok/xAI – Bearish due to overbought RSI + price stalling near MAs
🤖 Claude/Anthropic – Bearish pullback expected, despite recent strength
📊 Llama/Meta – Overextended Bollinger Band + RSI = short bias
🧬 DeepSeek – Supports downside via divergence + high volatility
⚠️ Gemini/Google – Bullish thesis based on momentum; diverges from consensus
📉 Consensus Takeaway
While short-term momentum is strong, most models forecast a pullback due to:
🔼 Overbought RSI readings
📈 Price extended well above key moving averages
🧨 High volatility and profit-taking zone near $73–$74
✅ Recommended Trade Setup
Metric Value
🔀 Direction Short
🎯 Entry Price $72.65
🛑 Stop Loss $74.20
🎯 Take Profit $68.80
📏 Size 1 contract
📈 Confidence 68%
⏰ Timing Market Open
⚠️ Key Risks & Considerations
🌍 Geopolitical events or OPEC news can cause unexpected surges
📉 If bullish momentum resumes, upside breakout could invalidate short thesis
📏 Risk management is critical—stick to stop-loss if price breaks above $74.20
🧾 TRADE_DETAILS (JSON Format)
json
Copy
Edit
{
"instrument": "CL",
"direction": "short",
"entry_price": 72.65,
"stop_loss": 74.20,
"take_profit": 68.80,
"size": 1,
"confidence": 0.68,
"entry_timing": "market_open"
}
💡 Watch price action at the open. If oil opens weak or fails to reclaim $73, this short setup has a strong edge.
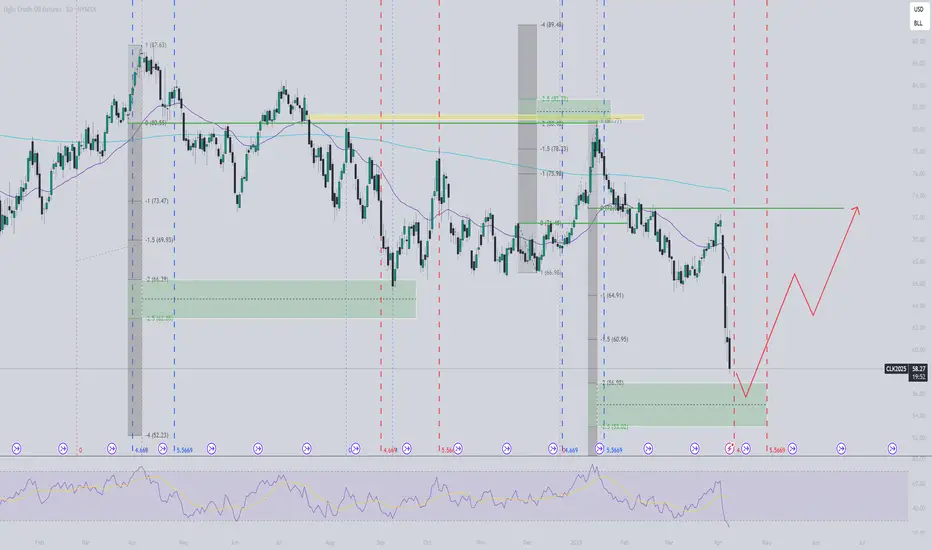
CL ready for new move upBased on time fib and Feigenbaum constants, CL is closing in on the bottom for this swing, expected within marked timezone. The swing highs/lows follows the Feigenbaum projections for the last few swings. I expect a dip below $57 before a new run higher, at least to $72-73.
WTI Crude oil Holds Support Despite OPEC Production IncreaseWTI crude was on the ropes Monday morning following another surprise production increase from OPEC+. Yet despite the weak start to the week, oil prices held above the April low despite the bearish headlines.
Given we've already seen a -15% decline over the prior eight days and a bullish divergence has formed, I suspect some bullish mean reversion is due. Bulls could seek a move to the $60 area, near the April VPOC. Note that the December 2023 low might also provide some resistance along the way.
Matt Simpson, Market Analyst at City Index and Forex.com

Looking to short CL to continue lowerCL is making a corrective move higher before moving down to the ultimate target of last Daily structure leg down. It retraced to Daily bearish Fair Value Gaps (internal range liquidity zones) which should act as resistance. 15M bearish structure is in Extreme premium.
I'm looking for CL to break down bullish corrective structure on 5M chart and start a final move down.

Looking to short CLCL is starting to show weakness on most of the timeframes for potential continuation of leg down of Daily bearish structure.
Looking for retrace to 15M premium zone for a possible short

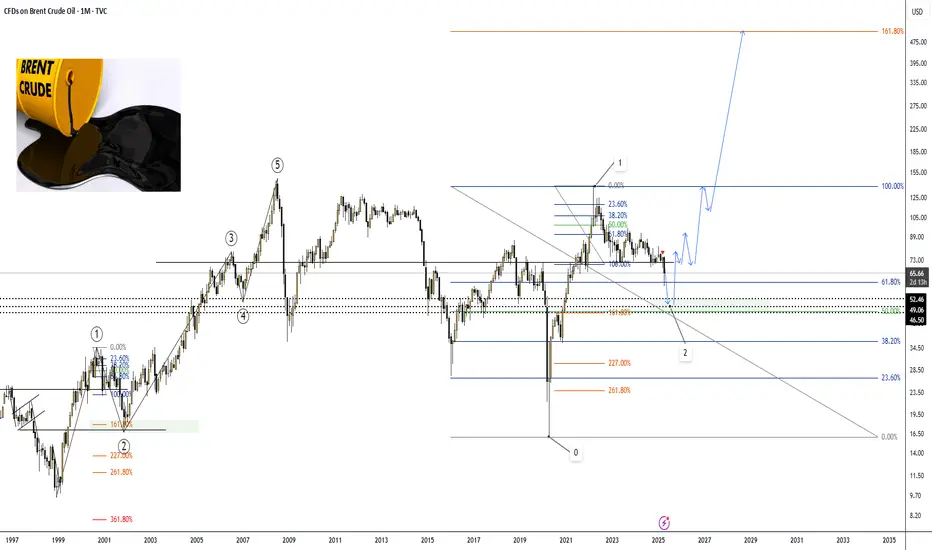
Potential Decline of Brent Oil Price to $50 in the Near Future.Brief Overview of Events and News Explaining the Potential Decline of Brent Oil Price to $50 in the Near Future.
➖ Increased OPEC+ Production:
On April 3, 2025, eight OPEC+ countries unexpectedly decided to accelerate production increases, adding 411,000 barrels per day starting in May. This decision triggered a price drop, with Brent falling 6.42% to $70.14 per barrel at the time.
Analysts like Amrita Sen from Energy Aspects noted that this move pressures “lagging” countries to meet quotas, but the market interpreted it as an oversupply signal.
Source: OilPrice.com, "OPEC+ to Raise Oil Production by More Than Expected in May," April 3, 2025 (oilprice.com)
➖ Decreased Demand Due to Economic Challenges:
On April 14, 2025, OPEC revised its 2025 oil demand growth forecast downward by 150,000 barrels per day to 1.3 million barrels per day, citing trade tensions and weak economic indicators. JPMorgan also raised the likelihood of a global recession to 60%.
Source: OilPrice.com, "OPEC Lowers 2025 Oil Demand Forecast on Trade Tensions," April 14, 2025 (oilprice.com)
➖ Trade Tariffs and Global Instability:
On April 3, 2025, U.S. President Donald Trump announced new tariffs on trading partners, heightening recession fears. Fitch Ratings described this as the highest level of U.S. import tariffs since 1910. Brent dropped 4% immediately following the announcement.
Source: OilPrice.com, "OPEC+ to Raise Oil Production by More Than Expected in May," April 3, 2025 (oilprice.com)
➖ Geopolitical De-escalation:
On April 25, 2025, reports emerged of progress in U.S.-Russia talks on Ukraine, as well as Iran’s openness to nuclear negotiations. This reduces geopolitical risks and increases the likelihood of higher oil supply on the market.
Source: OilPrice.com, "Oil Set For Weekly Loss on OPEC+ Supply Rumors," April 25, 2025 (oilprice.com)
Technical Analysis Section:
The monthly chart shows similarities between the 1999–2002 and 2020–2025 periods: an initial impulse, followed by a correction, and then a 6-year upward trend.
Nearest entry point targets at the 161.8% Fibonacci level:
• $52,46
• $49,06
• $46,50
Growth Potential
Medium-term:
• $138,00
Long-term:
• $500,00
Once the price of oil UKOIL reaches $52.46, a review for the entry point will be prepared.
Charts:
•
•
Bearish Analysis: Crude Oil (CL Futures)1️⃣ Rejected at Supply Zone:
The price was strongly rejected from the $80 supply zone, where sellers clearly took control. This zone has been a key resistance level, and the recent bearish momentum confirms strong selling pressure.
2️⃣ Bearish Momentum in Play:
The sharp decline from the supply zone has broken short-term supports, signaling sustained bearish movement. The next major target is the $66–$67 demand zone, where buyers may step in.
3️⃣ Technical Indicators Supporting Bears:
RSI: At 54.88, the RSI suggests there’s room for further downside before reaching oversold conditions.
Stochastic Oscillator: A bearish crossover between the %K and %D lines confirms increasing selling pressure, with momentum favoring a continuation of the trend.
4️⃣ Fundamentals Adding Pressure:
Trump’s Energy Policy: Potential policy changes to increase domestic oil supply could create a bearish outlook for crude oil.
Stronger Dollar: The strengthening USD makes oil more expensive for global buyers, further dampening demand and supporting the bearish case.
🎯 Strategy:
TP1: $75 (Near-term target, close to the current price).
TP2: $74.30 (Minor support, a potential bounce or pause area).
TP3: $72 (A strong psychological and technical level).
TP4: $67 (Major demand zone).
🔔 Note:
Consider using a positive stop loss to secure gains and reduce risk. Always practice proper risk management to protect your capital and maintain consistent results.

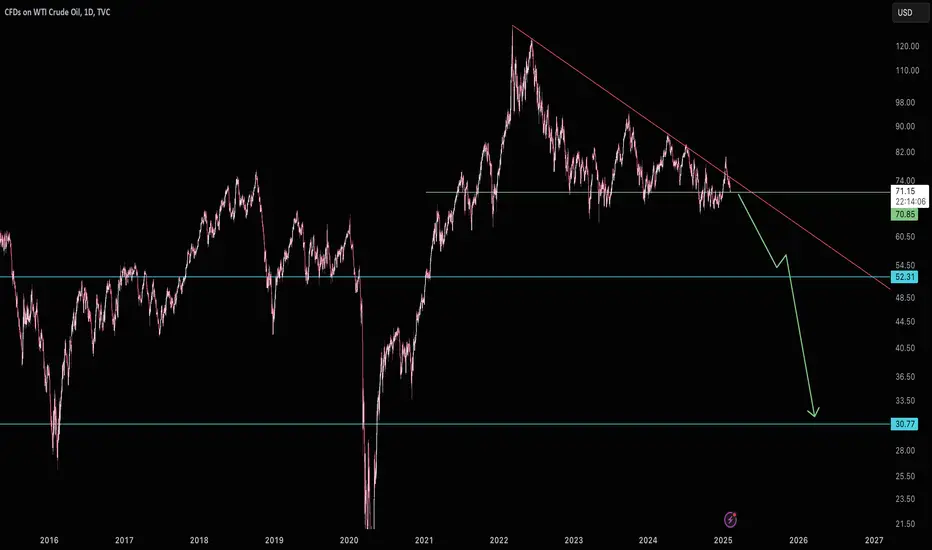
Possible Crude Down to $30/BarrelSince the covid oil bull market we've yet to have a breakdown as supply catches back up with equilibrium. I would expect at some point we get a price back down to $30. First major support would potentially be $52.
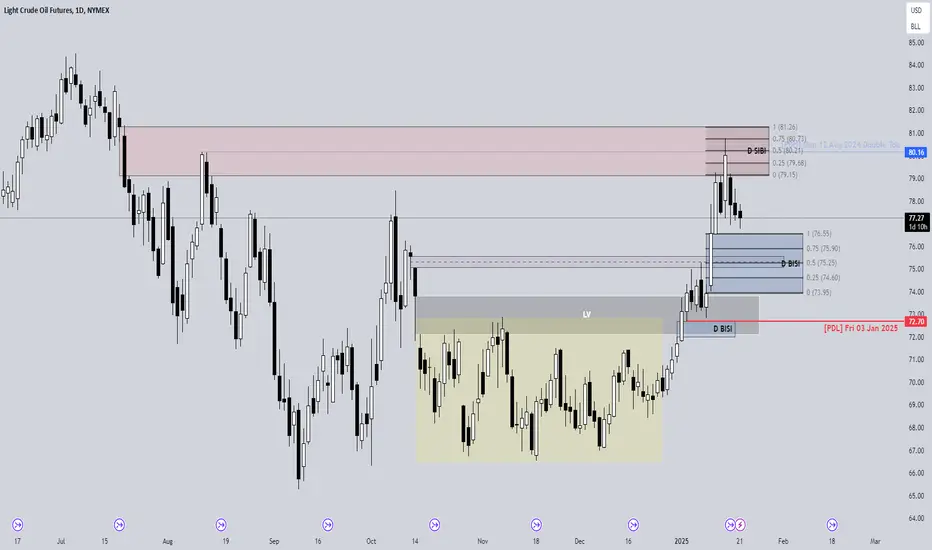
CL Bearish Outlook Look like after price took out BSL at the PDH from 80.16 it has moved lower and has been targeting PDLs. There is a nice discount D BISI that I believe price will trade into and if price is truly Bearish then it will trade right through the D BISI CE level and find minimal support and then the next area of focus could be the double bottom at 72.70
Lets continue to watch price and see how it delivers.
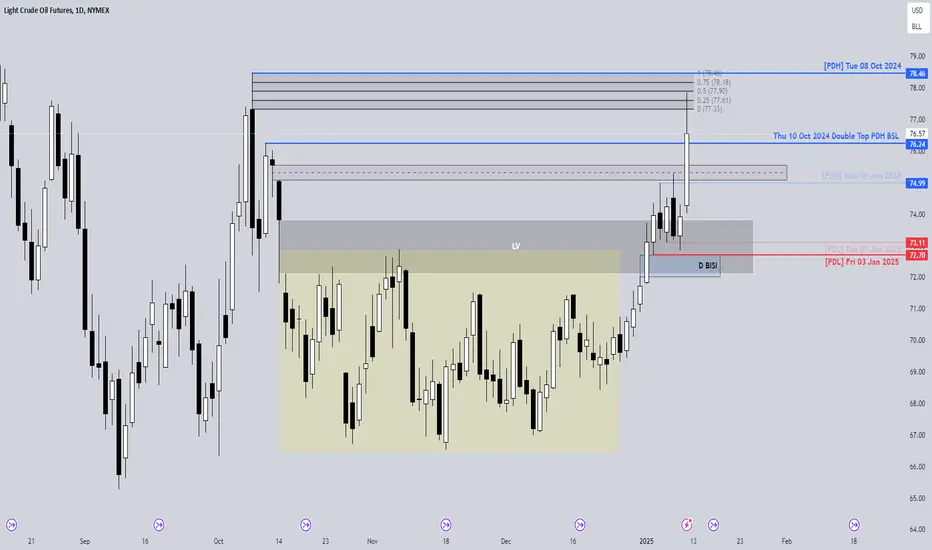
CL continued Bullish BiasI will keep my bias Bullish with the draw being the PDH at 80.16 Now price could retrace into the D Discount Wick into the CE level and then trade higher but my overall Focus is the double top BSL.
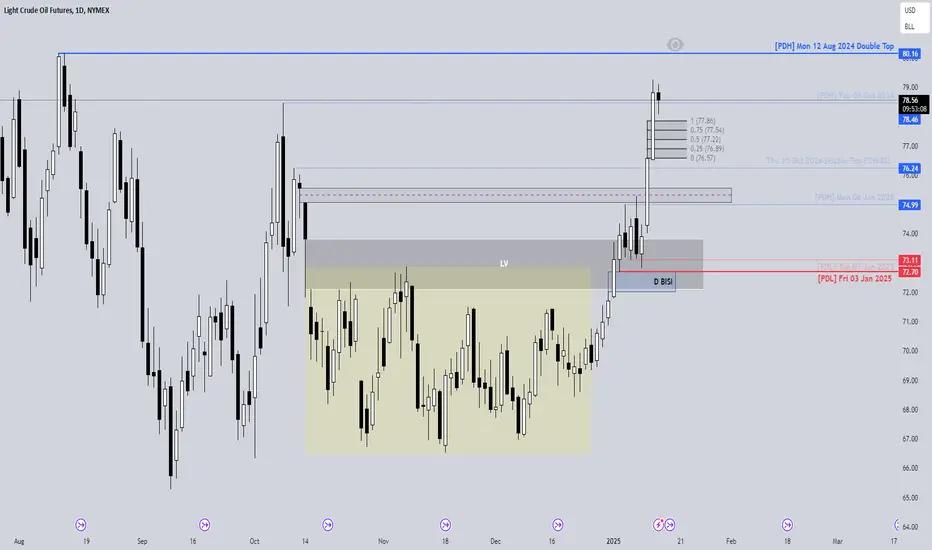
CL Week Review 01/06/25 - 01/10/25Looks like my Directional Bias for CL was off. Instead of price coming lower to fill in the BISI and take the PDLs it rallied higher through the Volume Imbalance and raided all the BSL. Now that wick higher on Friday did not stop at a random spot. Look closely and you will notice its the Premium Daily 50% CE level of the wick and price reversed nicely off from there.
Now the question remains does price justify to continue higher and take the BSL at 78.46 or does price reverse from there and then target the SSL and the D BISI?
Currently its still looking Bullish since price closed above the Volume Imbalance and the PDH from Thu Oct 10 2024 at 76.24 but lets see how price opens on Sunday and we can definitely expect a volatile week since there is a good amount of economic news drivers.
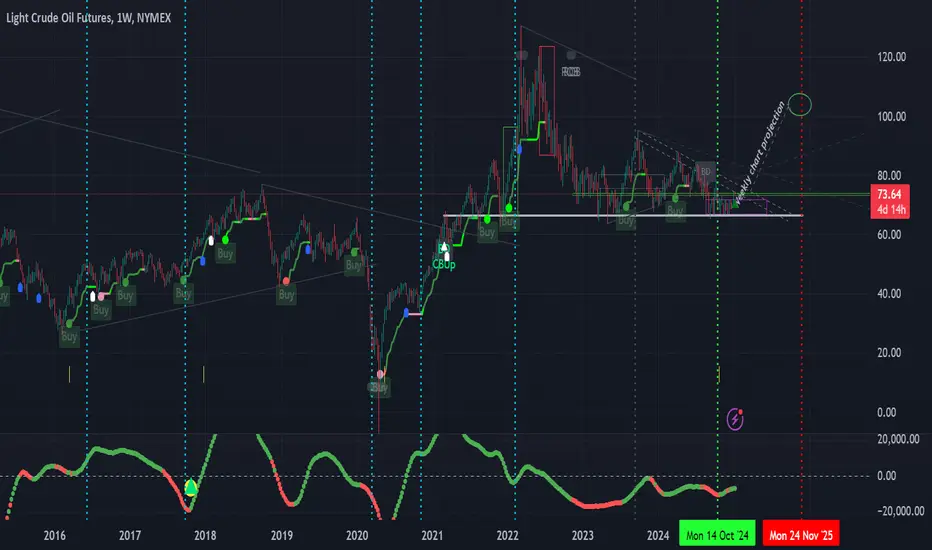
Crude Opportunity Part 1Previously, heads up about BTCUSD and it was pretty spot-on.
Oddly enough, CRUDE OIL CL1! is next.
For the first part, here we look at the marked time lines, and the effect after these time lines. 5 of the last 6 times, saw a bullish rally. Of these, 4 of the 5 occasions had the Rate of VolDiv (custom indicator) trend changed for an uptick.
In essence, the current weekly Crude Oil Futures CL1! show a similar set up ready for a spike and rally for Crude Oil. No fundamental reason (yet) but the technicals are projecting a billish scenario based on the technical set up.
Part 2 will look more in-depth and zoom into the recent time frame...
Stay tuned if you are keen...
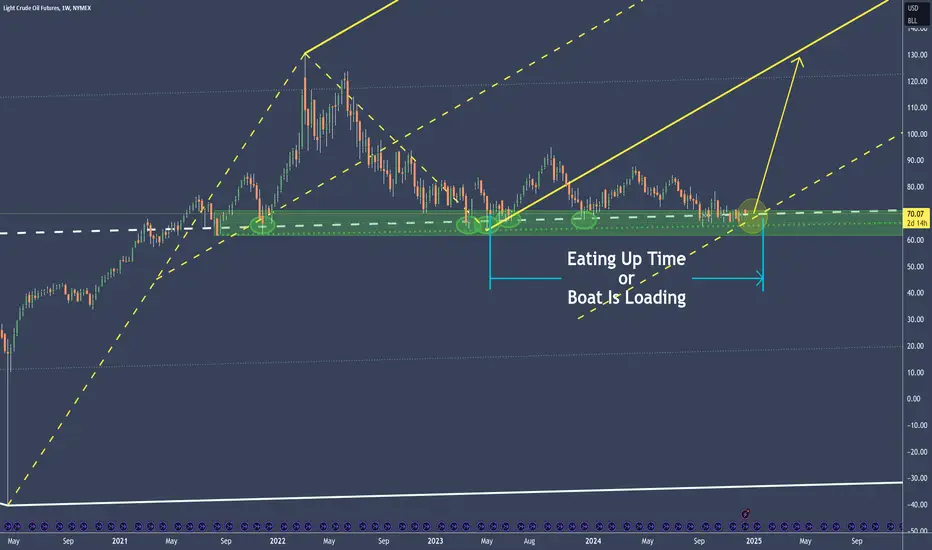
Crude Oil Eating Up Time - Plate almost emptyPrice bounced many times at the Green Support-Zone. It's the same level where the Huge Pendulums Fork Center-Line is (white-dashed).
Next, we have the Yellow Fork.
Price traded outside the L-MLH, bounced a couple times at the Support-Zone and eat up time.
But now, I think the "Plate" is almost empty.
Why? Price arrived at a decision point, a confluence point. This confluence point is where the Warning-Line and Price intersect.
To me, a Long Trade is more likely than a Short.
- world wide tensions
- so many bounces at the Support-Zone, they won't let price go down much
- price has not re-tested the L-MLH of the Yellow Pitchfork
As this is a very long term play, it's obvious that this Chart/Idea would serve to build a position, rather than using it as a simple trade.
Crude Oil Prices Fall Amid Economic and Geopolitical ShiftsSince the beginning of October, crude oil prices have been on a downward trend, dropping from $77 to $70 in less than three months. This decline can be attributed to several geopolitical and economic factors. During this period, global economic growth showed signs of slowing, raising concerns about future oil demand. Additionally, geopolitical tensions in major oil-producing regions eased, leading to a more stable supply outlook. These combined factors have exerted downward pressure on crude oil prices.

USOUSD (OIL), key support remains in play Thanks for checking our latest update. Today we are looking at oil on its daily chart.
The key questions we are asking today from a technical perspective are: Will we see key support continue to hold, and will the rough looking ending diagonal pattern confirm, setting off a new rally? Or could sellers finally break the discussed key support area, setting off a new leg lower?
Key support: $67 - $66.50.
As always, traders must remain vigilant and stay abreast of the latest updates from OPEC and geopolitical influences, as these factors can significantly impact the market.
Good trading from Eightcap.

Tracking Inflation with this Ratio - Crude Oil vs Gold RatioThe Fed is using this Crude Oil vs Gold ratio in tracking inflation.
The one in white is the inflation and the one in yellow is the Crude Oil vs Gold ratio.
We saw that when inflation peaked at 9% in June 2022, so did this ratio.
Although we recently saw a cut in interest rates, the yields are now moving higher, and gold has maintained its high point.
This makes us wonder: will inflation move toward the 2% target, or is it still at risk of rising further?
Micro WTI Crude Oil Futures & Options
Ticker: MCL
Minimum fluctuation:
0.01 per barrel = $1.00
Disclaimer:
• What presented here is not a recommendation, please consult your licensed broker.
• Our mission is to create lateral thinking skills for every investor and trader, knowing when to take a calculated risk with market uncertainty and a bolder risk when opportunity arises.
CME Real-time Market Data help identify trading set-ups in real-time and express my market views. If you have futures in your trading portfolio, you can check out on CME Group data plans available that suit your trading needs tradingview.sweetlogin.com

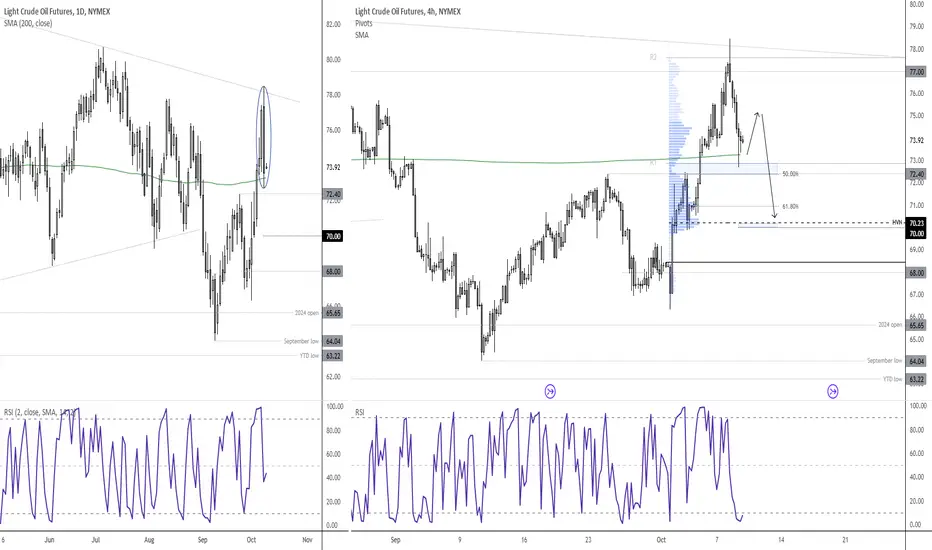
Crude oil saved by the 200-day MA (for now)A combination of factors saw crude oil snap its 5-day winning streak on Tuesday. China's equity markets plunged at double-digit levels when traders realised no new stimulus from China was to be unveiled after golden weak. US production forecasts were lowered by the EIA and concerns over the Middle East receded somewhat.
An elongated bearish engulfing / outside day formed after its daily high met resistance at the September 2023 trendline. Yet the 200-day MA came to the rescue. For now at least.
Given the 4-hour bullish hammer at the 200-day MA and weekly R1 pivot, alongside a heavily oversold RSI (2) on that timeframe, I suspect a cheeky bounce could be in order. Bulls could cautiously seek dips for a move to $75 or $76.
Yet the magnitude of Tuesday's selloff suggests bears may be lurking at higher prices to re-enter upon any such bounce. Bears could wait to fade into such levels in anticipation of a return to the $70, near a high-volume node (HVN) and 61.8% Fibonacci level.
MS
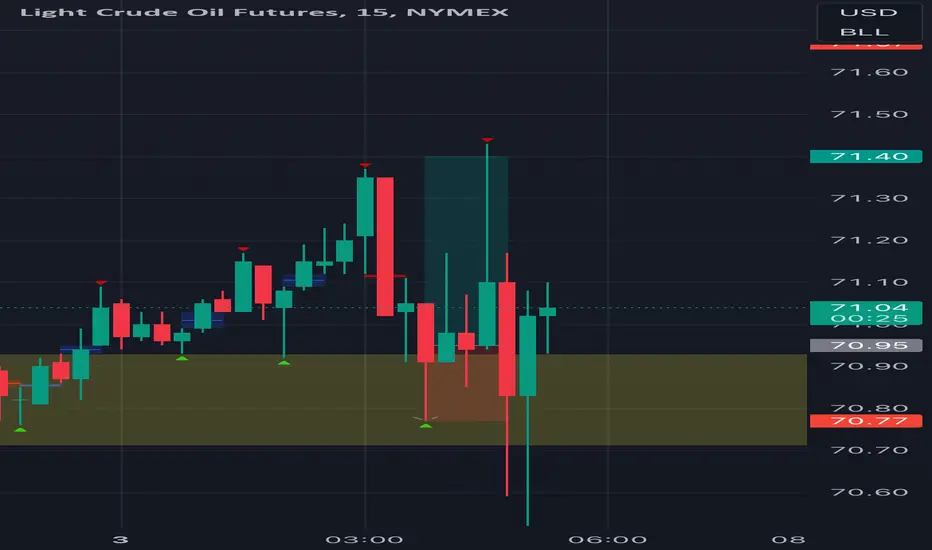
CL winning tradeBeautiful morning when you take a win on oil. This one will cover the heating bill for the season. All Glory To God I can cover someone else’s heating bill this winter as well.
You have to be obsessed if you want to make it in trading. You’re only as good as your last loss.
COT Strategy - Crude Oil LongsDISCLAIMER: This is not trade advice. This is for educational purposes only to demonstrate how I am looking to participate in this market. There is significant risk involved in trading, do your own homework and due diligence.
COT Strategy
Crude Oil (CL)
My COT strategy has me on alert for long trades in CL again this week. To clarify, this was setup last week also, and triggered me long this week via a CCI divergence long trigger. Based on this weeks COT strategy analysis, I think this is a nice market for further upside and will look to enter again via 18MA & 10H8C MAC entry methods.
COT Commercial Index: Buy Signal.
Net Positioning: Max long of last 3 years - bullish.
Small Spec Index: Buy Signal.
Valuation: Undervalued vs Gold & Treasuries.
Front Month Premium Market.
True Seasonal up to Mid October.
Supplementary Indicators: Stochastic.
Remember, this is not a "Long Now" idea. These indicators are not timing tools. They simply tell us that this market could have a move of some significance to the upside, which we will participate in with a Daily long trigger.
Good luck & good trading.

Smart Money Positioned to LONG Crude Oil - COT StrategyDISCLAIMER: This is not trade advice. This is for educational purposes only to demonstrate how I am looking to participate in this market. There is significant risk involved in trading, do your own homework and due diligence.
COT Strategy
LONG
Crude Oil (CL)
My COT strategy has me on alert for long trades in CL if we get a confirmed bullish change of trend on the Daily timeframe.
COT Commercial Index: Buy Signal
OI Analysis: Generally last few weeks OI has drifted lower while CM's adding to longs - bullish. CM's approaching extreme long positioning, but not quite there yet.
True Seasonal: True seasonal to go up until mid October - bullish.
COT Small Spec Index: Buy Signal
Front Month Premium - Bullish
Supplementary Indicators: %R & Stochastic
Remember, this is not a "Long Now" idea. These indicators are not timing tools. They simply tell us that this market could have a move of some significance to the upside, which we will participate in with a confirmed Daily trend change to the upside.
Good luck & good trading.
