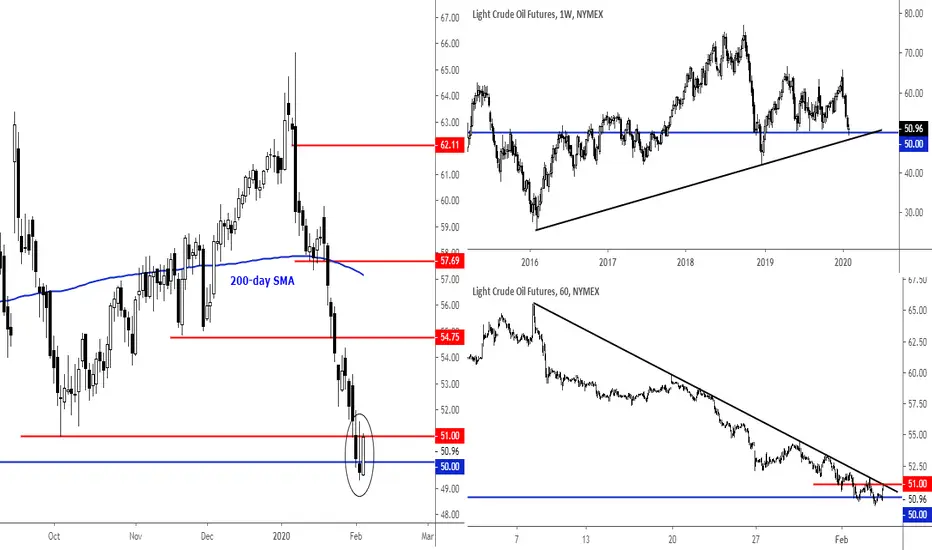
WTI crude holding key support for now, could squeeze shortsWTI crude oil has been testing the key psychologically-important $50 handle and long-term support for a few days now after a sharp drop on macro concerns (coronavirus hurting demand). Clearly prices are oversold in the short-term, but a more profound recovery will not come as surprise. Bulls need to see a daily close above short-term resistance at $51. This would also push oil prices above the bearish trend line seen on hourly and other intra-day charts, potentially triggered a short-squeeze rally.
Cl_f
𝗖𝗿𝘂𝗱𝗲 𝗨𝗽𝗱𝗮𝘁𝗲: $CL_F Daily. Recession WarningLoses 50.51-51.00 support area and recession closer than many think
USOIl at an Inflection againBit of a short term swing play here. USOIL is at a nice inflection area. 57.45 is the Line in sand.
1. We manage to get above it and hold we have a shot at 58.80s ( 57.90, 58.30 being intermediate destinations )
2. we fail to clear that , we look to trade the rotation back to 56.90s

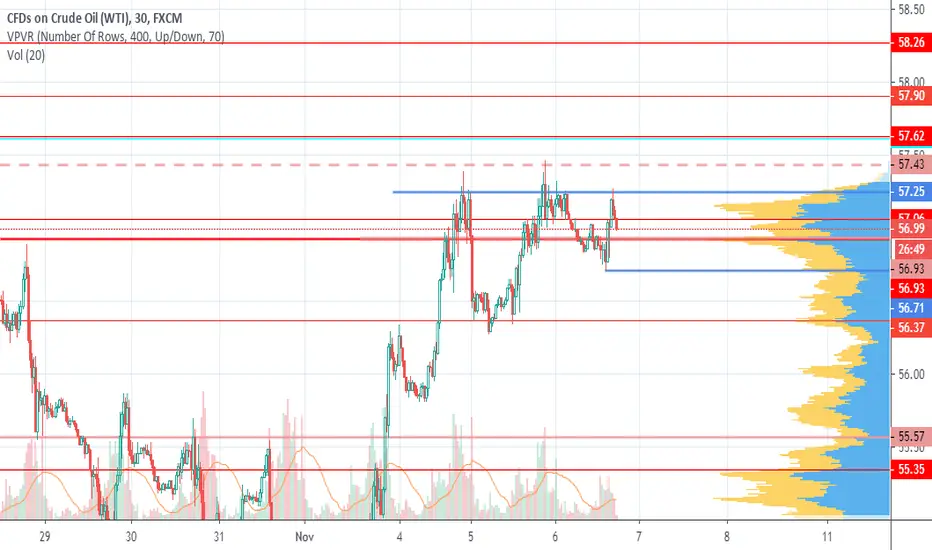
USOIL TradingviewCrude is balancing in the region of 2 days of balance. Bias remains bullish for now because of higher value area and the wick and hold of the 56.65 areas.hypos for today
1. need a hold above 57.20 areas for a test of 57.60, 57.90
2. bearish below the hold of 56.65 regions for a test of 56.35 , 56.20 and lower to 55.80
USOIL - Hitting getting into a short term confluenceUSOIL is getting into the short term confluence area, (marked in red zone) , hold into that can lead to a rotation on the downside to test back the areas of 54.15 and lower. Hold above that the trend changes to positive for a test back to 55.30 areas
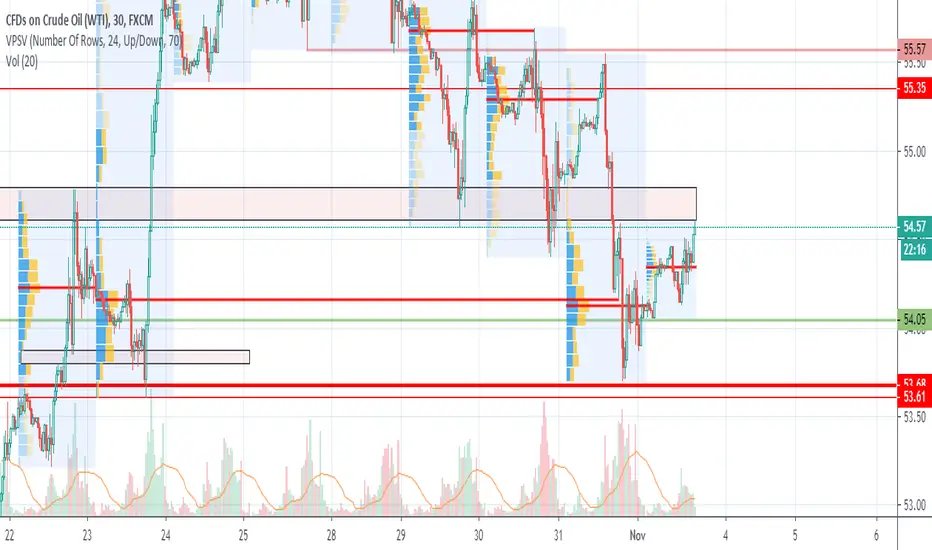
CL_F tested an interesting support zoneCL_F tested an interested support zone at 54.20 areas. this is a good reference and looking for this test to hold. we will look for a bullish view above the 54.90 areas. Below are the scenarios:
1. hold above 54.90 areas, look to test 55.20 and 55.90 areas.
2. fail to hold 54.40 and break below 54.20 areas for a larger inflection towards 53.20 and 52.90 areas

CL_F testing a good support baseCrude is testing a good long term support reference at 55.80 areas, if we break through we are in for a swift test of 55.2 and 54.90.
thesis invalidated on hold above 56.20 areas
USOIl Crude at an interesting Confluencein USOIl 56.75-56.60 remains as the trend decider for today, we have marked an interesting low at 56.33 ( previous top references).
theme remains bearish below the trend decider. Break below 56.33 can see an accelerated fall to test 55.80 areas.
Hold above trend decider we have a chance to test 57.30 areas

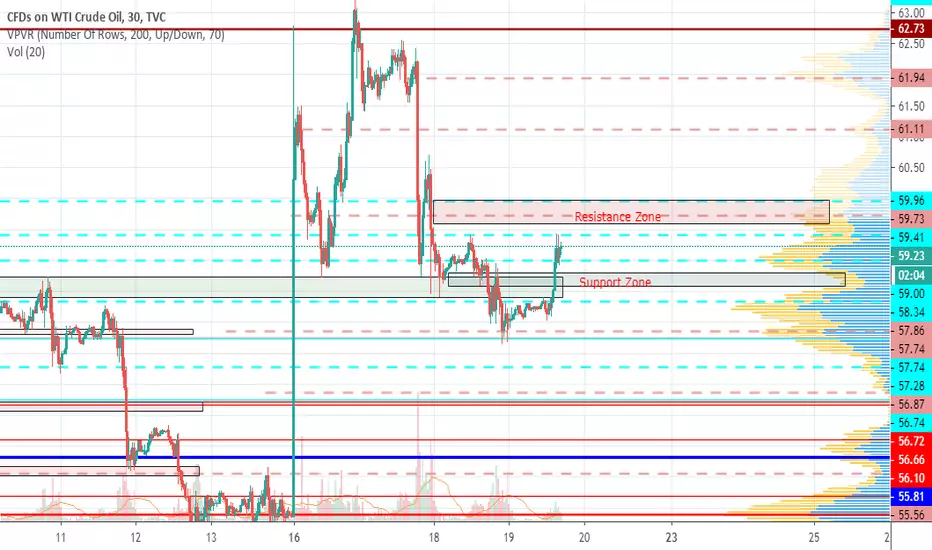
CL_F breaking outside the micro compositeCL_F poked the areas of 58.70-90 for long , now for a hold above should go on to test 59.4 59.70 areas. failure to hold that alternate scenarios for a test failure and a test of a larger swing down to test 57 areas.
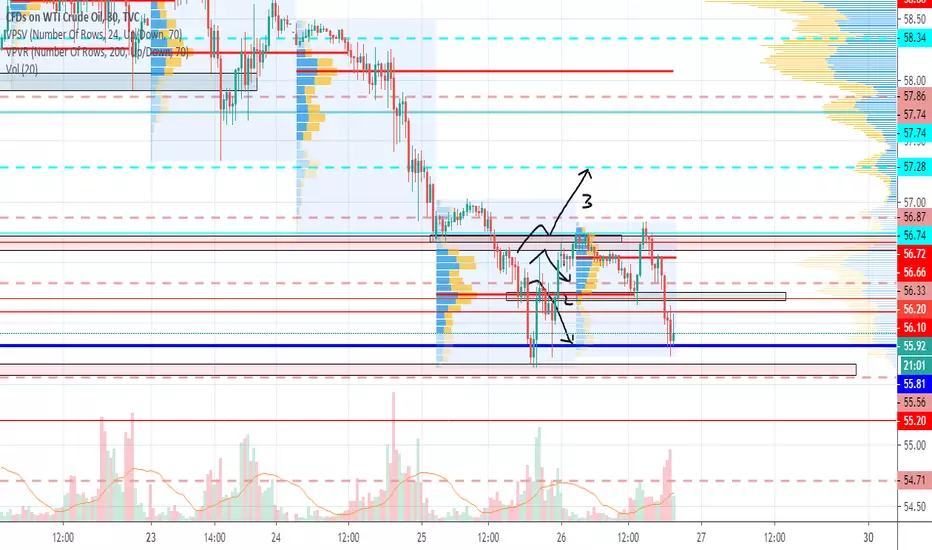
CL_F Trade plan- Range bound Play?CL_F has seen a lot of volatility, does it cool off now? well we dont know. But here is the plan.
Looking for a range bound rotation and pullback trades within the support and the resistance zones.
Break outside the areas for potential target zones.marked in red and blue ( red - Short term references and Blue Long term references)
Crude to Fill the GapSimple gap-fill play on CL_F/US oil - sell it down to 54.7s and then take a long.
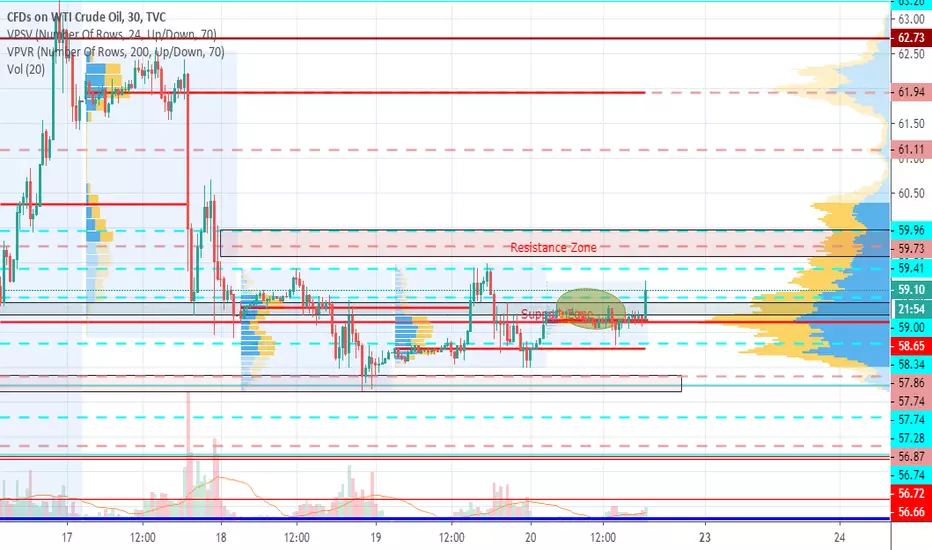
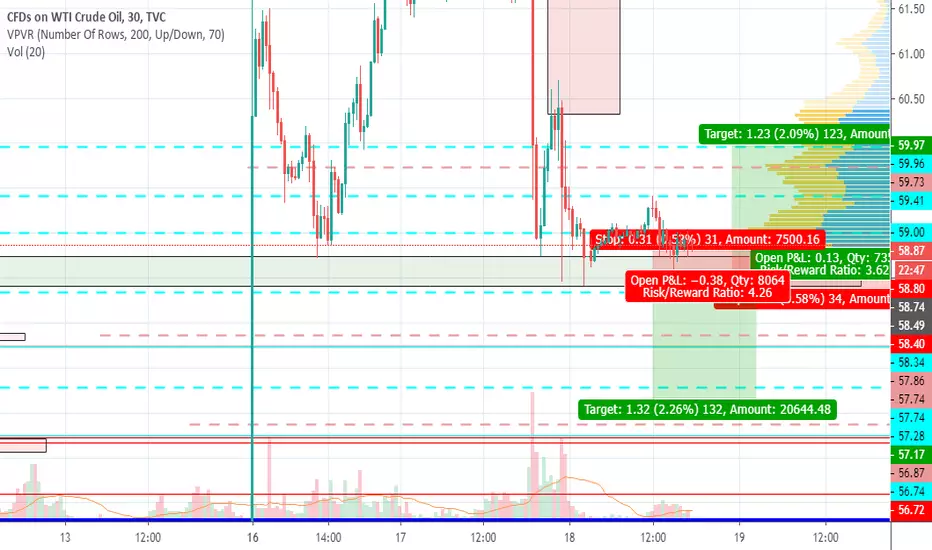
CL_F Trade ideas for TodayExpecting a hold of the 58.7-58.50 areas. for a test back to the target areas marked in dashed lines as a primary scenario.
secondary scenario - Break below that expect to test the downside target areas.
blue dashed lines- ( Long term references)
Red Dashed lines ( Short term references)
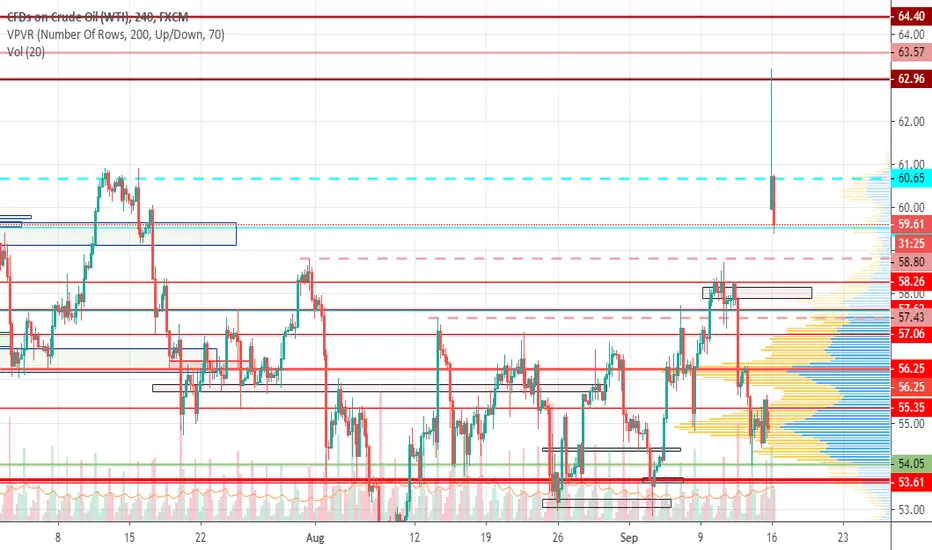
#CL_F #crude areas to watch outwe have these two references from larger timeframes in crude today.
1. 58.80- get there and hold below we move lower for test of 57.50, 56.25
2. 60.65 - hold above that we go on to test 63, 64.50 areas.
too many players eager to fade the gap up.. so we go to be careful :)
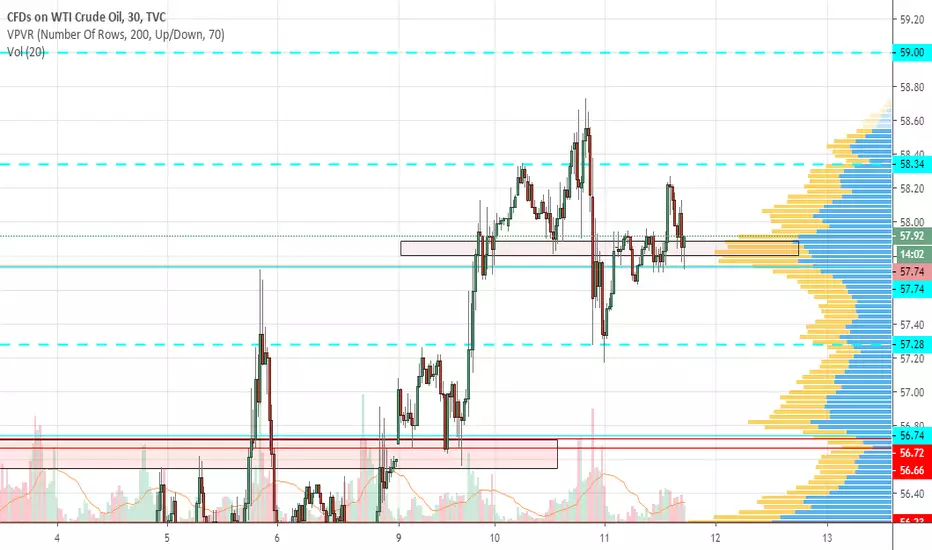
USOIL CL_F testing immediate reference areasCL_F immediate reference is the the zones of 57.80-90 areas.
1. #crude key focus area is the zone of 57.80-90. will look for a test and hold here for a potential test back to 58.30 areas
2. weak for a hold below for a test back to 57.30 areas


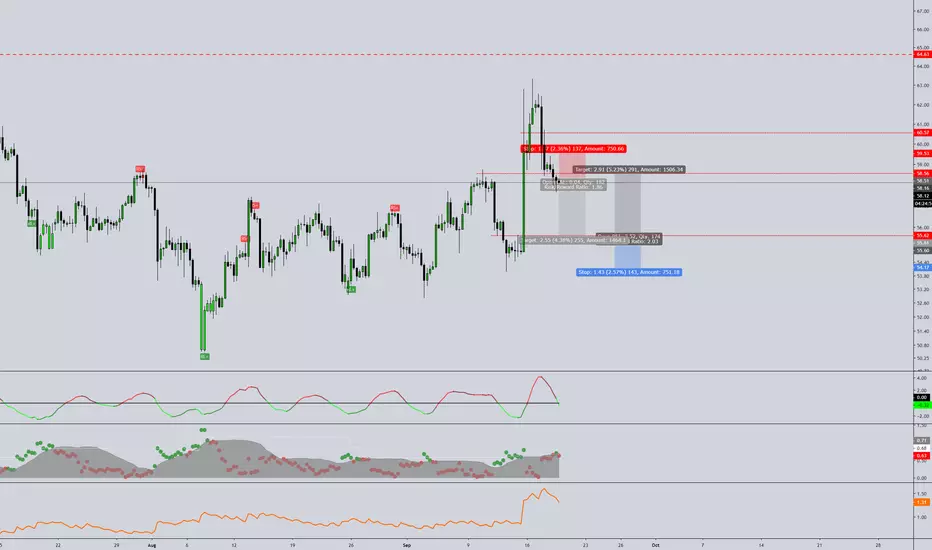
Oil back to 61.8%?Buy here for 57.84. Similar to the big drop in Q4/18, ignoring the Xmas week as a sentiment outlier.

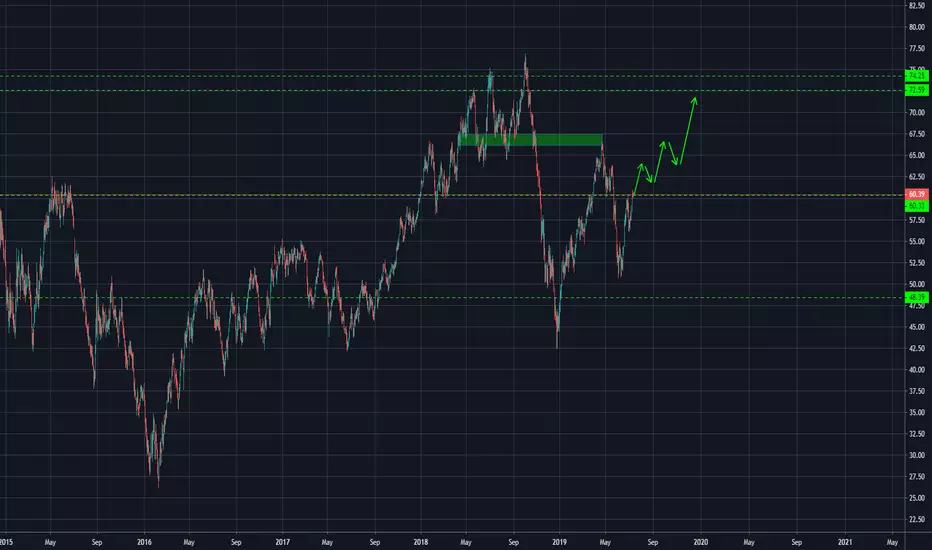
Crude Oil (CL) Long ForecastCRUDE OIL (CL) LONG FORECAST
CL must hold the $60.00 level in order to eventually see $74 again.
Losing 60 would be bad news for bears.
Given geopolitical environment I am bullish.
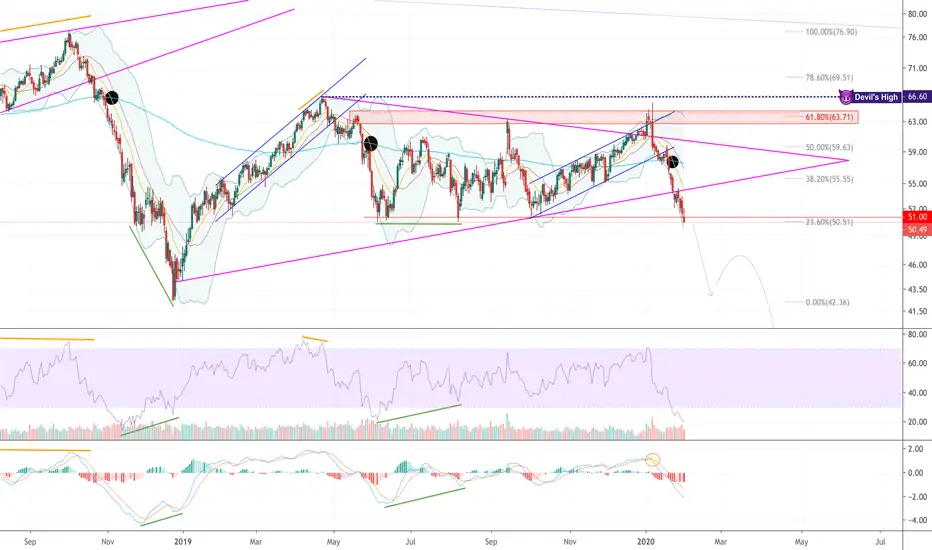
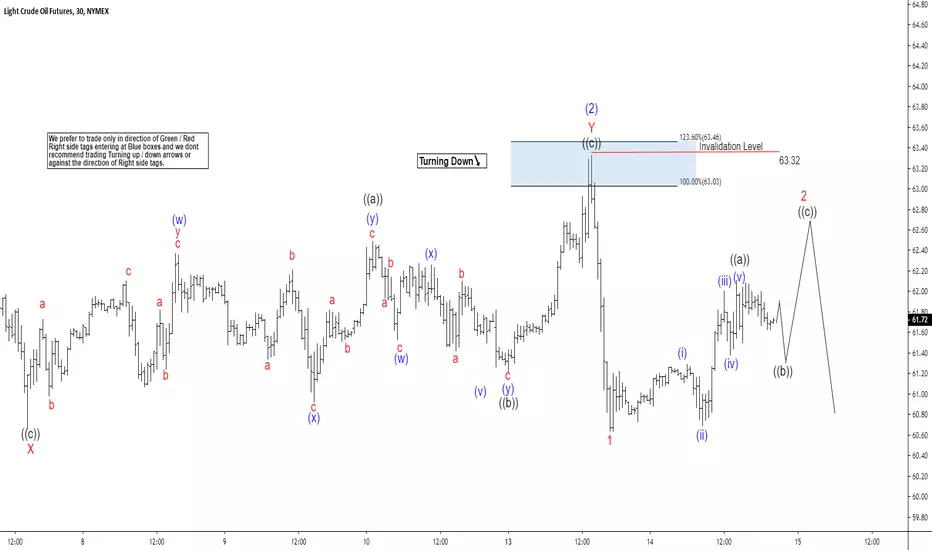
Elliott Wave View Calling for More Downside in OilElliott Wave view on Oil (CL_F) suggests a 5 waves decline from April 22 peak ($66.6) which ended wave (1) at $60.04. In the chart below, we can see wave (2) bounce ended at $63.32 at the blue box. The internal of wave (2) unfolded as a double three Elliott Wave structure. Up from $60.04, wave W ended at $62.95, wave X ended at $60.66, and wave Y ended at $63.32.
Oil has since turned lower in wave (3). However, it needs to break below wave (1) at $63.32 to confirm the next leg lower and avoid a double correction. The initial decline from $63.32 appears impulsive and ended wave 1 at $60.64. Wave 2 bounce is in progress to correct the cycle from $63.32 peak before the decline resumes. Potential target for wave 2 is 50% – 61.8% Fibonacci retracement of wave 1 at $62 – $62.3. We don’t like buying Oil and expect sellers to appear in 3, 7, or 11 swing as far as pivot at $63.32 stays intact. A break below wave (1) at $63.32 will confirm the next leg lower in CL_F. A 100% extension target from April 22 peak can see Oil reaching $55.3 – $56.8 at least.
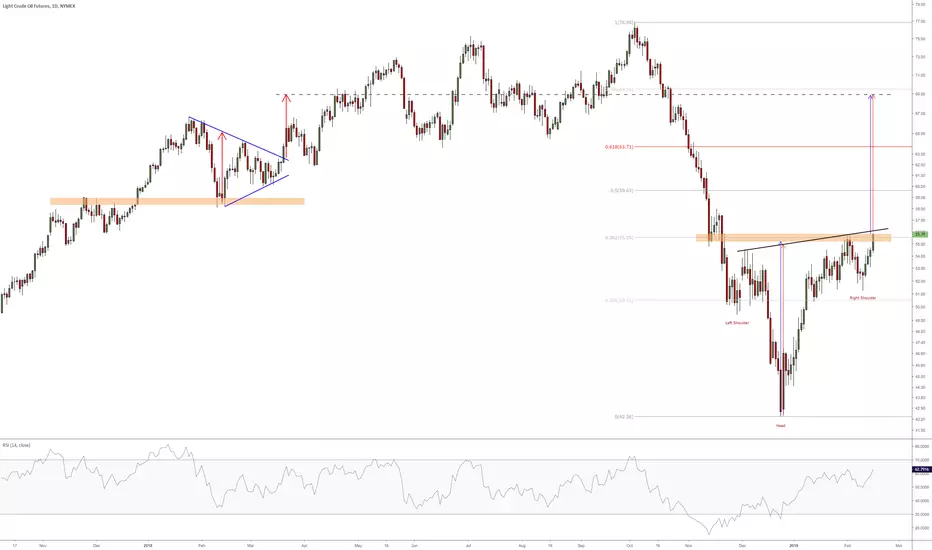
The uptrend resumes......after a few days of consolidation around the 61.8 retracement level of the October to December 2018 decline.
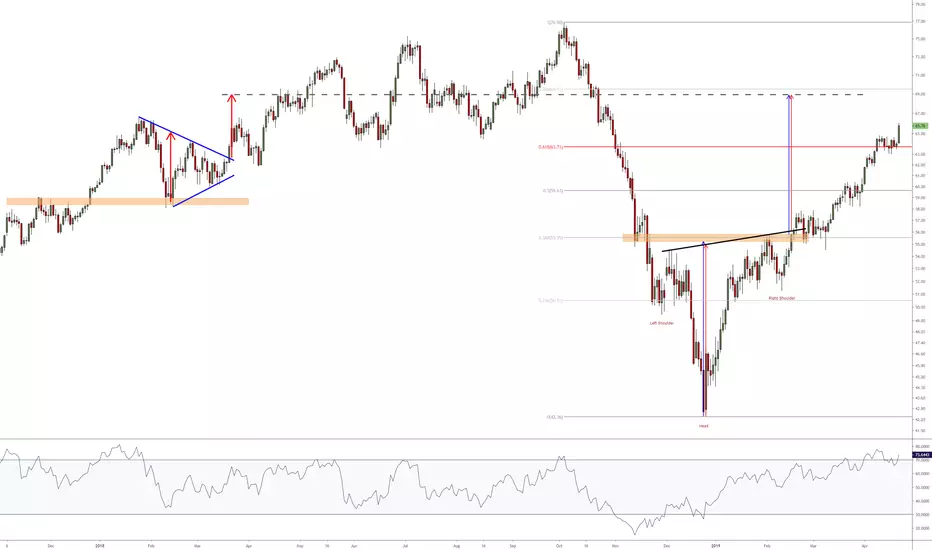

Inversed H&S about to break its neckline? a measured move targets $69
Will this work? No one knows, but the risk/reward is compelling enough once the breakout occurs.
$USOIL/$CL/$WTI Macro Range BoundLooking for a revisit to the bottom of the Macro Range (approx. the $45 handle) based off the confluence of Macro S/R, Multiple Fib lvls, and Volume Composite.
Invalidation above the mid $56 if price breaks into the HVN .
