Cl_f
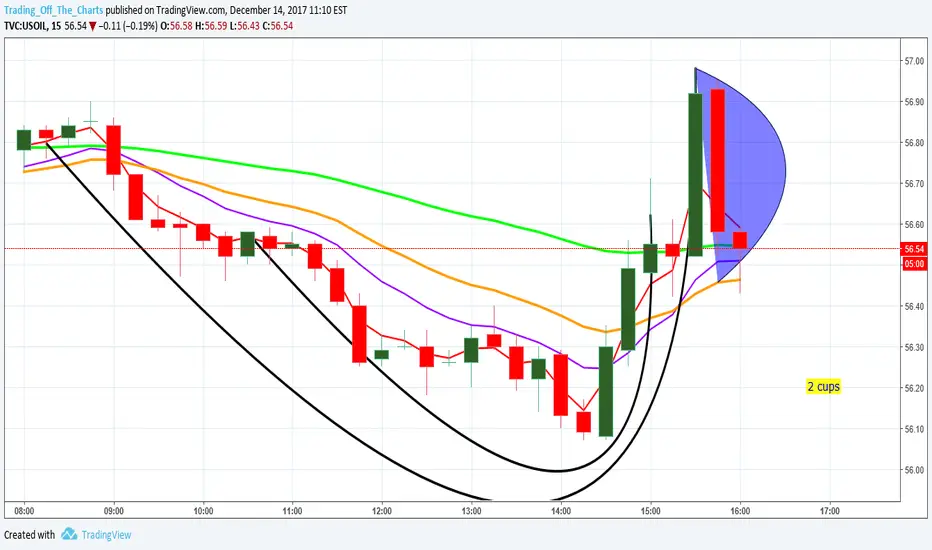
will see after lunch if c/h breaks out or spills over $uwt $cl_flong from $56.26 scalp, stop loss $55.82 target $58
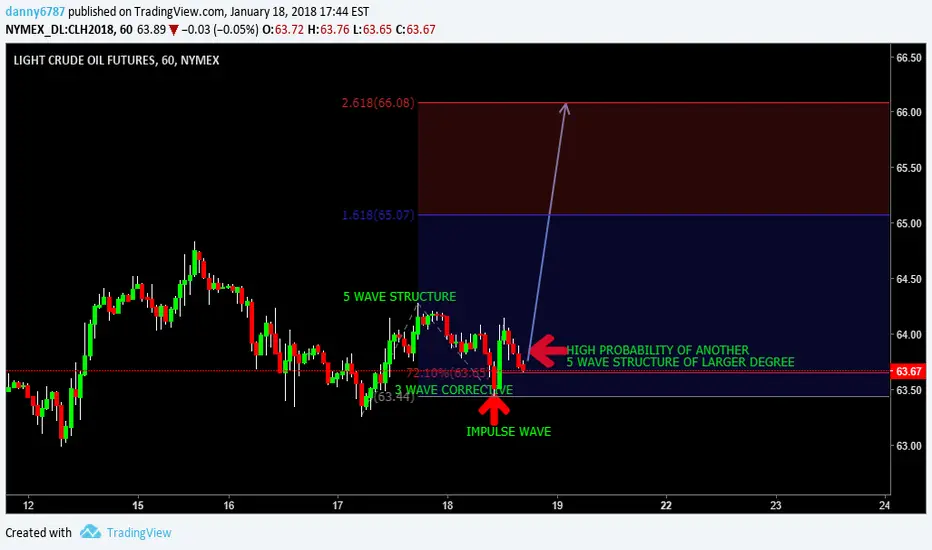
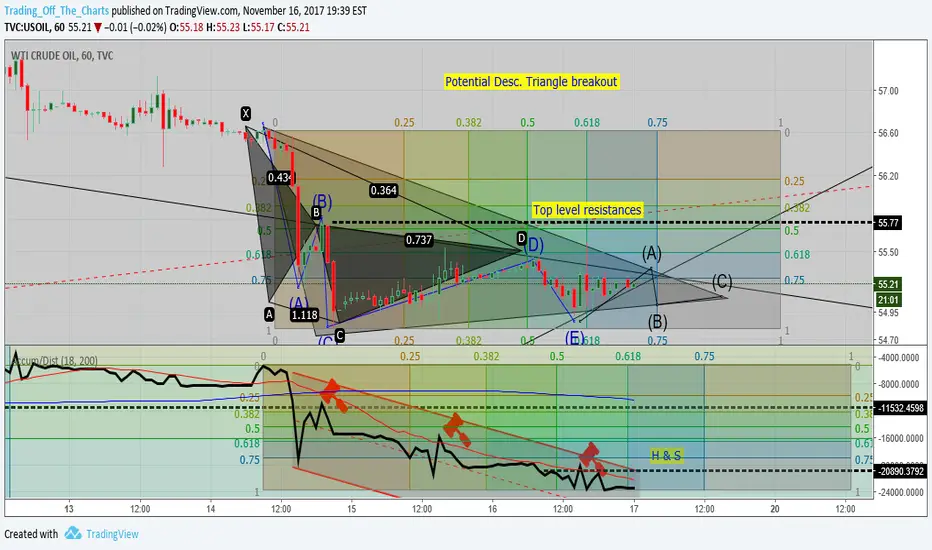
could set up potential desc. triangle breakout $uwt $dwt I'm a buyer above top level resistances. C is optional for gamblers
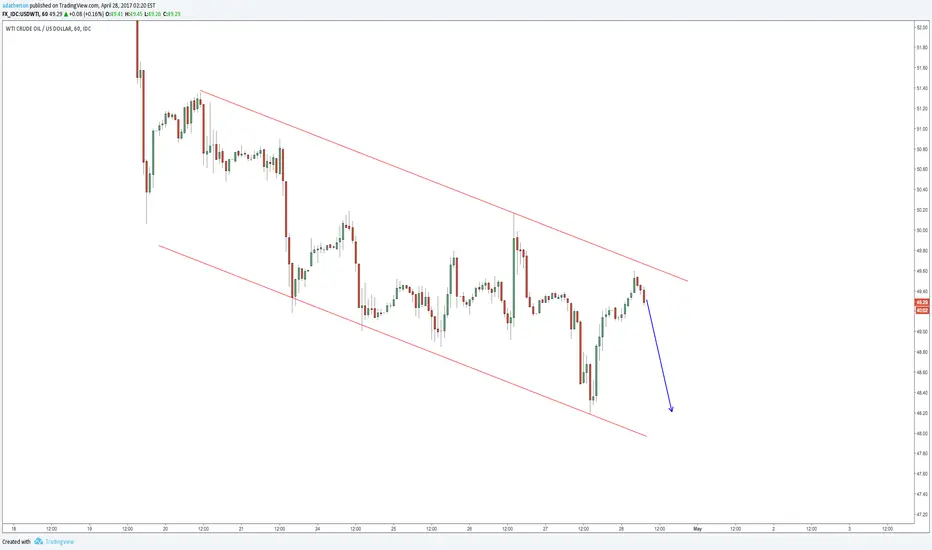
This level critical for oilIf 47.50 doesn't hold, the price could re-test 42.50, otherwise move higher..

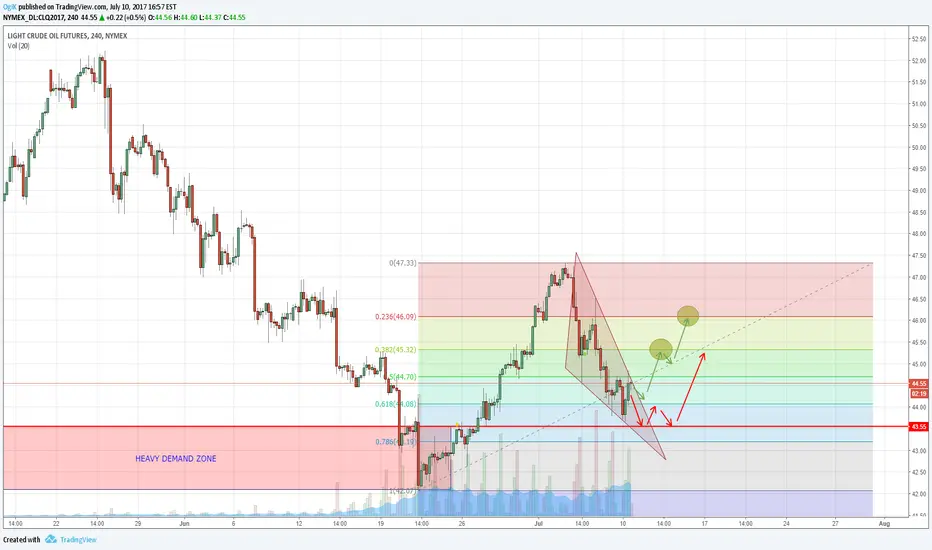
CL 4h Chart breakdownWe can observe CL is still in that bearish channel but the price has now created what I believe a highly bullish wedge. Price targets marked as per fib retracements. If we do get a break to the downside, please watch 43.50's area as a buy opportunity.

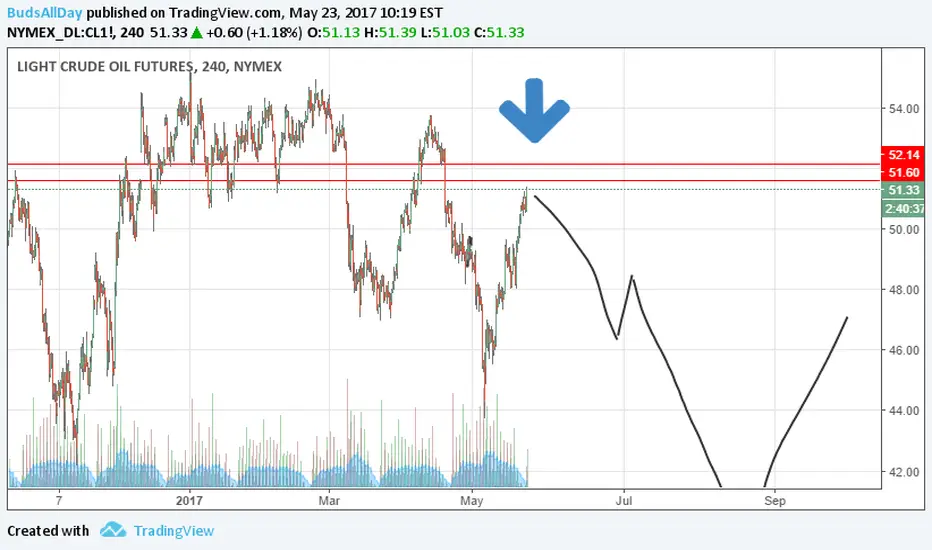
Oil Sells Off Tomorrow. Upside very limited.
/CL to test what May low gained first.
If ur long ur wrong.
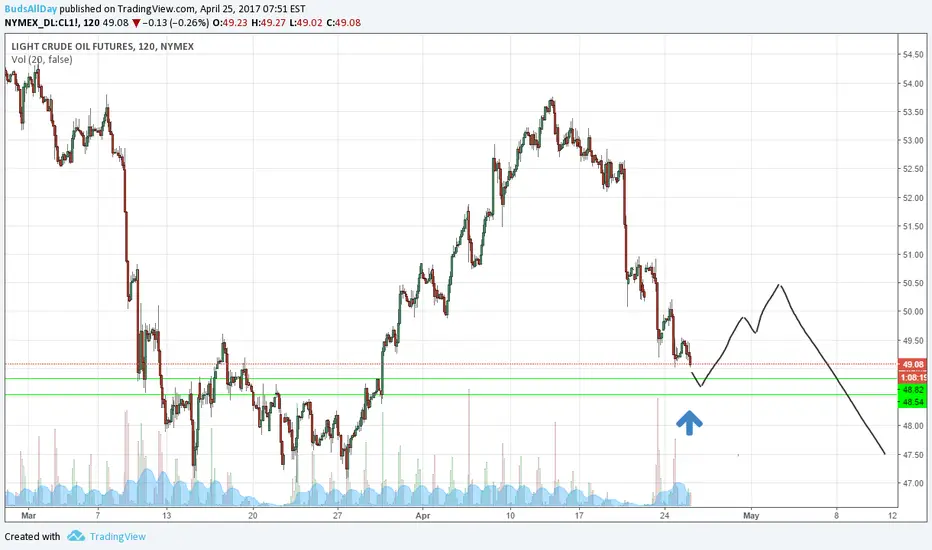
Buy Oil H&S patterns that look so elegant usually break to upside in bull markets. Technically and fundamentally Oil is in a bull market. Look for price increases off of this $48/barrel level with price targets nearer $60/barrel into June & July 2017.

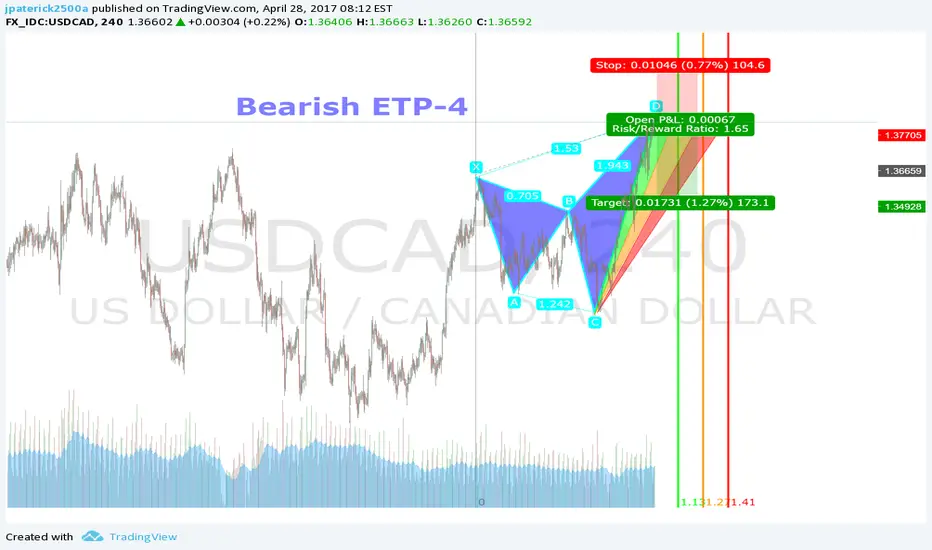
Bearish ETP-4 PatternLooking for the $USDCAD to drop here with this ETP-4 pattern. If pattern fails will wait until 1.46.
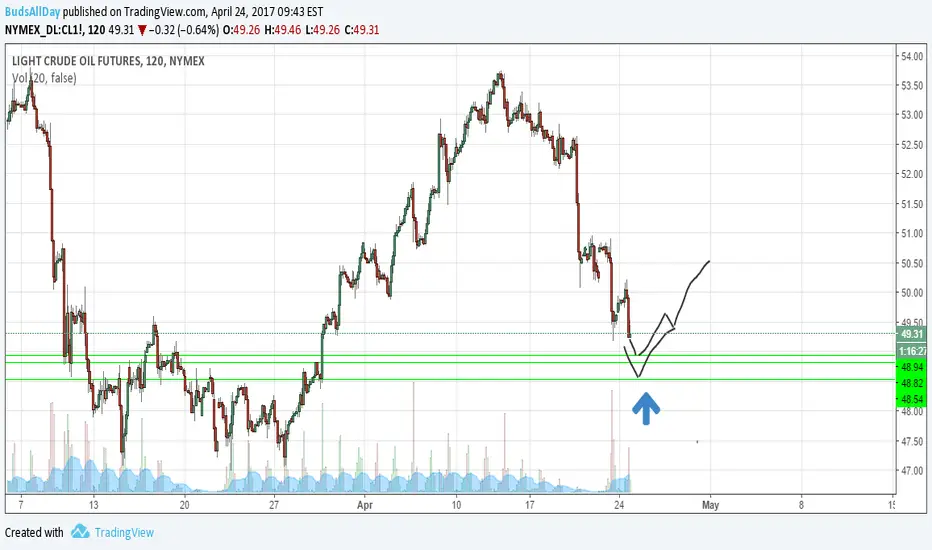
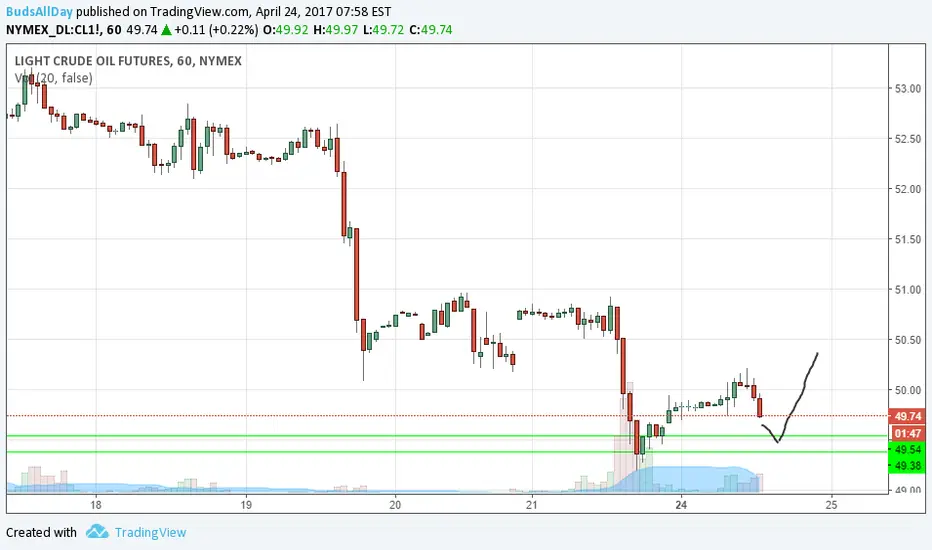
Oil hitting leg start. LONG 48.9x's. Buying crude again. 48.9x's. will add around 48.6 with a stop just below 48.4.
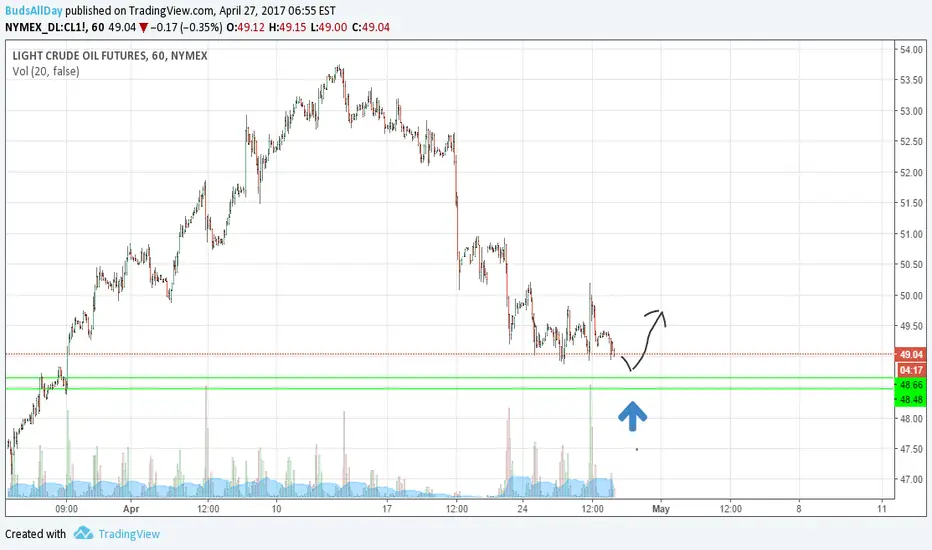
BIG SUPPORT LEVEL 48.8X/49.04. First touch of what was gained in March 2017.
Will get a BIG pop before below 48.50.
BIG LONG RIGHT HERE 49.04. (needs to gain 49.11 and it will POP HARD)
Adding at 48.8x. Risking more than usual but it will work. 49.8x the first long target.
Long Oil $49.50's. LOW NEEDS TO HOLD. Just bought /CL 49.52.
Stop below Fridays low. New highs the target.
Will add to the long at .38/.41.
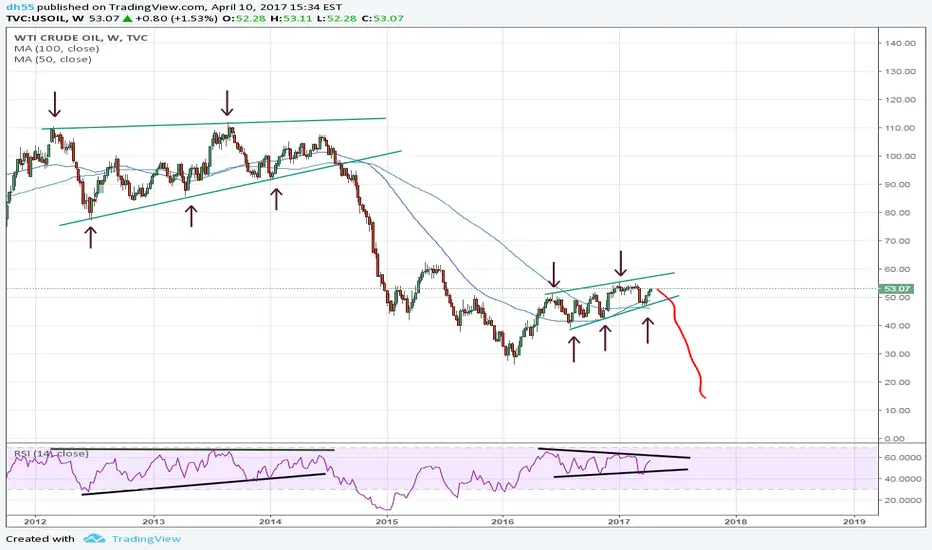
The similarities cannot be ignoredIn 2013-2014 market touched rising support 3 times and rising resistance 2 times before 6 month down move. In 2016-2017 market touched rising support 3 times and rising resistance 2 times. If it is going to repeat the 6 month down move it is going to do so now.
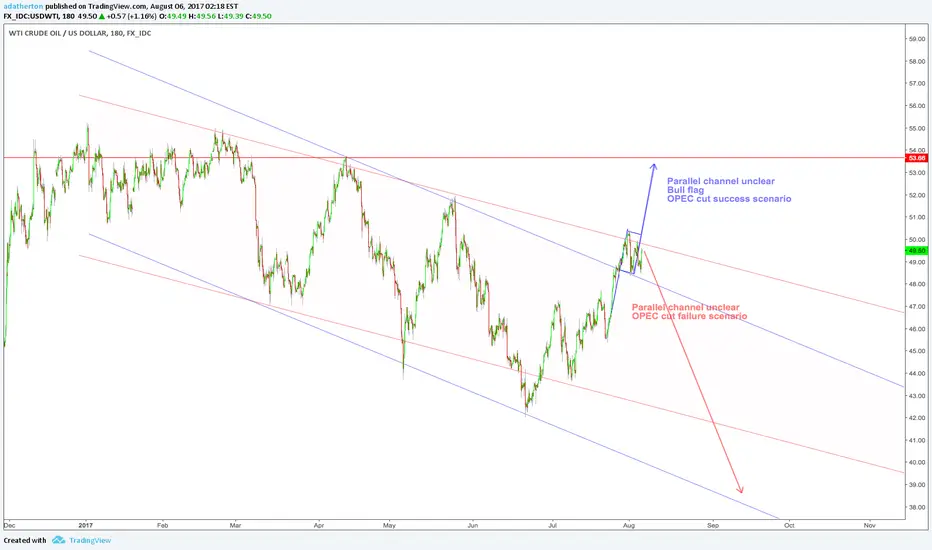
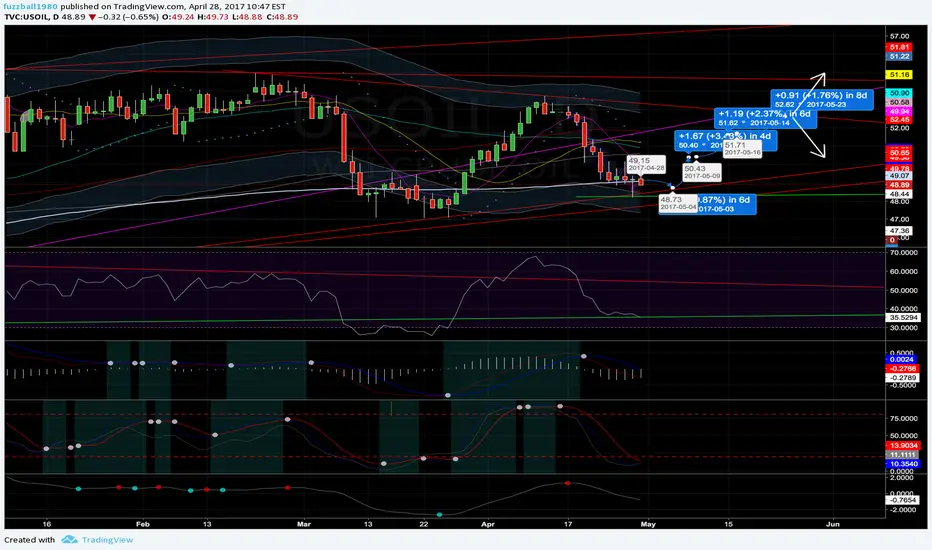
$CL_F ($USDWTI) Multiple technical indicators say buy oil here after OPEC reaffirm cuts. 4.4:1 trade shown.

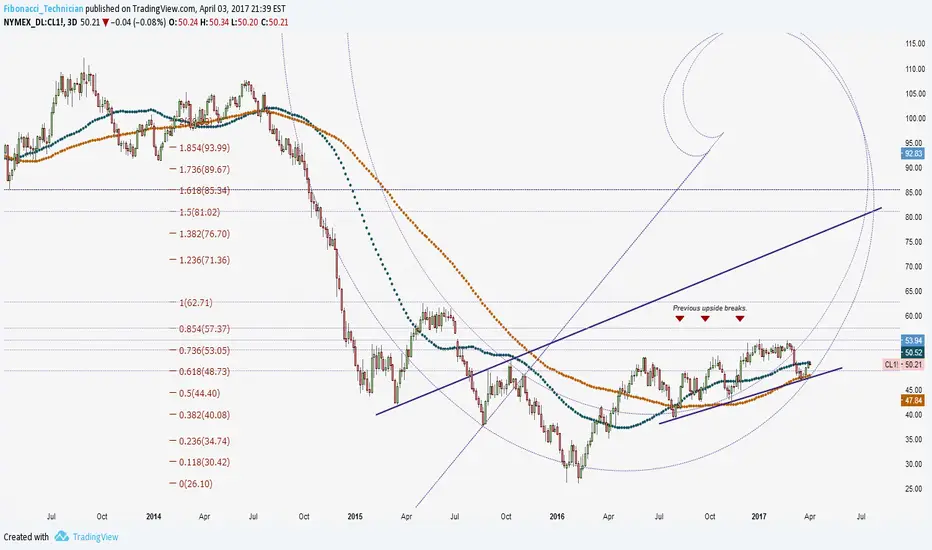
Crude Oil Preparing For BreakoutPlease refer to image.
Crude oil will breakout, just a matter of on the first try or not.
(D) Testing support near 47.50 and magnetized to S3Pivot. If bearish momo continues and 47.5 breaks, testing 45 for support is not far off. May even chop near 46 beforehand.
Patience if looking for a better price. Obey your rules.

(D) Support holding near 48 & S3 Pivot.If bullish momo comes in, S2 Pivot may be tested for resistance. Additionally, EMA200 may provide resistance as well.


