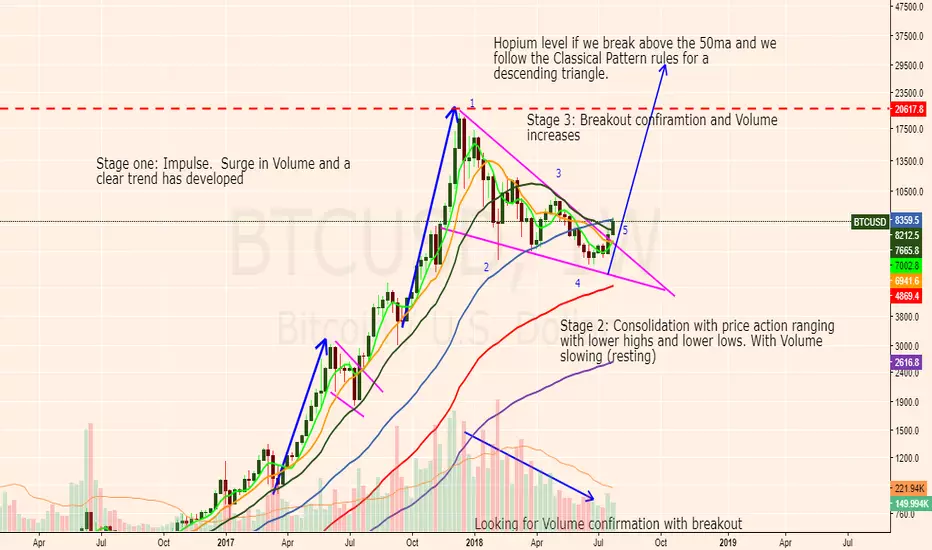
BTC Descending Triangle breakout to mid 20k, here is whyG'Day Cobbers
Just a quick post to give some hopium, check the chart it says it all. remember this is on a huge timescale and is not t be trader against unless you are looking to buy and hold. This is just a forecast on where it could go based on classical charting rules. It will not go in a straight line but it should develop on the time frame much like the last flag pole.
Good luck and Enjoy.
G'day
Thanks for dropping by, hopefully you garner something valuable from my post, be it educational or an idea towards a trade of your own. Please share, like and comment and engage with me, I am here to help.
Trader, Chart analyst and all round larrikin. Reside in NQ Australia, surrounded by Crocodiles, snakes & giant spiders, not to mention the boxing Kangaroos and devilish Drop bears. It makes my job quite hazardous but strewth mate, I love it.
Classical_patterns
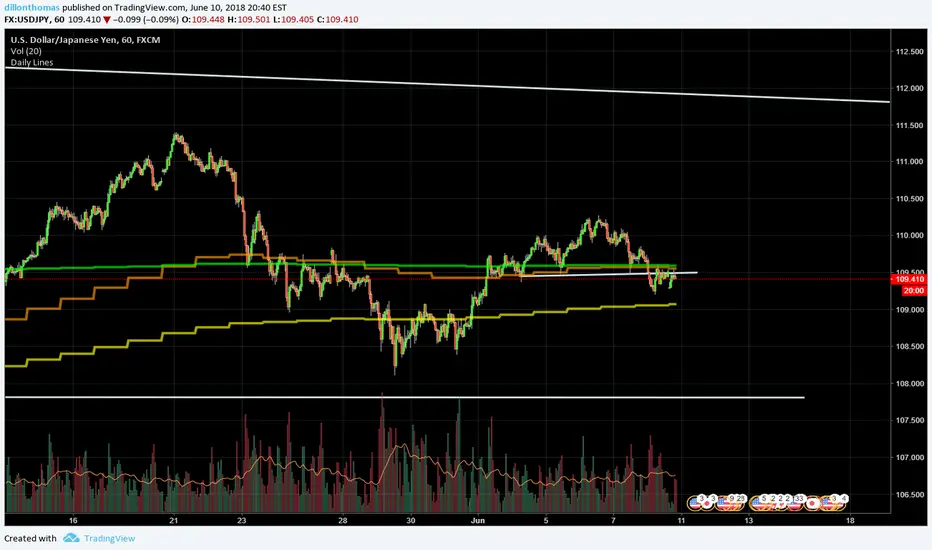
USDJPY - 1HR - SHORTI'm still biased long big picture USDJPY , but head and shoulders retest might be in order.
I'm bullish on dollar, so this is a counter move. I am not in this trade, it is an idea.
#ZIL classical charting and trade plan#ZIL has respected classical charting patterns very nicely. Right now we see ZIL falling below an ascending line and is looking to find support. We have 3 minor supports drawn and 1 major. I doubt we fall below the second support but if we do I am prepared. Wait for a breakout of this downtrend line.

#TRON TA based on only classical chartingClassical charting only on #TRXBTC . Sometimes its important to not get caught up on fancy indicators. Simple wedges, supports, and resistances can draw the picture perfectly. STUDY THIS

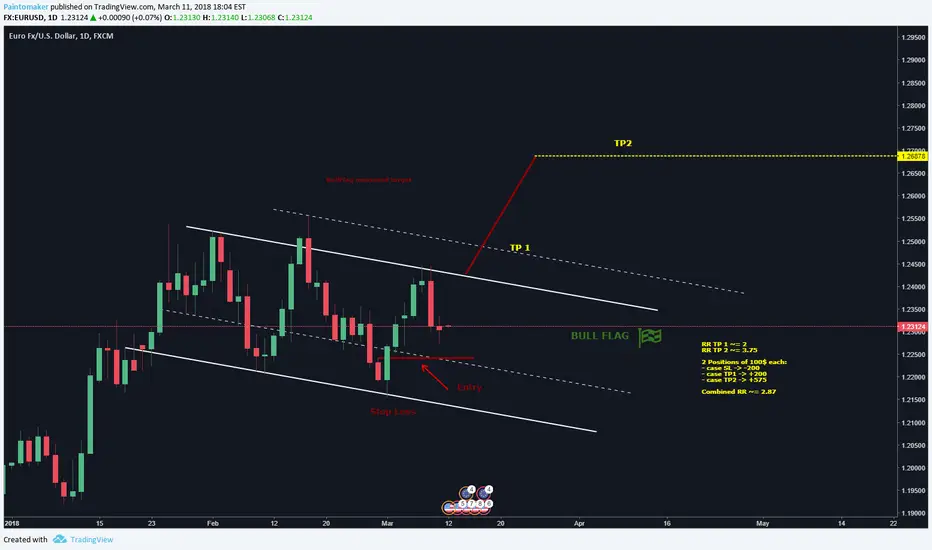
EURUSD Forming bullish flag on Daily- good RR opportunity Hello traders,
We have this week CPI ready to shake markets and hopefully taking EURUSD out of this period of acumulation/distribution we are in.
Price action is forming a bullish flag and wichever the side the breakout happens it will be a big move given the time we have been loading in this zone.
I can't tell you that this is the right side, but I tell you that this has a good RR opportunity and it's on the side of the current trend and least resistance.
If you decide to go long, I reccomend 3 positions, 2 for the targets I mention, and the other one for riding the trend, after such a long period of accumulation, the move it's going to be big.
Load your bags, and prepare to ride the pig!
Like and subscribe!
Market to Breakout Up or Down?According to Edwards & Magee (1948), 75% of symmetrical-triangle breakouts continue the prior trend, which in this case is bullish! (1) And according to Kirkpatrick & Dahlquist (2010), 54% of symmetrical triangles in general breakout upwards. (2) So the odds seem favorable for bullish movement. However, it needs to start about right away, yet after this lousy week I have a nagging sense that it might breakout downhill.
(1) stockcharts.com
(2) finvids.com
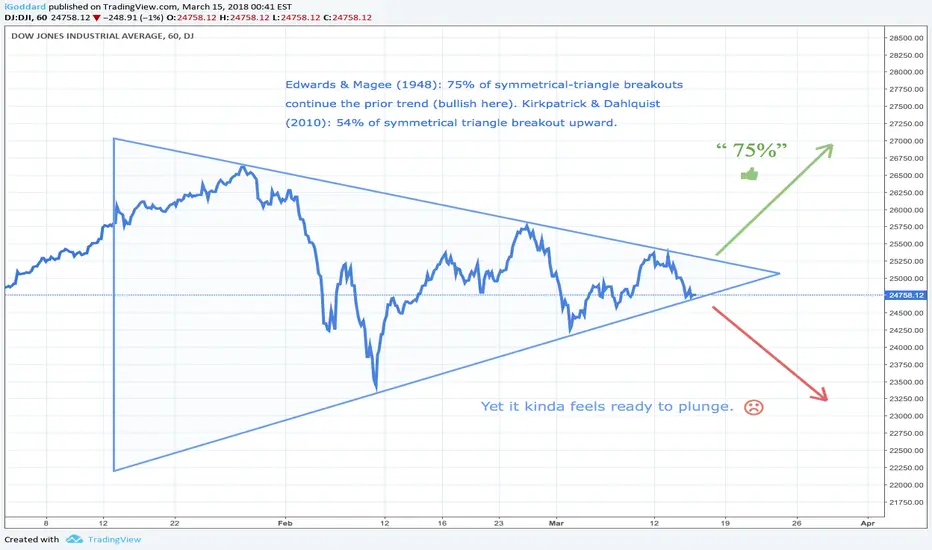
DOW forming symmetrical triangle The Dow is forming a symmetrical triangle. At least for single stocks, "symmetrical triangles breakout to the upside 54% of the time."
Source of quote: finvids.com

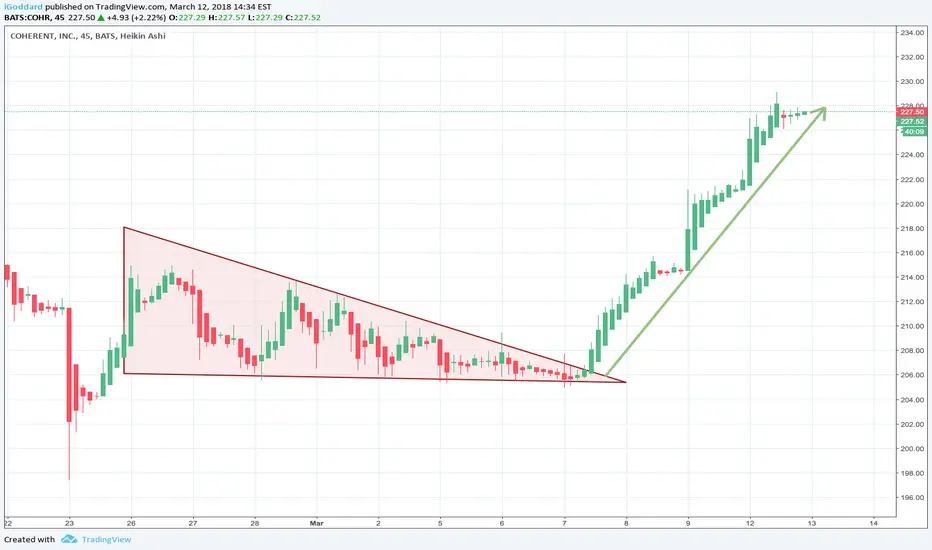
Descending-triangle breakout exampleGood example of a descending triangle tightening up then breaking out on COHR.
ETC is soon finished with bearish cycle. New cycle ahead! BULL!ETC is soon finished with the bearish period and is setting off soon for a long period in a bull market! I would like ETC to see in the grean zone buy area one more time. I dont know in short term what ETC is gonna do, but in the larger picture I see the classical chart proven to be happening over and over. ETC is starting to be bull for a long time. FInally the holders might see some hope.


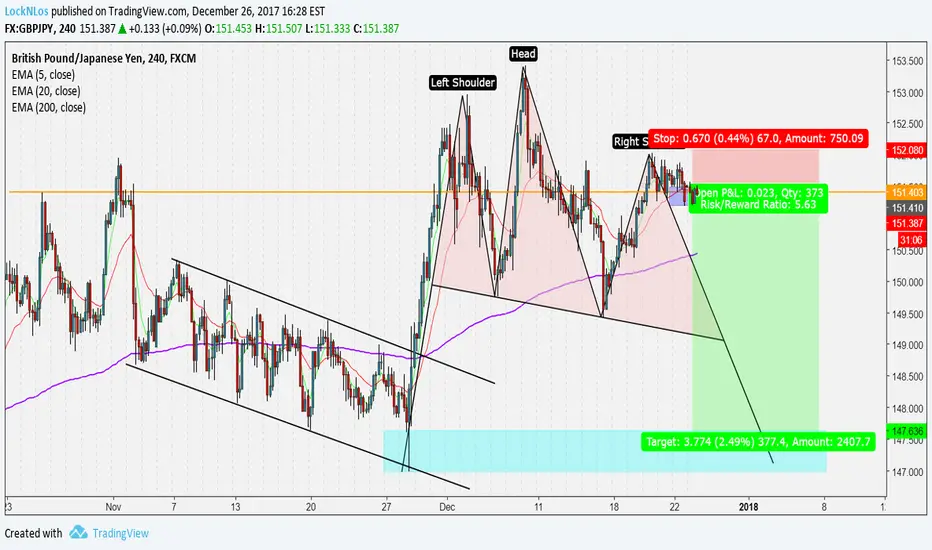
GJ ShortMight be jumping the gun here but the potential of a Head&Shoulders pattern presents a decent opportunity to go short with an excellent R:R
If the market can't sustain 151.40 we can expect price to retest the swing low at the completion of the pattern;
approximately the 147.50 level.
A roughly 350 pip target. SL @ 152.08 is appropriate.
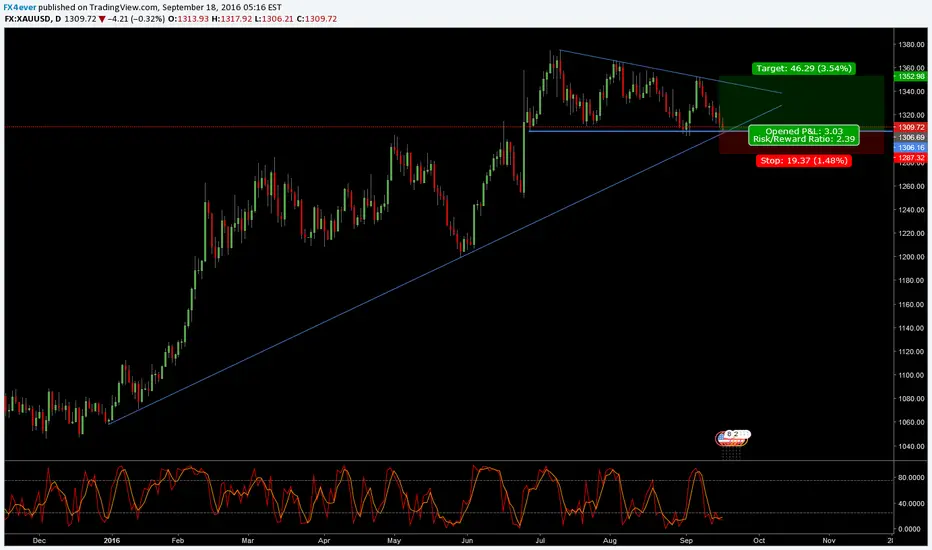
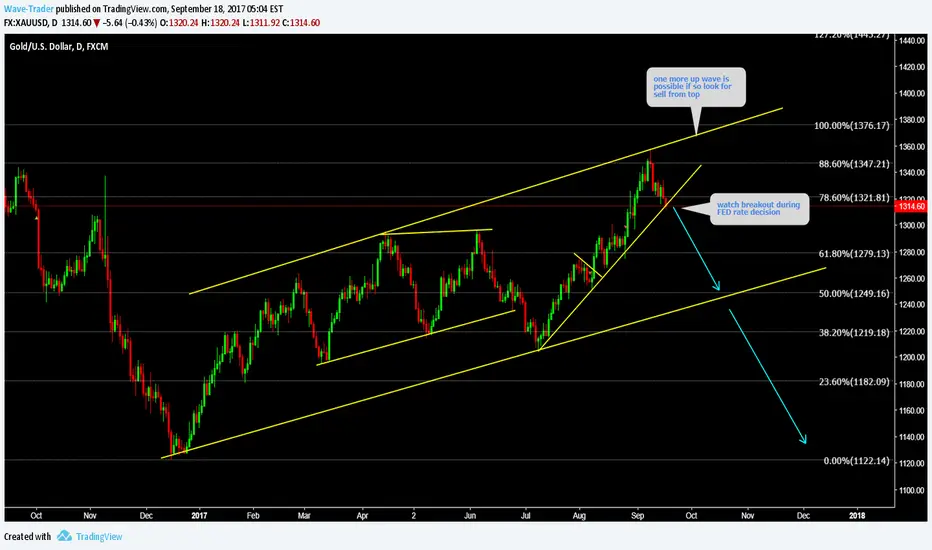
XAUUSD Watch breakdown of up trend during FED rate decision Hi fellows, I am looking for the XAUUSD to drop back in the structure. One more up wave is possible. In case we see an other up wave then look for sell from top. Good Luck fellows.
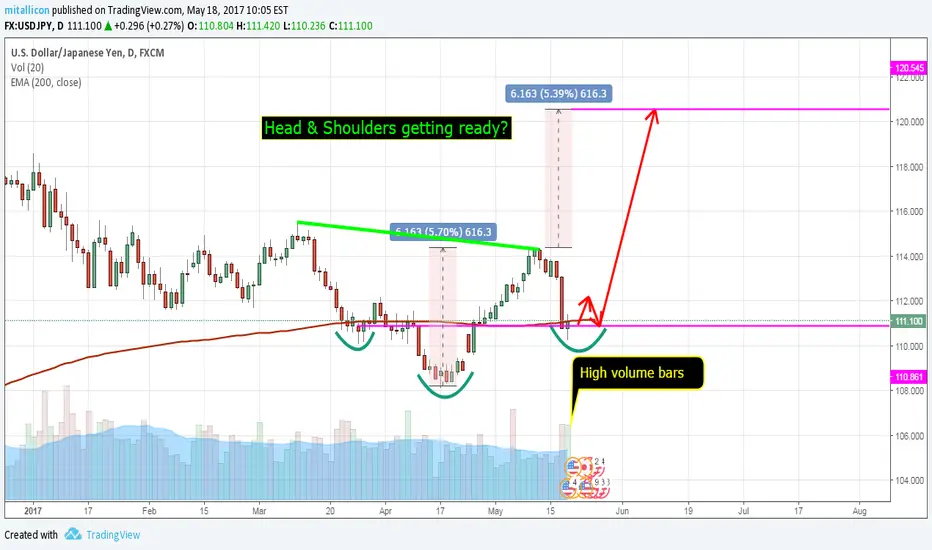
USDJPY D1 possible head and shoulderslet's monitor the usdjpy for the possible H&S illustrated on chart, high volume bars indicating incoming reversal?
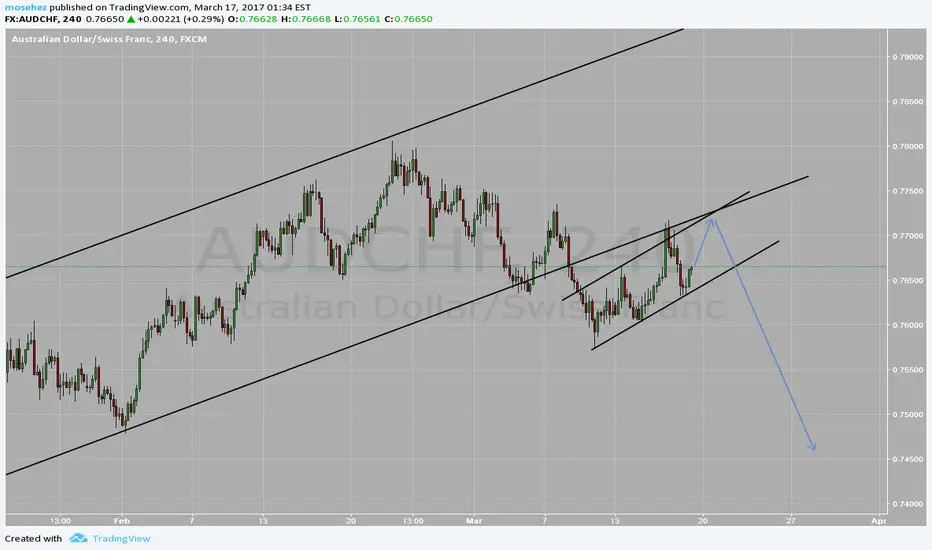
AUDCHF LIKELY TO COMPLETE THE UP WAVE SOONWait for price action to show that it is headed to the downside......Trade with care and good luck
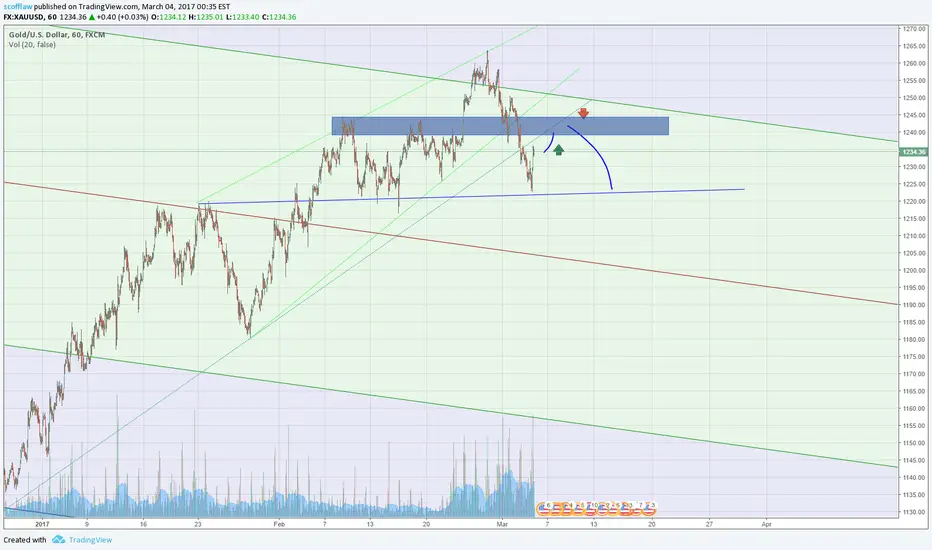
Gold Head & Shoulders forming?With gold having recently reached its down side target this week, look for price to potentially form a right shoulder mid week (thought it may go sideways for some time after). 1240-1245 supply zone should see price rejection for initial validation.
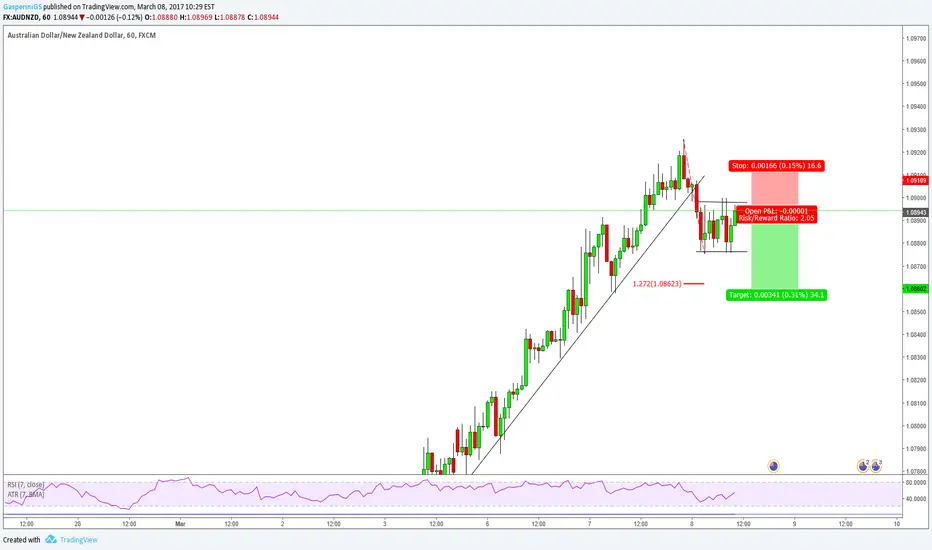
Little trade on AUDNZDHey traders!!
We have had a HUGE move up, so I expect a relief. The market made a strong move down and it is now putting a consolidation pattern. I expect a break to the downside at the 1.272 extension which lines up with structure looking left.
Good luck in the market traders!!
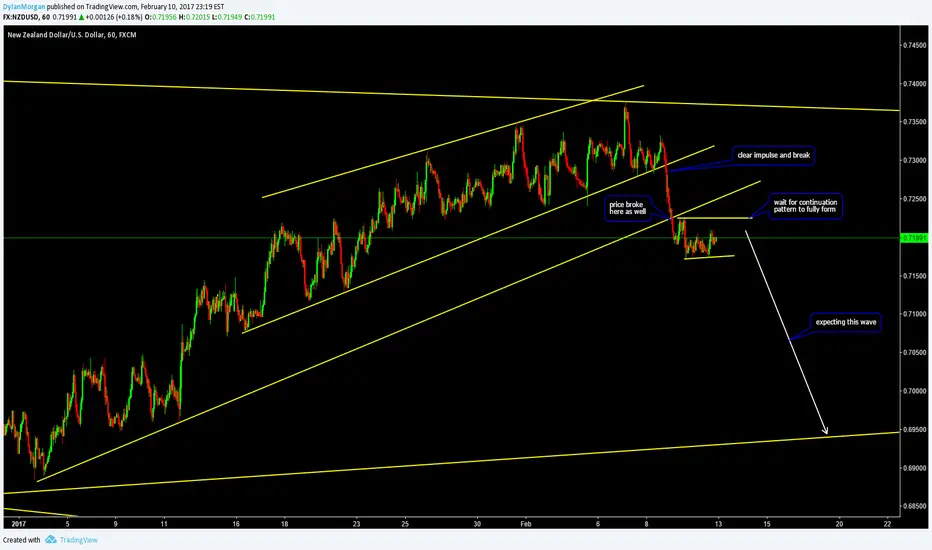
Continuation for Downside on NZDUSDNZDUSD has created an impulse to the downside and has broken two areas. Expect a corrective pattern to further form. Enter short on the next impulse. Good luck to all.
Nice Short Setup on GoldGold is currently channeling to the upside so when we see price touch the top of the channel look to take short positions.