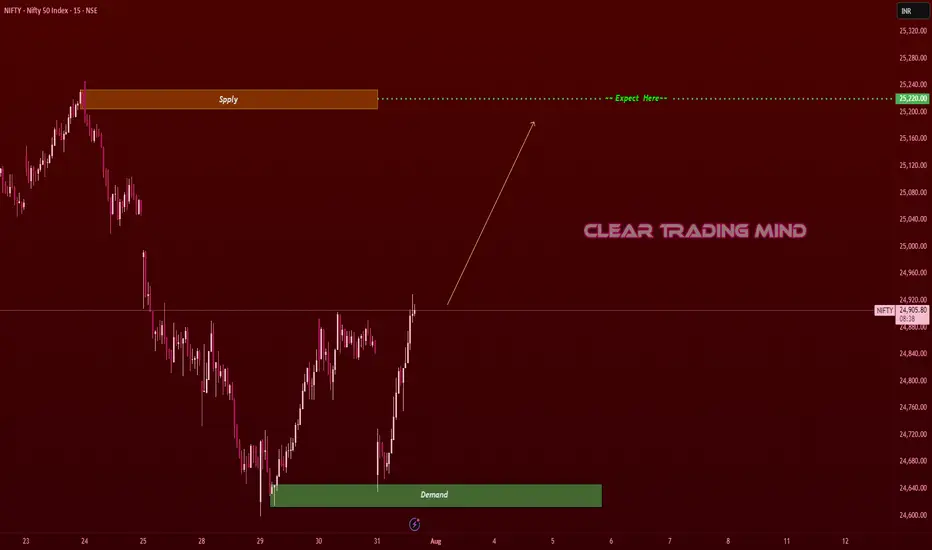
From Demand to Glory: Nifty’s Bullish March to 25,220 Nifty Bullish Outlook
-Current Price: 24,905 (approx)
- Key Demand Zone: 24,620 – 24,660
- Key Supply Zone: 25,200 – 25,240
Technical View
- Strong Demand Bounce: Nifty reversed sharply from the demand zone (24,620–24,660),
indicating strong buying interest.
- Trend Breakout Potential: Price is approaching resistance near 24,920; a breakout could push
towards the supply zone at 25,220 (target).
- Momentum Structure: Higher lows formed after the demand zone test, showing bullish
strength.
News & Data Supporting Bullish Bias
- India’s Q1 GDP Growth: The latest estimates show strong economic growth, supporting equity
market sentiment.
- FIIs Turning Buyers: Foreign Institutional Investors (FIIs) have been net buyers over the past
few sessions, supporting index upside.
- Global Market Tone: US and Asian equities are stable, and crude oil prices are moderating,
supporting risk appetite.
- RBI Policy Outlook: Market expects no immediate rate hikes, keeping liquidity positive for
equities.
Expectation
If Nifty sustains above 24,900, we expect a bullish move towards 25,220 in the short term.
Stop-loss: Below 24,780 (to manage risk).
Cleartradingmind
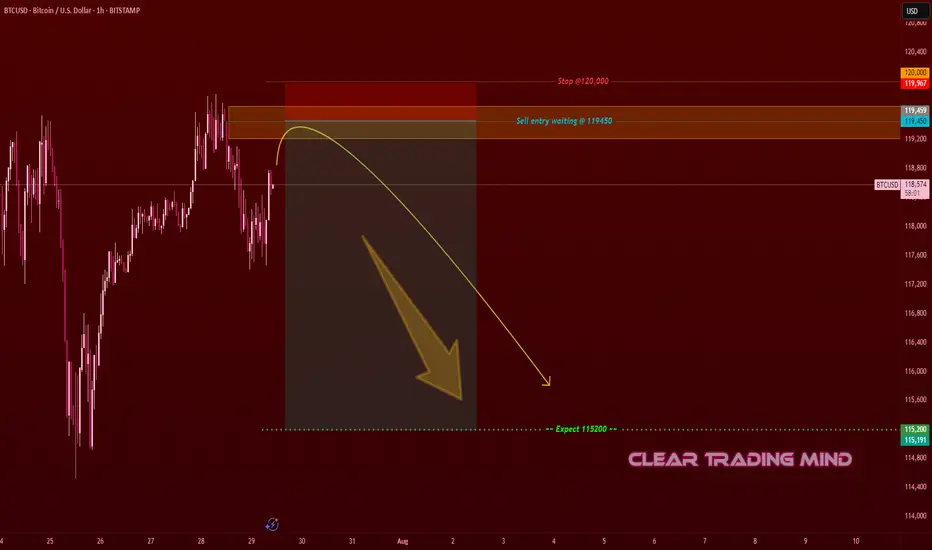
BTCUSD Turning Bearish – Eye on 115,200 Target- The price is approaching a supply zone near 119,450 – 120,000, where previous selling pressure
existed.
- Structure shows a potential lower high formation, signaling bearish momentum could continue.
- Risk-to-reward ratio looks favorable if entry triggers at 119,450 and target is 115,200.
- Confirmation with bearish candle rejection at the supply zone is recommended before
entering.
This is a sell setup aiming for a 420–450 pips move. Wait for price action confirmation near 119,450. If rejected, short positions may target 115,200.
EURNZD Supply Test – Short Setup to DemandOn the 1-hour chart, EURNZD is approaching the 0.618 Fib retracement level and testing a Fair Value Gap (FVG) 🟧 after a strong bearish move.
- Supply + OB zone above 1.96600 is acting as resistance
- Demand + OB zone near 1.94000 is the target area
Plan:
- Expecting a rejection from current levels (1.95500 – 1.95700) or from the upper supply zone
🎯 Target: Demand Zone near 1.94200 – 1.94000 (≈ 150 pips potential move)
🛡 Invalidation: Clean breakout and hold above 1.96600 supply zone
Reasoning:
- Market structure remains bearish after the recent drop
- Supply zone + FVG + Fib retracement creates a strong confluence for rejection
- Looking for confirmation before short entry
(Not financial advice – just a personal market observation)

EURUSD Supply Rejection – Bearish Move ExpectedOn the 1-hour chart, EURUSD tapped into the 4hr Supply + OB zone 🟧 and failed to hold above previous structure.
- BoS (Break of Structure) shows weakness at highs
- ChoCh (Change of Character) confirms bearish shift
- Price rejected from 0.236 Fib level (1.17400) and is moving lower
Plan:
- Expecting price to move toward 1.16200 (≈ 120 pips from current level) 🎯
- Bearish momentum remains valid as long as price stays below supply zone
- Confirmation candles & retests strengthen short bias
Reasoning:
- Supply zone rejection + failed breakout
- Clear structure shift (ChoCh) toward lower lows
- Fib retracement confluence (0.5 – 0.618 zone) aligning with sell pressure
(Not financial advice – only a personal observation)

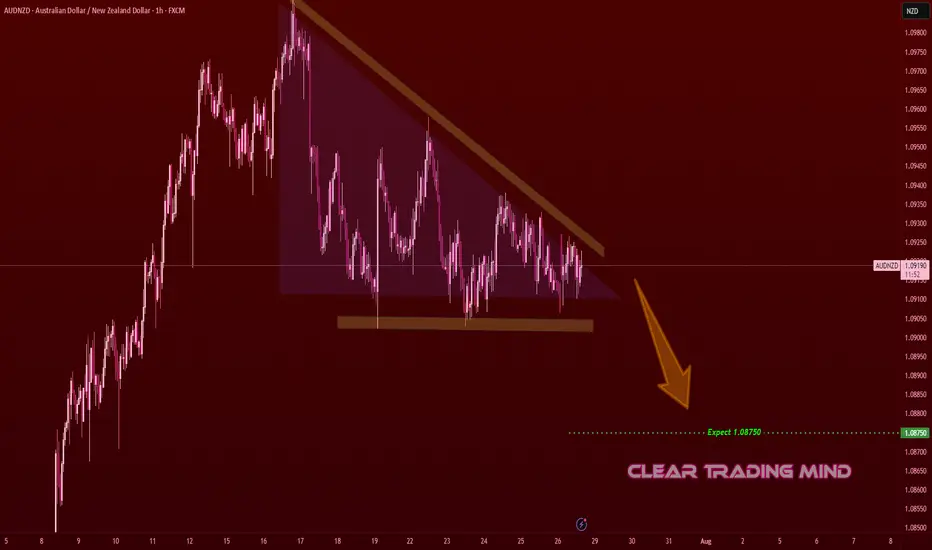
AUDNZD Descending Triangle – Bearish Breakout SetupOn the 1-hour chart, AUDNZD is forming a descending triangle 📐, a bearish continuation pattern.
- Horizontal support is holding but getting repeatedly tested
- Lower highs indicate selling pressure
Plan:
- Break and close below support may trigger a bearish continuation
- Target: 1.08750 🎯 (≈ 35 pips from current price)
- Invalidation if price breaks above descending trendline and holds
Reasoning:
- Descending triangle often leads to breakdowns when tested multiple times
- Lower highs show sellers gaining control
- Short bias remains as long as price respects the triangle resistance
(Personal chart study, not financial advice)
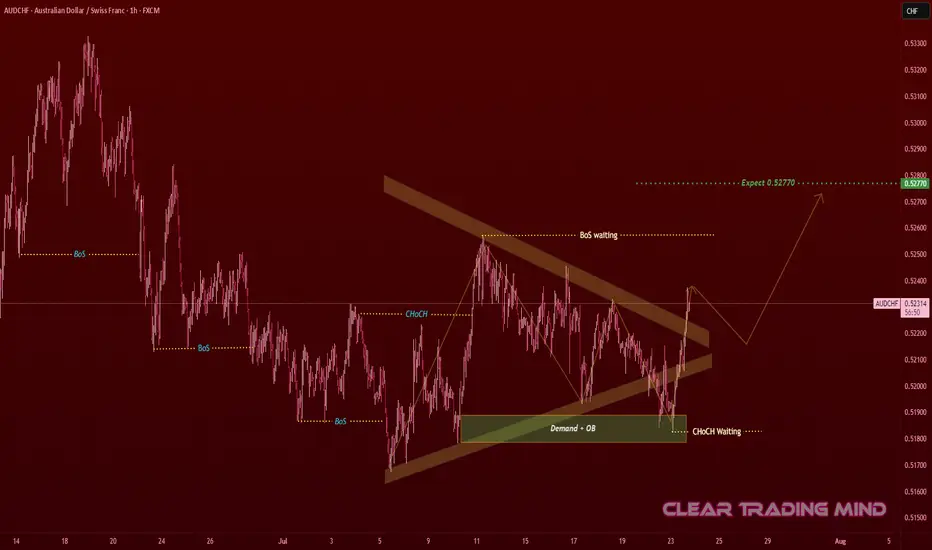
AUDCHF Contracting Triangle – Waiting for Breakout Confirmation
AUDCHF on the 1-hour chart is forming a contracting triangle 🔺, showing consolidation after a downtrend.
From an SMC perspective:
🟩 Demand + OB (Order Block) zone holding strong near 0.51900
🔄 Previous CHoCH shows buyer interest
⏳ Waiting for BoS (Break of Structure) confirmation above the triangle
Plan:
* Breakout Entry: Above 0.52400 after retest 🔓
🎯 First Target: 0.52770 – 0.52800 (≈ 37 pips from breakout)
🛡 Invalidation: Below 0.51900 (demand failure)
Reasoning:
+ Contracting triangles often lead to strong impulsive moves ⚡
+ Buyers are already active at demand 🔥
+ Confirmation of CHoCH + BoS could push price to targets 🚀
// (Not financial advice – personal chart observation)
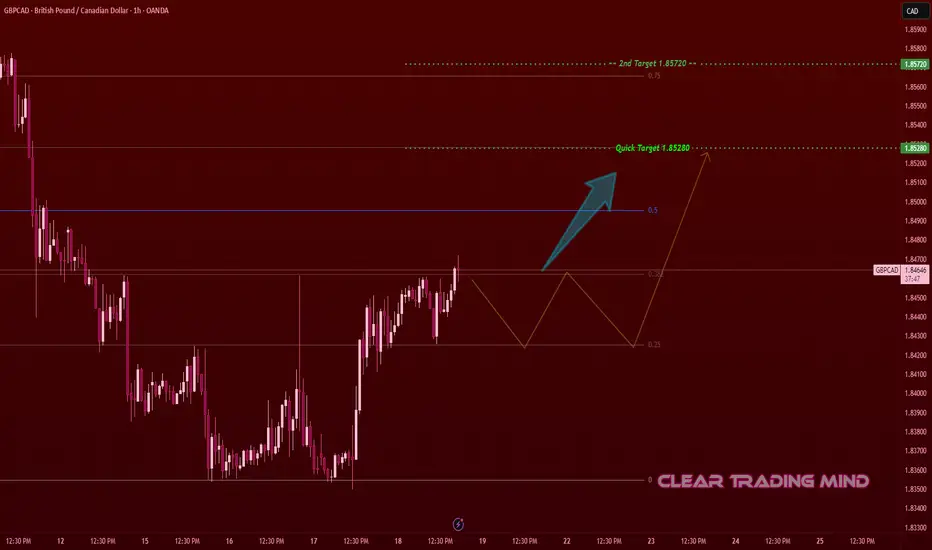
GBPCAD Showing Strength – Breakout Setup with Measured TargetsThis is my personal setup for GBPCAD on the 1-hour chart. After a strong downtrend, the price has started to form a bullish reversal pattern from the 1.83600 zone. I’m watching the current bullish structure which is showing good strength and higher lows.
🔹 Entry Idea:
I’m planning to enter above 1.84700, once price confirms a breakout and retest. This level also aligns with the 0.382 Fibonacci level.
🔹 Targets & PIPs:
🎯 First Target: 1.85280 (≈ 58 pips from entry)
🎯 Second Target: 1.85720 (≈ 102 pips from entry)
🔹 Reasoning:
- Price bounced from the 1.83600 support zone
- Forming bullish structure (higher highs & higher lows)
- Nearing Fibonacci midpoint resistance
- Increasing volume indicates potential buyers stepping in
This is my personal trade idea – not financial advice. Let’s see if price follows the plan!
CADCHF Squeeze Between OB and Trendline – Big Move Coming?CADCHF is compressing within a descending triangle structure, showing signs of bullish intent as it continues to reject a key demand + 1H order block area.
🔹 Trade Idea:
I’m watching for a bullish breakout above 0.58380, which will also confirm a trendline breakout from the descending triangle. Until then, I remain on the sidelines.
🔹 Key Technical Factors:
- Price consolidating inside a descending triangle, squeezing between lower highs and a consistent demand zone
- Repeated rejections from the green demand zone suggest buyers are defending the level strongly
- A clean order block (1H) is aligned with the bottom of this structure, adding confluence for a bullish move
- Above 0.58380 breakout may trigger momentum toward 0.58630, near the supply zone
🔹 Trade Plan:
+ Buy above: 0.58380 (on breakout + close above trendline)
+ First Target: 0.58630 (next resistance/supply area)
* Invalid if: price breaks and holds below the demand zone
⚠️ Note: Entry is only valid on confirmed breakout. Until then, patience and watchfulness around structure edges are key.

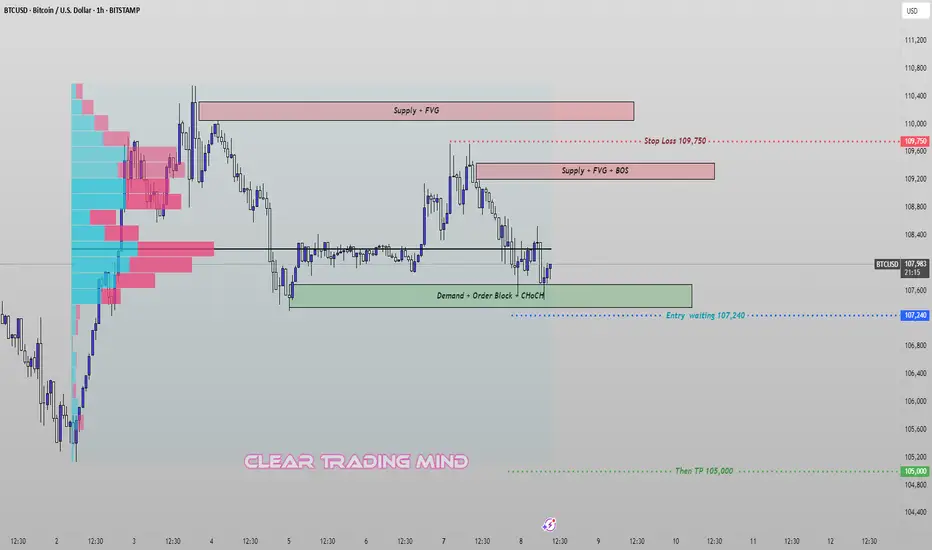
BTCUSD – Breakout Plan from Demand Zone (CHoCH + OB Setup)🔹 Current View:
I'm closely watching the 107,240 zone, where we have a strong Demand + Order Block + CHoCH (Change of Character) setup. This is a key support area that could trigger a fresh bearish move if broken.
🔹 My Plan:
I'm waiting for a clear breakout below 107,240 to enter a short position.
➡️ Entry: 107,240 (after confirmed breakout)
➡️ Stop Loss: 109,750 (above supply + BOS zone)
➡️ Target: 105,000 (previous inefficiency zone)
🔹 Supply Zones Noted:
- 109,250–109,500: Supply + FVG + BOS
- 110,000–110,500: Strong Supply + FVG
This trade is based on price breaking demand structure and retesting key supply areas above. Volume profile also shows heavy activity above, indicating possible resistance on any pullbacks.
XAUUSD – Bearish Setup: Watching Entry Below Key Level🔹 Current View:
Price is falling from the Shooting Star Candle + Supply zone and is now near a key short-term support at 3295.
🔹 My Plan:
I'm waiting for a clear break and close below 3295 to enter a short trade.
➡️ Entry: 3295 (breakout confirmation)
➡️ Target: 3266
➡️ Further drop possible toward demand zone below
🔹 Supply Zones Noted:
- 3340–3350: Supply + Shooting Star
- 3360–3370: Supply + FVG
If price respects the supply zones and breaks below 3295, we may see continuation to the downside.

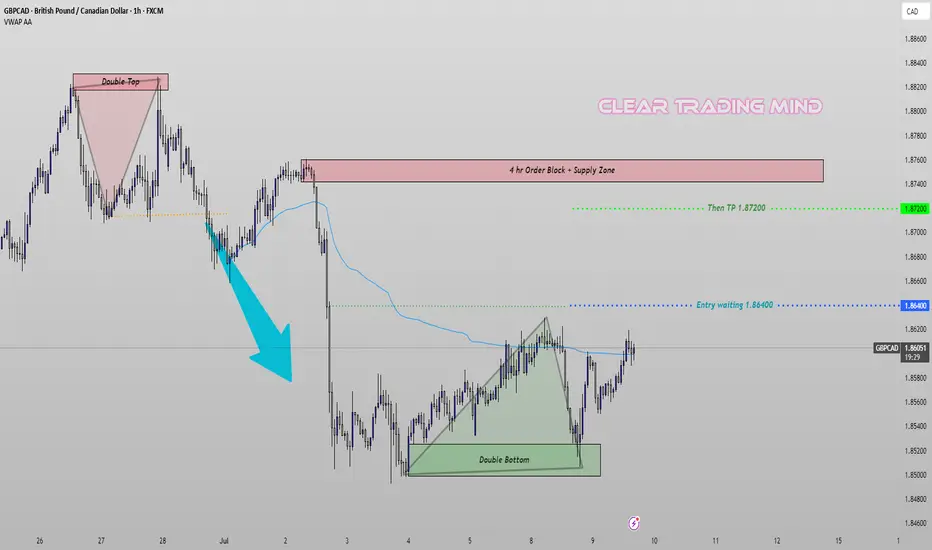
GBPCAD Bulls Preparing – Watching Break Above VWAP🔹 Current View:
The pair has formed a Double Bottom pattern around 1.8500 after a strong bearish drop from a Double Top near the 4H Supply Zone. This indicates a potential reversal.
🔹 VWAP Insight:
The blue line is VWAP, acting as dynamic resistance. Price is currently testing this area. A clean break above it could confirm bullish momentum.
🔹 My Trading Plan:
I’m waiting for the price to move above the VWAP and reach my key level at 1.86400 to enter a long trade.
➡️ Entry: 1.86400
➡️ Target: 1.87200 (near previous supply zone high)
🔹 Technical Summary:
- Bearish Pressure Origin: Double Top + 4H Order Block
- Bullish Signal: Double Bottom formation
- VWAP Breakout Watch: Key for confirming strength
If the price clears VWAP and hits the entry, I’ll look for a move toward the 1.87200 resistance zone.
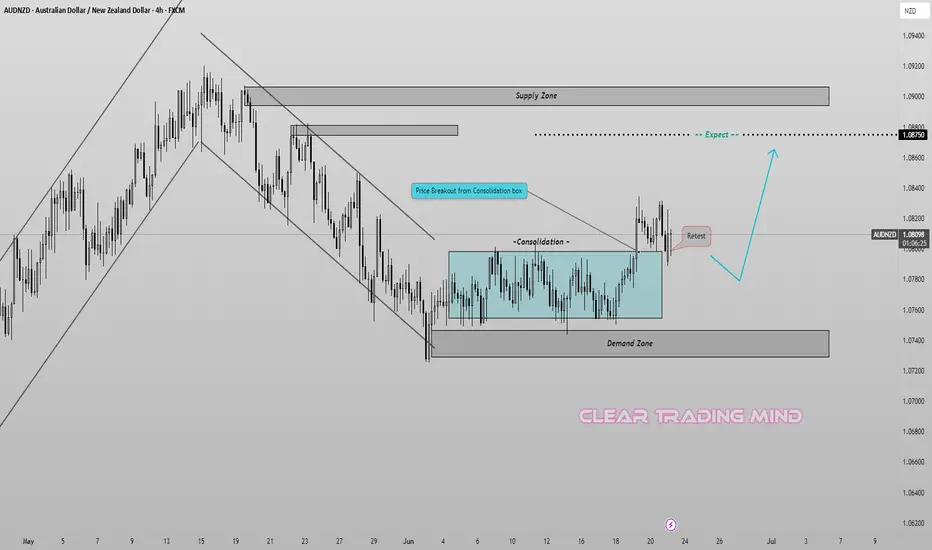
AUDNZD Breakout Retest – Ready for the Next Bullish Leg?
AUDNZD has broken out of a prolonged consolidation box, supported by a demand zone below. Price is currently retesting the breakout level, which often acts as a launchpad for the next move.
🧠 Key Observations:
🔷 Consolidation Breakout – Price cleanly broke above the consolidation range.
🔁 Retest in Progress – A potential bullish retest is unfolding at 1.0800 area.
🟦 Demand Zone below offers strong support around 1.0730–1.0750.
🎯 Target: 1.08750 (pre-identified resistance zone)
----------
📌 Trade Plan:
🎯 Take Profit (TP): 1.0875
🛑 Stop Loss (SL): Below 1.0750 demand zone
🧭 Bias: Bullish
📊 Strategy: Breakout–Retest–Rally
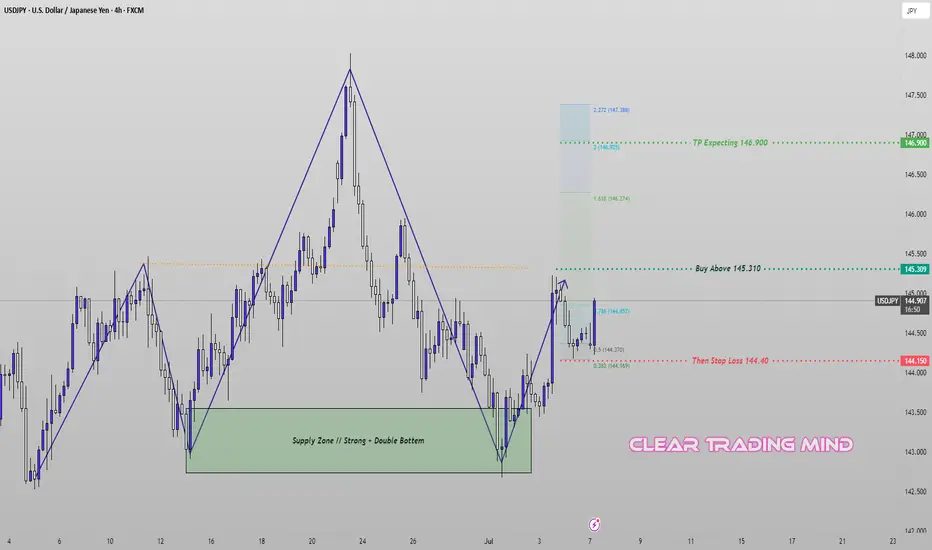
USDJPY Pre-Breakout Setup – Eyes on 145.310 for Bullish EntryThe recent structure on USDJPY (4H chart) shows a bullish shift supported by a strong double bottom formation within a defined demand zone. After a clean impulse from the bottom, price is now consolidating below the key resistance.
🔹 Trade Idea:
I am patiently waiting for the price to break and close above 145.310 to confirm bullish continuation. Entry is valid only above this level to avoid false breakouts.
🔹 Technical Highlights:
- Price rebounded from a strong demand zone with a double bottom.
- A new bullish leg formed, approaching the 0.786 Fibonacci retracement level.
- A clear impulse-correction structure signals potential for further upside if resistance is broken.
🔹 Trade Plan:
- Buy Above: 145.310 (confirmation breakout)
- Stop Loss: 144.40 (below structure and 0.382 Fib)
- Target: 146.900 (aligned with 1.618–2.0 Fibonacci extension)
⚠️ Note: No trade if price fails to break and hold above the entry trigger. Patience is key.
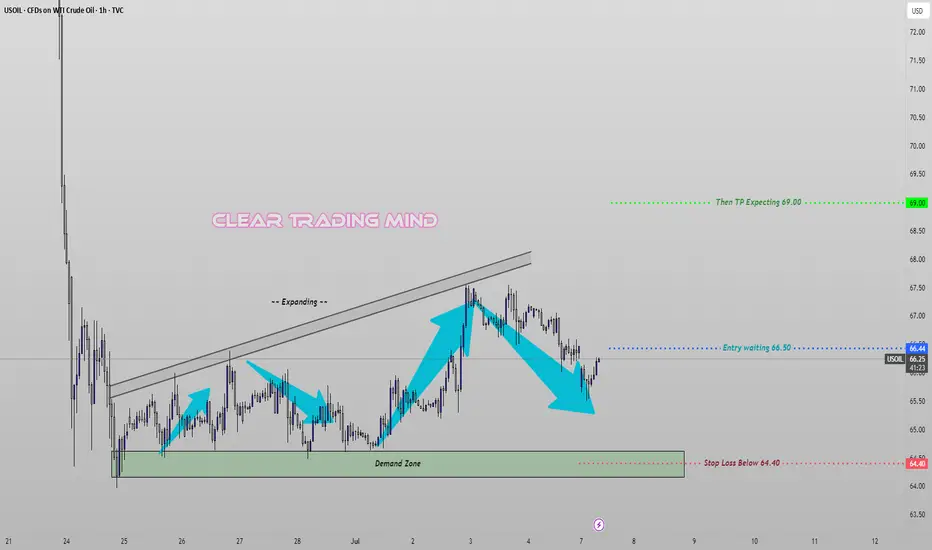
Crude Oil Eyes Bullish Breakout – Demand Zone Holding StrongCrude Oil (USOIL) is forming a potential bullish reversal structure on the 1H timeframe, supported by repeated bounces from a well-respected demand zone. Price currently consolidates below the key resistance level with a visible expanding channel, hinting at possible volatility and breakout.
🔹 Trade Idea:
I’m waiting for a clear break and close above 66.50 for a valid long entry. The setup remains invalid unless price confirms this breakout.
🔹 Technical Highlights:
- Strong demand zone held price multiple times
- Formation of higher impulses with retracements aligning well with Fibonacci levels
- Market structure suggests a continuation toward upper targets if 66.50 is broken with momentum
🔹 Trade Plan:
- Buy Above: 66.50 (breakout confirmation)
- Stop Loss: 64.40 (below demand zone and structure support)
- Target: 69.00 (near 2.272 Fibonacci extension)
⚠️ Note: No entry unless 66.50 is broken convincingly. Setup favors disciplined execution only on confirmation.
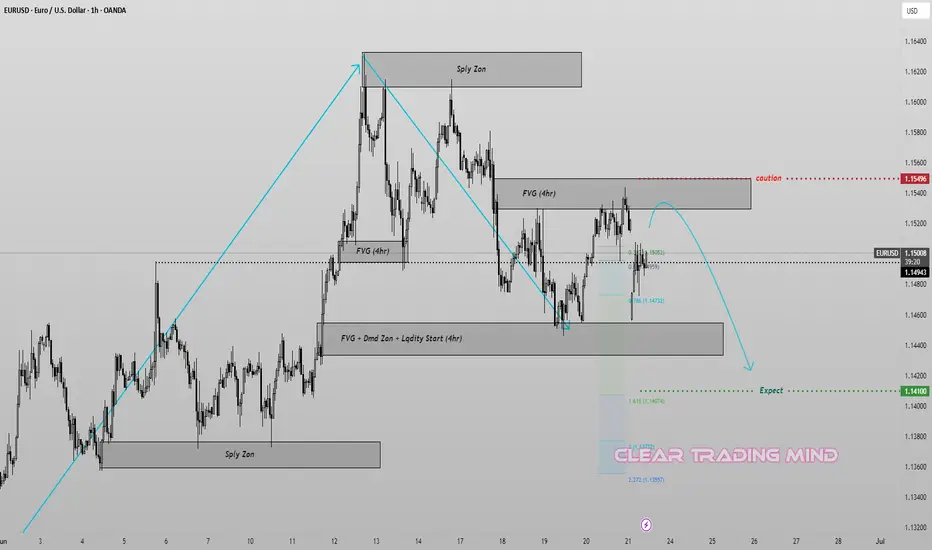
Supply Trap Revisit Before Final Drop? | Smart Money Outlook
📉 Price has recently reacted from a strong FVG + Demand + Liquidity Start Zone (4hr) around 1.1450, confirming bullish intent temporarily.
📈 However, a corrective move is now heading into a 4hr Fair Value Gap (FVG) zone near 1.1520–1.1550, which aligns with a potential lower high setup.
Key Zones:
Supply Zone @ 1.1550 (Caution): Watch for rejection signs here—high confluence with previous imbalance.
Bearish Expectation: After liquidity grab or mitigation in FVG, expect a strong sell-off targeting the 1.1410 level (measured move and 1.618 fib extension).
⚠️ Be cautious of price pushing slightly above 1.1550 to sweep liquidity before reversing.
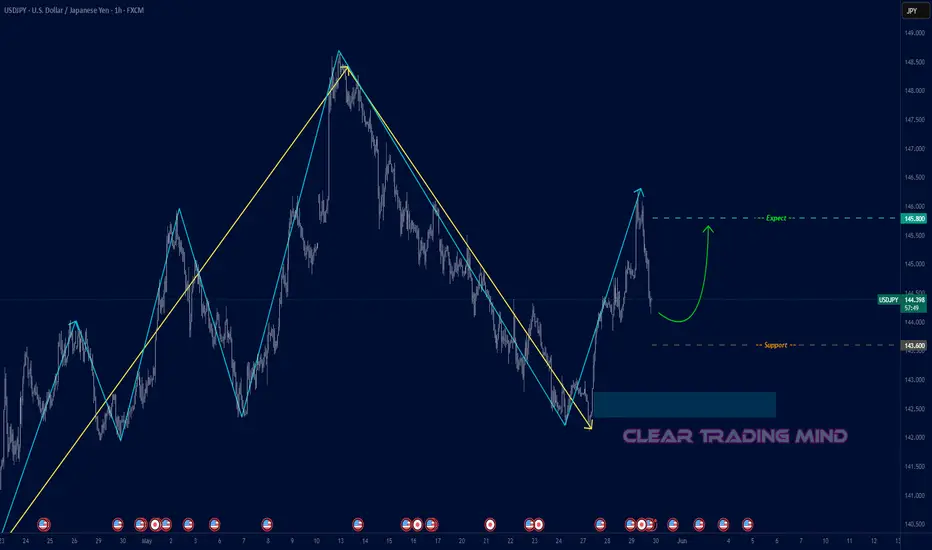
USDJPY Bullish Pullback Setup – Targeting 145.800
USDJPY has broken out of the previous downtrend structure and is now showing a potential bullish continuation pattern.
- The recent impulse move from the demand zone (highlighted in blue) confirms buying interest around 143.600.
- The current pullback could offer a buy opportunity, especially if the price retests the 143.600 support zone or forms a higher low.
- As long as the price holds above this key support, we expect the pair to continue upward toward the next major resistance at 145.800.
USDJPY is forming a clean bullish correction after an impulsive move up. If support at 143.600 holds, the next bullish leg could extend to 145.800. Watch for bullish confirmation near the pullback zone.
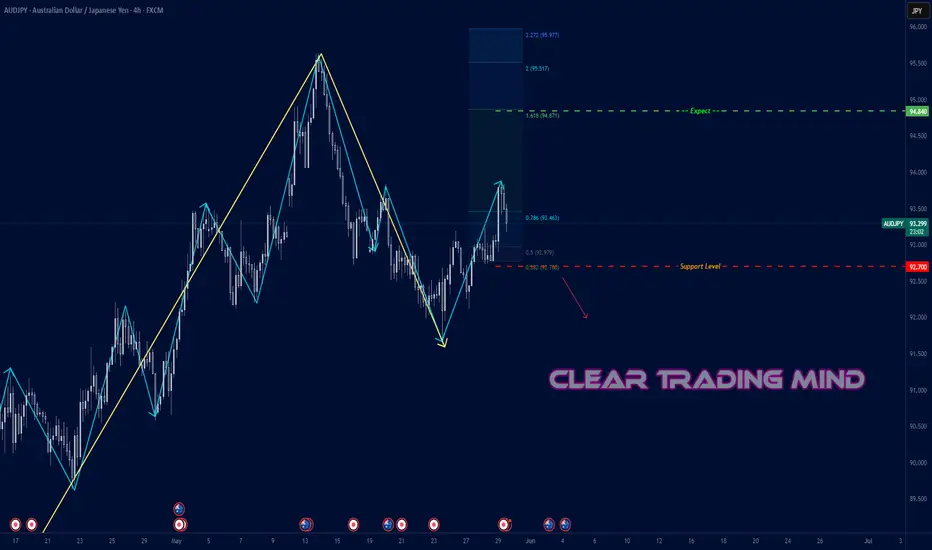
AUDJPY Bounce or Breakdown? Key Levels Ahead
AUDJPY is currently showing bullish signs after a Change of Character (CHoCH) occurred at the 93.800 level. This breakout suggests potential for upward continuation.
The ZigZag structure also supports a bullish wave continuation, with the next Fibonacci-based target around 94.840.
A possible pullback remains valid as long as the price stays above the support zone at 92.700. Any breakdown below that level could weaken the bullish structure.
---------------------
📍 4H Chart Analysis (Supportive Confirmation)
On the higher timeframe (4H), the market appears to be forming an Inverse Head and Shoulders pattern , a strong bullish reversal structure.
- The price is currently building the right shoulder , with a potential neckline breakout targeting 96.000 , a strong psychological resistance.
- Two major scenarios to consider:
1. ✅ If price breaks above the neckline and sustains above 96.000, it could lead to a strong bullish rally.
2. ❌ If price fails to complete the pattern and breaks below the shoulder zone at 92.000, it may trigger a bearish move instead.
---------------------
🧠 Conclusion
As long as 92.700 holds , the 1H bullish scenario remains valid with a near-term target of 94.840 . The 4H chart adds strong structure support via the developing Inverse Head & Shoulders, favoring buyers — unless invalidated by a breakdown below 92.000.
📈 Active Bullish Setup (Above 92.700)
🎯 Target: 94.840 | Max Bull Potential: 96.000
🛑 Invalidation Below: 92.700 / 92.000 (4H shoulder base)
EURNZD: Double Confluence with Fibonacci and Head & Shoulders
EURNZD shows a potential bearish reversal setup after hitting the resistance zone at 1.9100 . The price has rejected from the 0.786 Fibonacci retracement level , aligning closely with the psychological resistance at 1.9100 — forming a double confluence.
A potential short-term retracement is expected toward the 1.88300 zone, which is projected by the 1.618 Fibonacci extension and acts as a round figure support level .
🟩 Key Levels:
- Resistance: 1.9100 (also recent swing high)
- Expected Target: 1.88300
- Invalidation Above: A clean breakout and close above 1.9100
---------------------
📍 4H Chart Analysis
A Head and Shoulders pattern is clearly forming on the 4H timeframe. The price is currently testing the neckline zone , and if a breakdown occurs, it may confirm a deeper bearish movement , adding higher timeframe support to the bearish idea.
This structure further strengthens the bias that the recent bullish retracement might have ended, and the next leg could be downward toward the expected zone.
The confluence of Fibonacci levels on the 1H chart and the bearish Head & Shoulders formation on the 4H chart suggests that bears might take control below 1.9100 . As long as the price stays under this key resistance, the bearish outlook remains valid, targeting 1.88300.

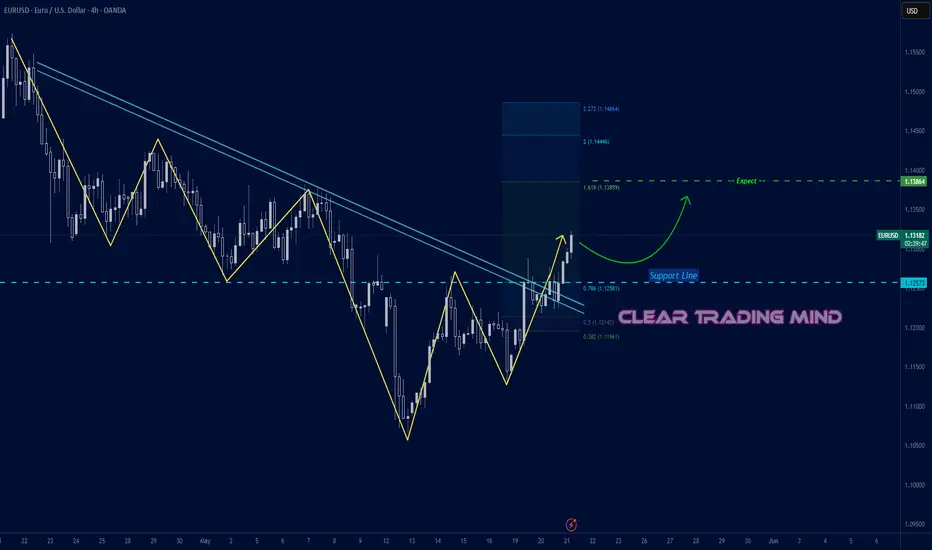
EURUSD Trendline Breakout – Bullish Target Ahead
EURUSD has successfully broken out of a strong descending trendline, which was acting as dynamic resistance for weeks. The breakout is backed by strong bullish candles and clear higher lows forming.
After the breakout, the price also reclaimed a key horizontal support zone around 1.12573, turning it into a solid base for further upside.
🎯 Bullish Target (Expected):
First major bullish target at 1.13864 based on the 1.618 Fibonacci extension from the last swing move.
📌 Support: 1.12573
📌 Breakout Confirmation: Valid as long as price holds above the trendline and support.
📈 Outlook:
The momentum looks strong for further bullish continuation. If the price holds above the breakout zone, we expect a move toward 1.13864 in the coming sessions.
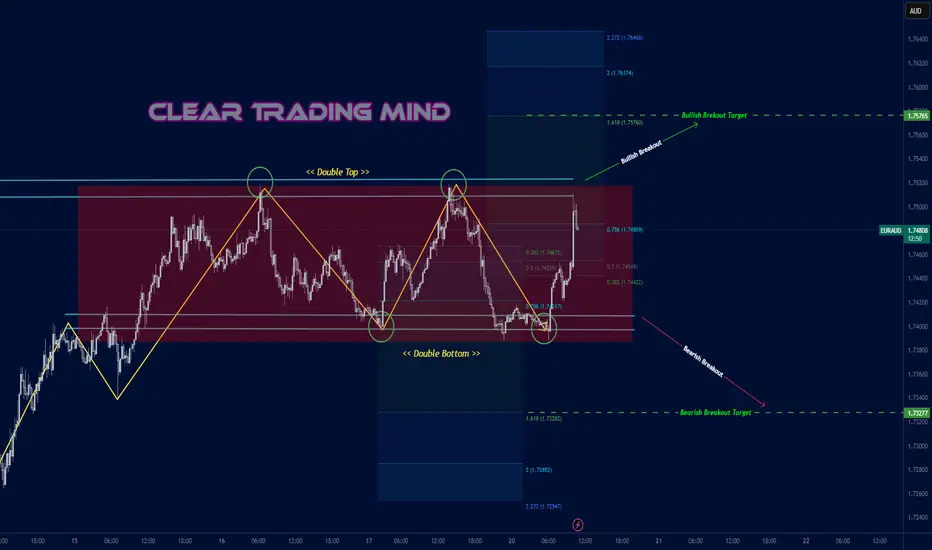
EURAUD Squeeze: Box Breakout Ahead
EURAUD has been moving sideways inside a clear consolidation box pattern between 1.75200 (resistance) and 1.74000 (support).
✅ A Double Top has formed at the top of the box
✅ A Double Bottom has formed at the bottom of the box
This setup signals a potential breakout move is building up. The market is coiling and could soon release strong momentum in one clear direction.
🚀 Bullish Breakout Scenario
If price breaks and closes above 1.75200, we can expect continuation toward:
📌 1.75765 (Fibonacci 1.618 extension – 1st target)
📌 Even higher levels possible if momentum continues.
📉 Bearish Breakout Scenario
If price breaks below 1.74000, downside targets are:
📌 1.73277 (Fibonacci 1.618 extension – 1st target)
📌 Further levels may follow if sellers take control.
🔔 My Plan:
Waiting for a clean breakout and retest on either side before entering.
Avoid trading inside the box—no clear trend there.
This setup has strong potential once a direction is confirmed!
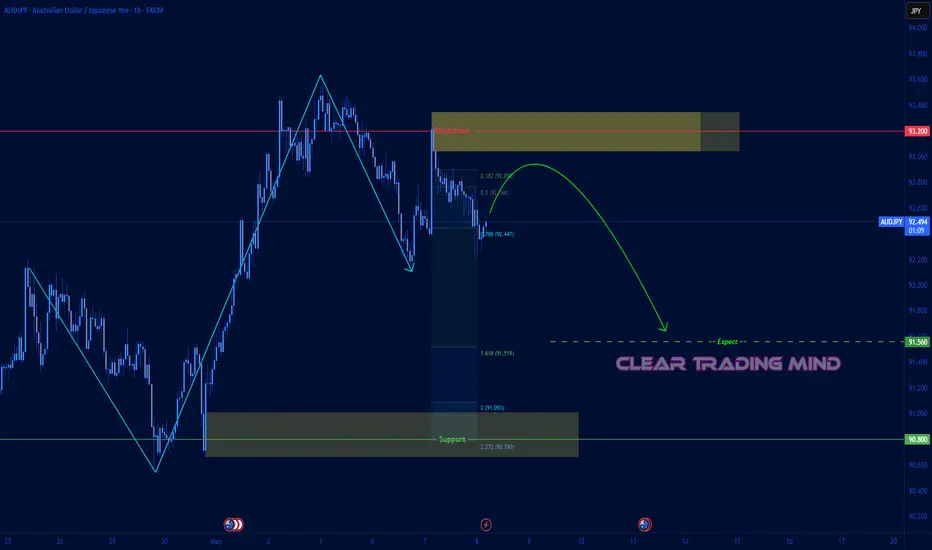
AUDJPY Set to Slide – Targeting 91.560
AUDJPY is currently showing signs of a bearish continuation after a corrective pullback from the recent swing low. Price has retraced up to the 0.786 Fibonacci level (92.447) and is now stalling below the key resistance zone near 93.200, which aligns with the 0.382–0.5 retracement levels. This confluence zone acts as a supply area, increasing the probability of downside movement.
🟩 Support Zone to Watch:
A major support and expected price reaction is anticipated around 91.560, which coincides with the 1.618 Fibonacci extension level. Further continuation may test deeper zones near 91.093 or even 90.800 if bearish momentum strengthens.
📰 Fundamental Outlook:
- 🇦🇺 Australia RBA Policy Hold: The Reserve Bank of Australia (RBA) held interest rates steady recently, signaling cautious optimism but refrained from any hawkish guidance. Markets have priced out further hikes, weakening AUD sentiment.
- 🇯🇵 BOJ Dovish Shift Easing: The Bank of Japan has started to unwind ultra-loose policy, hinting at more flexibility in yield control. This has brought some relief to the JPY, adding pressure on JPY pairs like AUDJPY.
- 📉 Risk Sentiment Cooling: Global equities have shown weakness due to concerns over slower Chinese growth and geopolitical tensions, making safe-haven assets like the Japanese Yen more attractive.
EUR/USD Breakout Watch: All Eyes on 1.12700 Zone
EUR/USD is showing a potential bearish setup after rejecting the strong resistance zone around 1.13800 and forming a Change of Character (ChoCh) at the 1.13100 level. The pair has bounced from the strong support zone at 1.12700 , but structure suggests that a break below this level could confirm a bearish continuation.
🔎 Technical Breakdown:
- Price has respected the lower high structure and retraced to the 0.786 fib level near 1.12975.
- A clear breakdown below 1.12700 support would likely trigger a wave down toward the 1.12100 expected target , which aligns with the 1.618 fib extension.
- If price breaks and holds above 1.13800 resistance , this bearish setup becomes invalid.
📰 Fundamental Drivers Supporting Bearish Bias:
- 🇺🇸 US Dollar Strengthening: Recent U.S. economic data including better-than-expected ISM Services PMI and non-farm payrolls continue to support a strong dollar, limiting EUR upside.
- Federal Reserve Hawkish Stance: Fed officials remain cautious about rate cuts. A prolonged pause or delay in easing continues to attract capital back into USD.
- 🇪🇺 Eurozone Weakness: The ECB has signaled a possible rate cut by June, supported by falling inflation and slowing growth in Germany and France. This diverging policy path weakens the Euro.
Yield Spread Pressure: The widening bond yield spread between U.S. and European bonds favors USD accumulation.
// As long as EUR/USD trades below 1.13800, the bias remains bearish. A confirmed breakdown below 1.12700 could open the door to 1.12100 and deeper targets like 1.11600. //

AUDNZD Bulls Eyeing a Recovery from Key Support Zone
📉 After a sharp fall, AUDNZD has tapped into a well-defined support zone around 1.07800, forming a possible retracement setup.
📊 Technical Insight:
- Price reacted strongly from the support zone, hinting at buyer interest.
- RSI on the 1H chart is rebounding from the oversold area , suggesting potential bullish momentum.
- Expected retracement target: 1.08245 , a previous resistance level.
📰 Fundamental Boost:
- AUD remains resilient despite global risk sentiment due to improving commodity prices, especially in iron ore — a key Australian export.
On the NZD side, recent RBNZ dovish commentary has slightly weighed on the Kiwi, adding a supportive tone for AUDNZD upside.
📌 Invalidation:
If price breaks and closes below the 1.07800 support zone, this setup becomes invalid.
