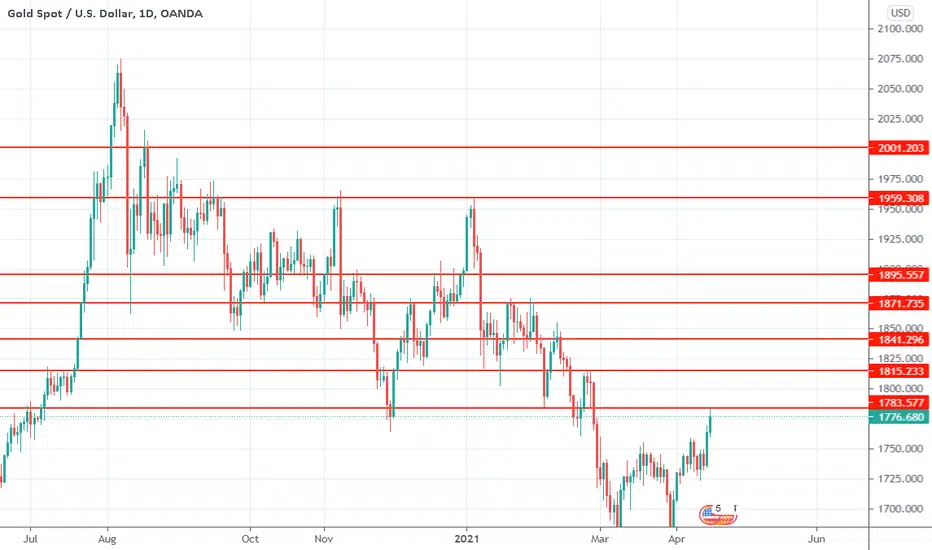
daily close above 1783 for 1815, wick not counteddaily close above 1783 for 1815
daily close above 1815 for 1841
daily close above 1841 for 1871
daily close above 1871 for 1895
daily close above 1895 for 1959
daily close above 1959 for 2000 (note this last one different technical analysis, it could go higher than 2000)
Closecandle
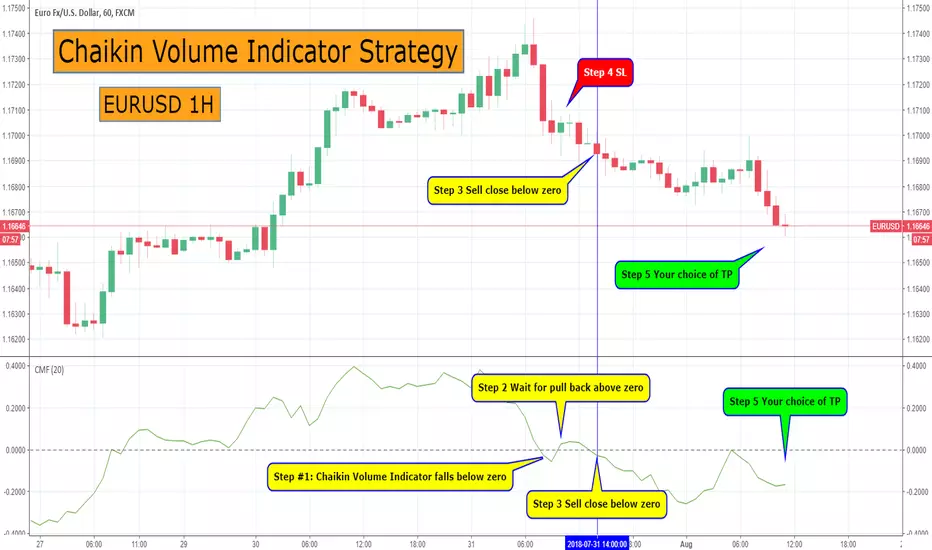
Chaikin Volume Indicator Strategy EURUSD 1HThe reason why Chaikin Money Flow is the best volume indicator and it’s better than the classical volume indicator is because it measures institutional accumulation-distribution.
Typically on a rally the Chaikin volume indicator should be above the zero line. Conversely, on sell-offs the Chaikin volume indicator should be below the zero line.
Step #1: Chaikin Volume Indicator must shoot up in a straight line from above zero (minimum +0.15) to below the zero line (minimum -0.15)
When the Volume goes from positive to negative in a strong fashion way it has the potential to signal strong institutional selling power. That’s our base heavy lifting signal!
Basically, we let the market to reveal its intentions.
When the big money steps into the market, they leave a mark as their orders are so big that it’s impossible to hide. When the volume indicator forex goes straight from above zero to below the zero line and beyond it shows accumulation by smart money.
We’re firm believer that you get your maximum bang for the buck when you trade side by side with the smart money. The institutions have more money than you have, more resources than you have and probably they are smarter than you. It’s pretty obvious that the odds are stacked against you, so if you want to change that just follow the smart money.
Step #2: Wait for the Volume Indicator Forex to slowly pullback above the zero line. The price needs to remain below the previous swing high.
Once we spotted the big elephant in the room aka the institutional players we start to look for the first sign of market weakness. Here is how to identify the right swing to boost your profit.
We’re going to let the Chaikin Money Flow indicator slowly move above the zero line. The key word here is “slowly”. We don’t want to see the volume dropping fast because this will invalidate the accumulation noted previously.
Secondly, as the volume decreases and moves above the zero line, we want to make sure the price remains below the previous swing high. This will confirm the smart money accumulation.
Step #3: Sell once the Chaikin Forex indicator breaks back below the zero line. Wait for the candle close before pulling the trigger.
Now that we have observed real institutional money coming into the market, we wait for them to step back in and drive the market back down.
When the Chaikin indicator breaks back below the zero line, it signals an imminent rally as the smart money are trying to selloff the price again.
Obviously that we would need to wait for the candle close to confirm the Chaikin break below the zero line. Once everything aligns together we’re free to open our short position.
Note* The trigger candle needs to have the closing price in the upper 25%.
Step #4: Hide your protective Stop Loss above the previous pullback’s high.
Using a stop loss is crucial if you want to have an idea of how much you’re about to lose on your trade. Never underestimate the power of placing a stop loss as it can be lifesaving.
Simply hide your protective stop loss above the previous pullback’s high. Never use a mental stop loss and always commit a SL right at the moment you open your trades.
Trading with a tight stop loss can give you the opportunity to not just have a better risk to reward ratio but also to trade bigger lot size.
Step #5: You choose your Take profit or Take profit when the Chaikin Volume moves above +0.15
Once the Chaikin volume moves back above +0.15 it indicates that the buyers are stepping in and we want to take profits. We don’t want to risk giving back some of the profits gained so we liquidate our position at the first sign of the smart money stepping in on the other side of the market.
We always can get back into the market later if the smart money show up again.
Note** the above was an example of a SELL trade using the best volume indicator. Use the same rules for a BUY trade – but in reverse.
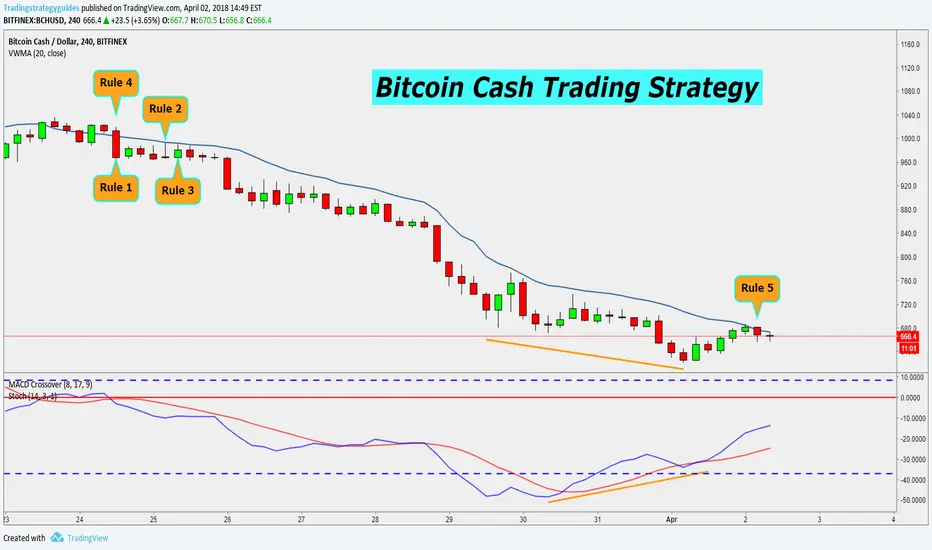
Bitcoin Cash Trading StrategyRule #1: Wait for a strong breakout and a close above the VWMA
To determine whether Bitcoin cash breakout above the VWMA is genuine, we can use different tools, but the most accurate one is to use the price action. In order to get a good read on the breakout strength we want to see strong bullish bars that break above the VWMA with conviction.
When the Bitcoin cash price trades above the VWMA we know this is a bullish signal.
As a second condition to validate the breakout, we look for close above the VWMA. The higher the closing price is the better.
Rule #2: Look for a retest of the VWMA and a reaction higher from it. Preferably we want to see a pin bar or bars with long wicks.
After we have detected the breakout, we wait for a retest of the broken VWMA. More than this we also want to see at the first retest a reaction higher.
This reaction higher should develop a pin bar pattern or a candlestick bar that has long wicks.
The long candlestick wicks represent institutional buying in this case.
If the breakout was genuine and real institutional buying was behind this move then we want the bulls to defend this price levels and keep Bitcoin cash price trading above the VWMA.
Rule #3: Buy at the opening of the next candlestick after the pin bar
It’s important to follow all the steps and only enter the market once you have enough evidence that the institutional money are on your side.
When you have multiple confirmations for your trade signal, you increase your chances of success.
So, buy Bitcoin cash at the opening of the next candle after the pin bar.
Rule #4: Hide your protective stop loss below/above the breakout candle
The lowest/highest price of the breakout candle is an important technical level because that’s the moment smart money stepped into the market. If this level gives up then we know for sure the bulls/bears are very weak and it’s best to let this trade go.
Our stop loss strategy is to place our protective stop loss below/above the breakout candle.
Rule #5: Take Profit when we break and close below/above the VWMA
When Bitcoin cash price trades below/above the VWMA this is a bearish/bullish signal. If you bought/sold Bitcoin cash and all of a sudden we trade below/above the VWMA, then it’s best to take profits and close the trade.
You’ll notice that many times Bitcoin cash will produce false breakouts below/above the VWMA. This means that you’ll get out of your trade too early. To counteract this drawback, as an alternative, you can take partial profits and then trail your SL below/above the VWMA.