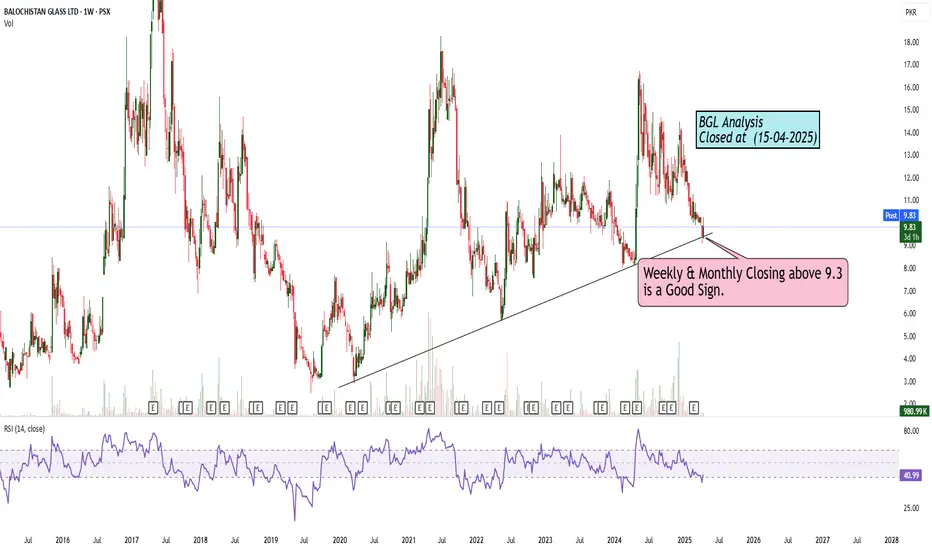
Monthly Closing above 63.50 ..?IBLHL Analysis
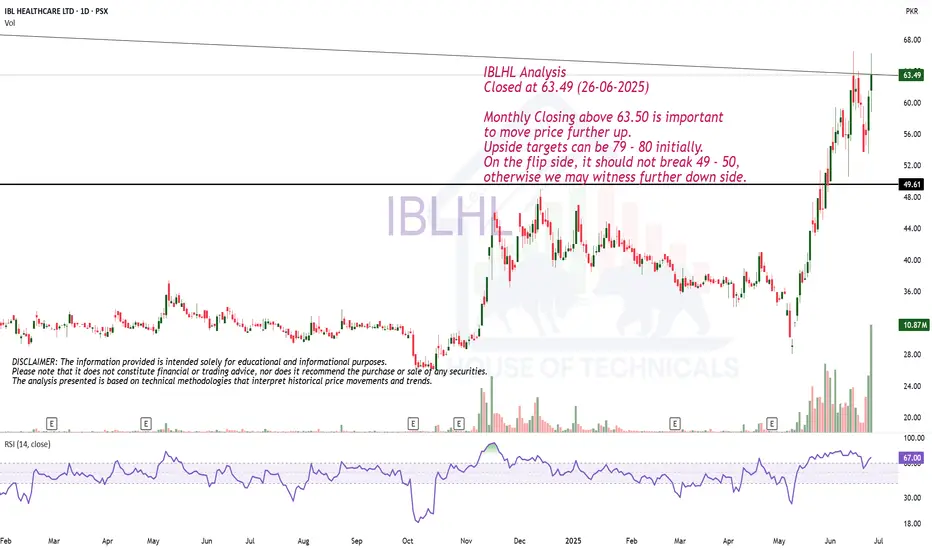
Closed at 63.49 (26-06-2025)
Monthly Closing above 63.50 is important
to move price further up.
Upside targets can be 79 - 80 initially.
On the flip side, it should not break 49 - 50,
otherwise we may witness further down side.
Closingprice
The "True Close" Institutions Don't Talk About — But Trade On█ My Story from the Inside
I worked at a hedge fund in Europe, where I served as a Risk Advisor. One thing I never expected before joining the institutional side of the market was this:
They didn’t treat the current day’s close as the "true" close of the market.
Instead, they looked at the first hour of the next day — once all pending flows had settled, rebalancing was done, and execution dust had cleared — that was the true close in their eyes.
Here’s why that changed everything I knew about trading:
█ Institutional Reality vs Retail Fantasy
⚪ Retail traders are taught:
“The daily close is the most important price of the day.” But institutions operate under constraints that most retail traders are never exposed to:
Orders too large to fill before the bell
Internal compliance and execution delays
Batch algorithms and VWAP/TWAP systems that extend into the next session
So while the market might close on paper at 17:30 CET, the real trading — the stuff that matters to funds — might not wrap up until 09:30 or 10:00 the next morning.
Although the official “close” prints here, institutional volume ends quickly. It drops off sharply, almost immediately. Once the books are closed and final prints are done, big players exit — and what's left is thin, passive flow or noise.
The first hour of the New York session reveals structured flows, not random volatility. This is where institutions finalize yesterday’s unfinished business, which is why many consider this the “true” close.
And that’s the price risk managers, portfolio managers, and execution teams internally treat as the reference point.
█ Example: The Rebalance Spillover
Let’s say a fund needs to offload €100 million worth of tech stocks before month-end. They start into the close, but liquidity is thin. Slippage mounts. They pause execution. Next morning, their algo resumes — quietly but aggressively — in the first 30 minutes of trade.
You see a sharp spike. Then a reversal. Then another surge.
That’s not noise. That’s structure. It’s the result of unfinished business from yesterday.
█ Why the First Hour is a War Zone
You’ve probably seen it:
Prices whip back and forth at the open
Yesterday’s key levels are revisited, sometimes violently
Big moves happen without any overnight news
Here’s what’s happening under the hood:
Rebalancing spillovers from the day before
Late-position adjustments from inflows/outflows
Risk parity or vol-targeting models triggering trades based on overnight data
The market’s not reacting to fresh news — it’s completing its old to-do list.
█ What the Research Really Says About Morning Volatility
The idea that "the true close happens the next morning" isn’t just insider intuition — it’s backed by market microstructure research that highlights how institutional behaviors disrupt the clean narrative of the official close.
Here’s what the literature reveals:
█ Heston, Korajczyk & Sadka (2010)
Their study on intraday return patterns shows that returns continue at predictable 30-minute intervals, especially around the open.
The key driver? Institutional order flow imbalances.
When big funds can’t complete trades at the close, they spill into the next session, creating mechanical, non-informational momentum during the first hour. These delayed executions are visible as persistent price drifts after the open, not random volatility.
█ Wei Li & Steven Wang (SSRN 2010)
This paper dives into the asymmetric impact of institutional trades. It shows that when institutions are forced to adjust positions — often due to risk limits, inflows/outflows, or model-based triggers — the market reacts most violently in the early hours of the day.
When funds lag behind the clock, the next morning becomes a catch-up window, and price volatility spikes accordingly.
█ Lars Nordén (Doctoral Thesis, Swedish Stock Exchange)
In his microstructure research, Nordén found that the variance of returns is highest in the early part of the session, not at the close. This is especially true on days following macro events or at the end/start of reporting periods.
The data implies that institutions “price in” what they couldn’t execute the day before, making the next morning more informative than the actual close.
█ Bottom Line from the Research:
The first hour isn’t wild because it’s full of emotion.
It’s wild because it’s full of unfinished business.
These studies reinforce that price discovery is a rolling process, and for institutional flows, the official close is just a checkpoint, not a final destination.
█ How to Use This as a Trader
⚪ Don't assume the official close is final
Treat it as a temporary bookmark. Watch what happens in the first hour of the next day — that’s when intentions are revealed.
⚪ Volume in the first 30–60 minutes matters
It’s not noise — it’s flow completion. Often non-price-sensitive. Often mechanical.
⚪ Design strategies around “true close” logic
Test fade setups after the first hour’s range is established. That’s often the real “settled” level.
⚪ Use the first-hour VWAP or midpoint as a reference
Institutions may anchor to that — not the official close — for mean reversion or risk metrics.
█ Final Thought
The first hour is not the start of something new.
It’s the conclusion of yesterday’s market.
And unless you understand how institutions truly close their books — and how long that takes — you’ll always be a step behind.
So next time you see chaos at the open, stop calling it random.
👉 It’s just the market putting yesterday to bed — late.
-----------------
Disclaimer
The content provided in my scripts, indicators, ideas, algorithms, and systems is for educational and informational purposes only. It does not constitute financial advice, investment recommendations, or a solicitation to buy or sell any financial instruments. I will not accept liability for any loss or damage, including without limitation any loss of profit, which may arise directly or indirectly from the use of or reliance on such information.
All investments involve risk, and the past performance of a security, industry, sector, market, financial product, trading strategy, backtest, or individual's trading does not guarantee future results or returns. Investors are fully responsible for any investment decisions they make. Such decisions should be based solely on an evaluation of their financial circumstances, investment objectives, risk tolerance, and liquidity needs.
Very Good Monthly Closing.
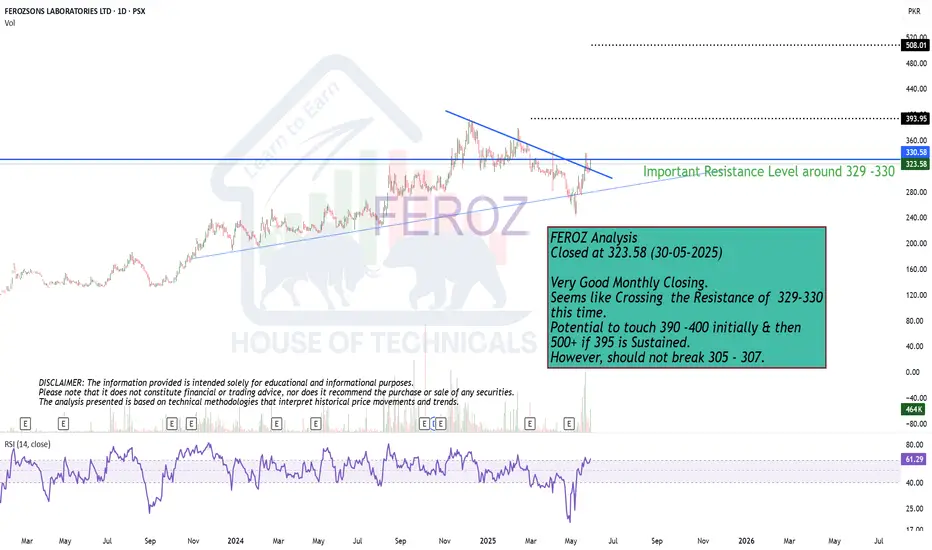
Closed at 323.58 (30-05-2025)
Very Good Monthly Closing.
Seems like Crossing the Resistance of 329-330
this time.
Potential to touch 390 -400 initially & then
500+ if 395 is Sustained.
However, should not break 305 - 307.
Channel bottom Support Taken...Important to Close above 40.84
on Monthly Basis for further
Upside.
Channel top is around 44 - 45

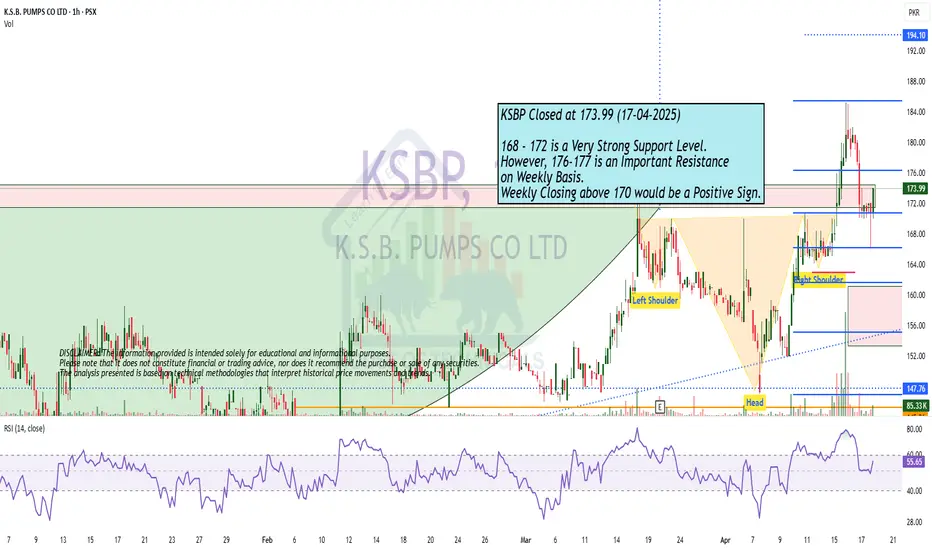
Good Support168 - 172 is a Very Strong Support Level.
However, 176-177 is an Important Resistance
on Weekly Basis.
Weekly Closing above 170 would be a Positive Sign.
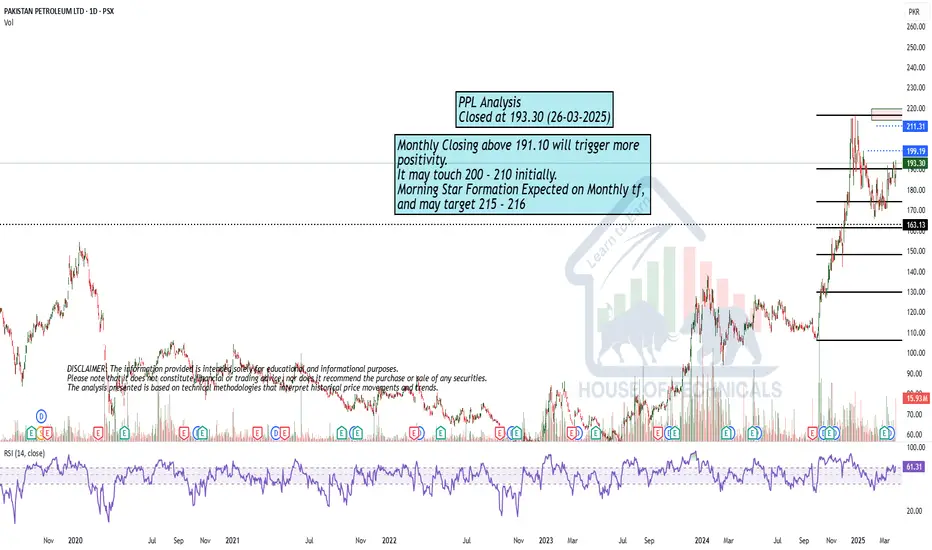
Positive Monthly Closing is ImportantMonthly Closing above 191.10 will trigger more
positivity.
It may touch 200 - 210 initially.
Morning Star Formation Expected on Monthly tf,
and may target 215 - 216
Bullish Divergence on Shorter TFImmediate Support seems to be
around 82 - 84.
If this level is not sustained, we
may witness 65 - 72 range.
However, Bullish Divergence on Shorter
time frame may give it a spike of 3-5 rupees.

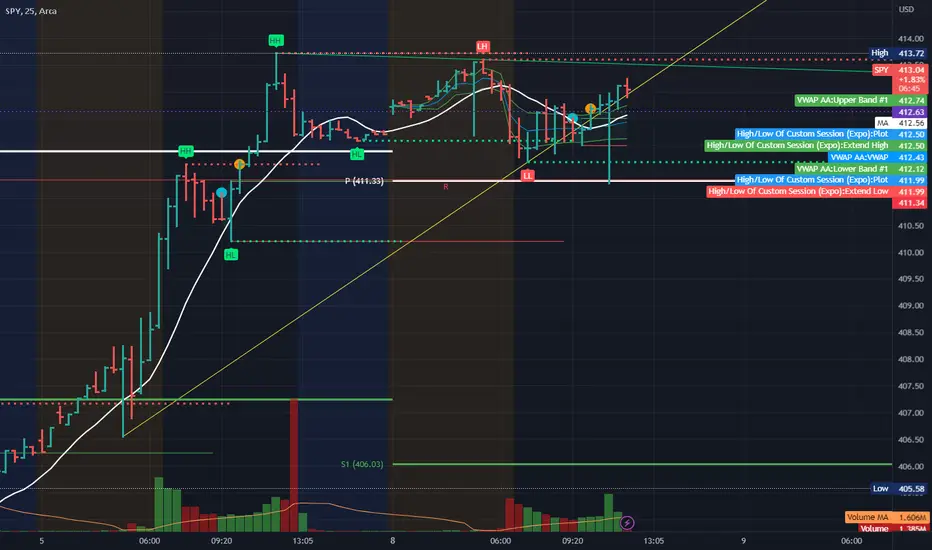
spy either above 413 or below 412 spy either above 414 or below 412 at closing low vol day which could push the spy price higher.
hard to play the direction today. let see what will happen tomorrow and wed cpi and other important data coming out.
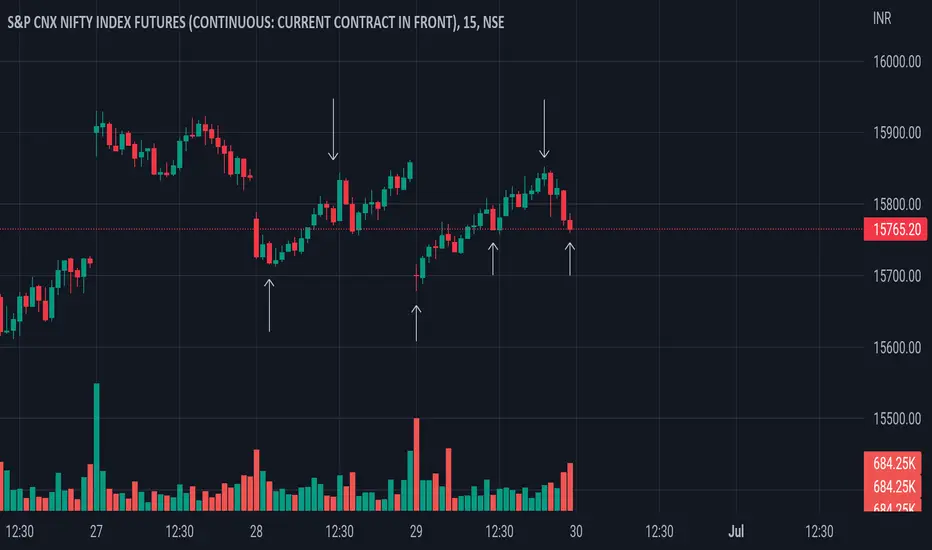
Nifty50 Sideways Openning Tomorrow After a long momentum of bearish market market begains to make swing high or swing lower low and today is market also give a straight buying movement So according to my view or Analysis maybe market is going to open sideways tomorrow morning and didn't be able to break week's higher high.
Weekly Closing Bell for 7th January 2022This is the Weekly Closing Bell. Here readers can view the closing price of selected securities for week ending by 7th January 2022.
Name of the index (Ticker) = closing price for 7th January 2022
Forex
EURUSD = 1.16609 USD
EURGBP = 0.83548 GBP
EURAUD = 1.57158 AUD
USDEUR = 0.8801 EUR
USDGBP = 0.73565 GBP
USDAUD = 1.3922 AUD
North America
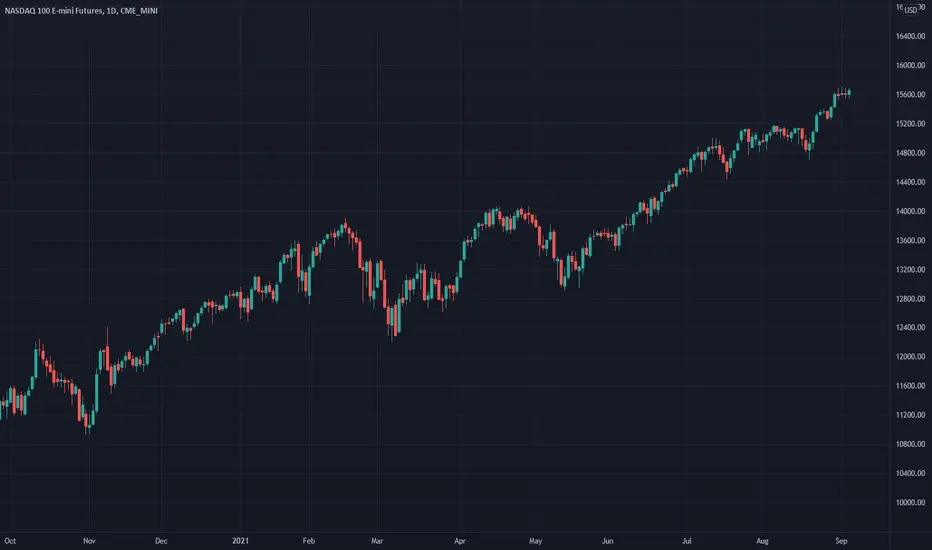
Nasdaq 100 (NDX) = 15 592.19 USD
S&P 500 (SPX) = 4 677.04 USD
Russel 2000 (US2000) = 2 171.60 USD
Dow Jones Industrial Average (DJI) = 36 231.67 USD
European
DAX 40 (DEU40) = 15 947.741 EUR
FTSE 100 (UK100) = 7491.70 GBP
CAC 40 (FR40) = 7 219.49 EUR
IBEX 35 (IBC) = 8 751.80 EUR
Asia-Pacific
Hang Seng (HSI) = 23 493.39 HKD
Nikkei 225 (NI225) = 28 478.49 JPY
Oil
WTI oil (USOIL) = 78.85 USD
Brent oil (UKOIL) = 81.81 USD
Precious metals
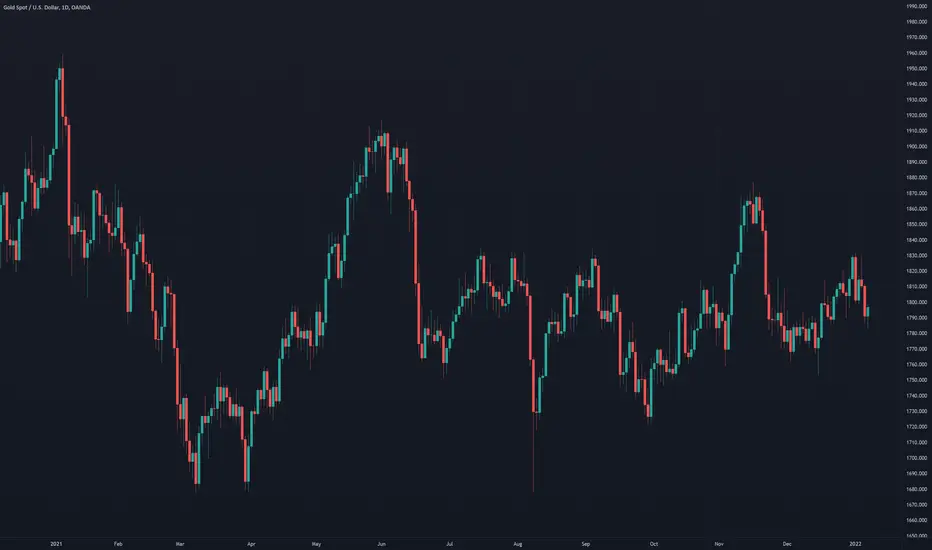
Gold (XAUUSD) = 1 796.635 USD
Silver (XAGUSD) = 22.3675 USD
Gold (XAUEUR) = 1 571.448 EUR
Silver (XAGEUR) = 19.68525 EUR
Gold Senior Miners (GDX) = 30.01 USD
Gold Junior Miners (GDJX) = 39.24 USD
DISCLAIMER: This analysis is not intended to encourage buying or selling of any particular securities. Furthermore, it should not serve as a basis for taking any trade action by an individual investor. This content serves merely educational purposes. Your own due diligence is highly advised before entering trade.
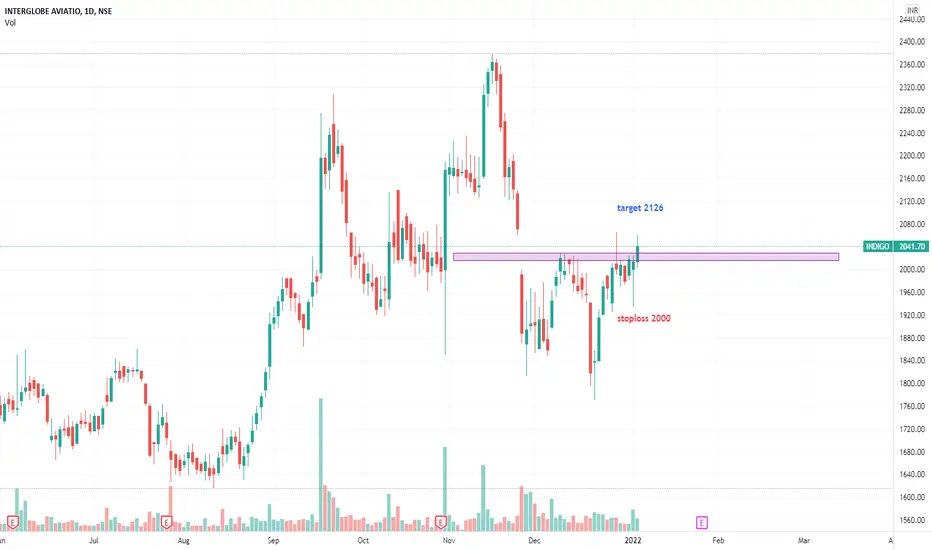
INDIGOIndigo broke out of its 40 days of resistance 2030 which got rejected multiple time.
Indigo comfortable broke above & closed above 2030 after mire than a month.
So indigo could be bought with mentioned stoploss & target.
Weekly Closing Bell (4th September 2021)This is weekly Closing Bell (previously Market Wrap). Here readers can view price of particular securities at market close ending week 3rd September 2021.
Commodities (3rd September 2021):
Gold (XAUUSD) – Close price = 1827 USD
Silver (XAGUSD) – Close price = 24.716 USD
WTI oil (USOIL) – Close price = 69.20 USD
Brent oil (UKOIL) – Close price = 72.42 USD
Forex (3rd September 2021):
EURUSD – Close price = 1.18782 USD
EURGBP – Close price = 0.85613 GBP
EURCAD – Close price = 1.48745 CAD
EURAUD – Close price = 1.59375 AUD
USDGBP – Close price = 0.72148 GBP
USDCAD – Close price = 1.25244 CAD
USDAUD – Close price = 1.3416 AUD
Indices (3rd September 2021):
Nasdaq (NDX) – Close price = 15652.86 USD
SP500 (SPX) – Close price = 4535.42 USD
DJIA (DJI) – Close price = 35369.10 USD
Russel 2000 (US2000) - Close price = 2282.45 USD
DAX30 (DAX) – Close price = 15781.200 EUR
HSI (HSI) - Close price = 25902.00 HKD
Disclaimer: This content is not market analysis. It only serves educational purpose.
ETHUSD 1D BEARISH FLAG PATTERN SHORT TRADEStep #1: Look for evidence of a prior bearish trend. For a valid bearish flag, you need to see a sharp decline.
Just because you can spot the bear flag pattern, doesn’t mean you have to jump straight into the market and trade it.
Remember, we need the right context and the right price structure needs to line up for a tradable bearish flag.
So, the first step is to identify the market trend prior to the flag price formation.
First, a valid bearish flag needs a sharp decline. This is strong evidence of a bearish trend and that the supply and demand is out of balance.
Note* The sharp move is also the Flagpole – the first element of the bearish flag structure.
Step #2: Identify the flag price formation. The price action needs to move in a narrow range between two parallel lines.
The flag price formation is the second element of the bear flag pattern.
Basically, all you need to do is to spot one support and one resistance level. It must contain the price action in a very narrow range.
The narrow range is key for the bear flag pattern success rate.
Step #3: Sell at the closing candle that generates the Flag Breakout.
After we identify the market trend and the characteristics of a good bearish flag pattern we need to wait for confirmation that the trend is about to resume.
There are two basic approaches to enter the market with the bear flag pattern. Aggressive traders will enter at the top of the bearish flag as this will secure a little bit of bigger profits.
If you’re a conservative trader you can wait for confirmation provided by the flag breakout.
Our team at TSG prefers to take the conservative approach and wait for a break and close below the bearish flag before executing the trade.
The bear flag chart pattern strategy only looks for trading opportunities when you get a breakout below the flag price structure to be a seller.
The next important thing we need to establish is where to place your protective stop loss.
It is important when looking at this type of strategy to keep everything in the context of the overall market. Too many traders will try to zoom on.
Step #4: Place the protective stop-loss slightly above the Flag.
The Rectangle chart pattern strategy gives you a simple way to quantify risk because you can place your protective stop-loss slightly above the flag price structure.
We’re accomplishing two things with our tight stop loss:
Small losses.
Higher risk to reward ratio.
With such a tight stop loss you’ll have the comfort of losing many trades in a row because with the amazing RR the bearish flag can potentially wipe out all your losses in a single trade and still come profitable.
The next logical thing we need to establish for the bear flag pattern strategy is where to take profits.
Step #5: Take Profit target equals the same price distance of the Flag pole measured down from the top of the bearish flag.
The textbook profit target is the height of the flag pole measured down from the top of the flag.
Our team at TSG has learned that the market likes this kind of price symmetries and we like to take advantage of it.
Note*** The above was an example of a SELL trade… Use the same rules – but in reverse – for a BUY trade, but this time we’re going to use the bullish flag, or bull flag.
