Comerica (NYSE: CMA) Reports First Quarter 2025 Earnings ResultsComerica Incorporated (NYSE: NYSE:CMA ), together with its subsidiaries, a company that provides financial services in the United States, Canada, and Mexico reported her first quarter 2025 earnings results today before the bell.
The results are available on the Investor Relations section of Comerica's website: c212.net
Technical Outlook
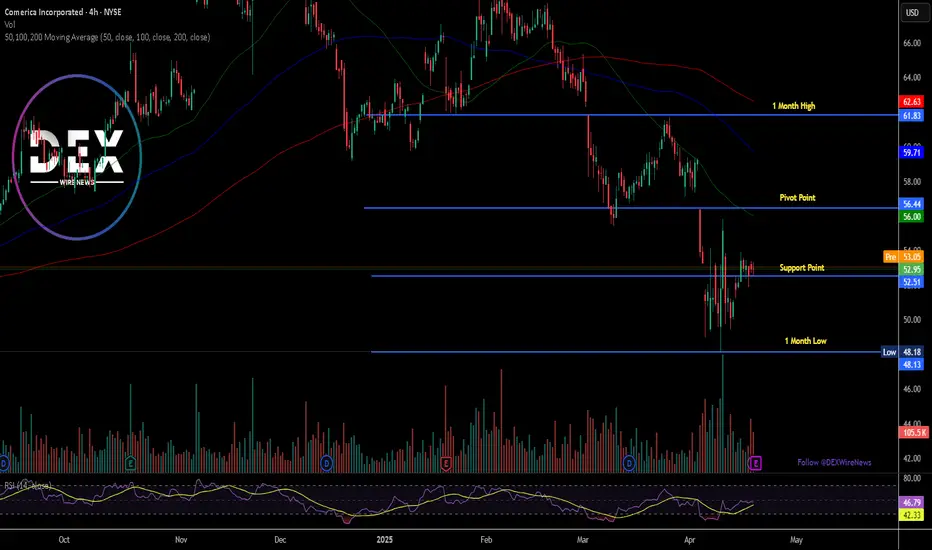
Prior the earnings, shares of Comerica Incorporated (NYSE: NYSE:CMA ) are up 1.28% in Monday's premarket session. The asset is trading in tandem with the support point of $52, a break above the 38.2% Fib level could set the pace for a bullish reversal albeit the stock was already consolidating as hinted by the RSI at 46.
Financial Performance
In 2024, Comerica's revenue was $3.20 billion, a decrease of -8.79% compared to the previous year's $3.50 billion. Earnings were $671.00 million, a decrease of -21.43%.
Analyst Forecast
According to 21 analysts, the average rating for CMA stock is "Hold." The 12-month stock price forecast is $67.43, which is an increase of 27.35% from the latest price.
Cmalong
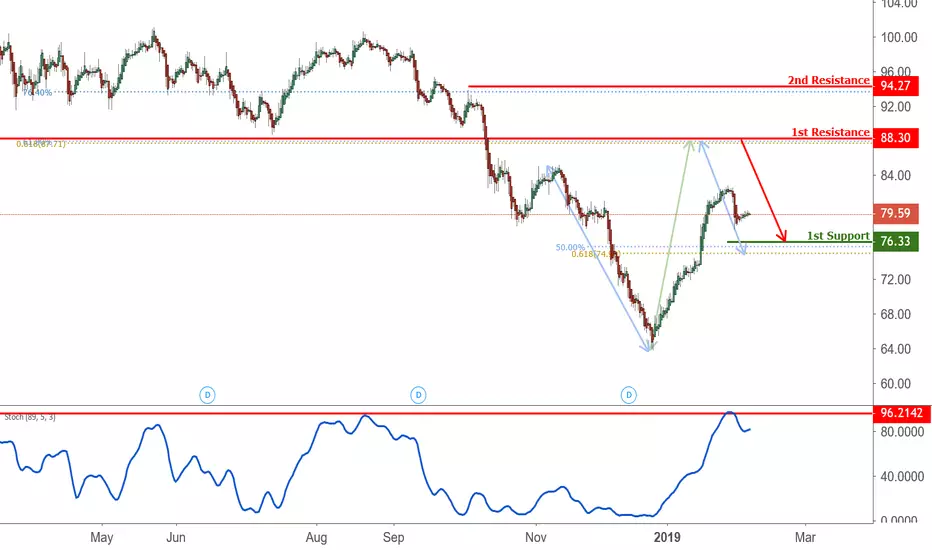
CMA is approaching resistnace, potential drop! CMA is approaching our first resistance at 88.30 (Horizontal pullback resistance, 61.8% Fiboancci extension, 61.8% Fibonacci retracement) where a strong drop might occur below this level pushing price down to our major support at 76.33 (50% fibonacci retracement, 61.8 %Fibonacci extension).
Stochastic (89,5,3) is also approaching resistance where we might see a corresponding drop in price.
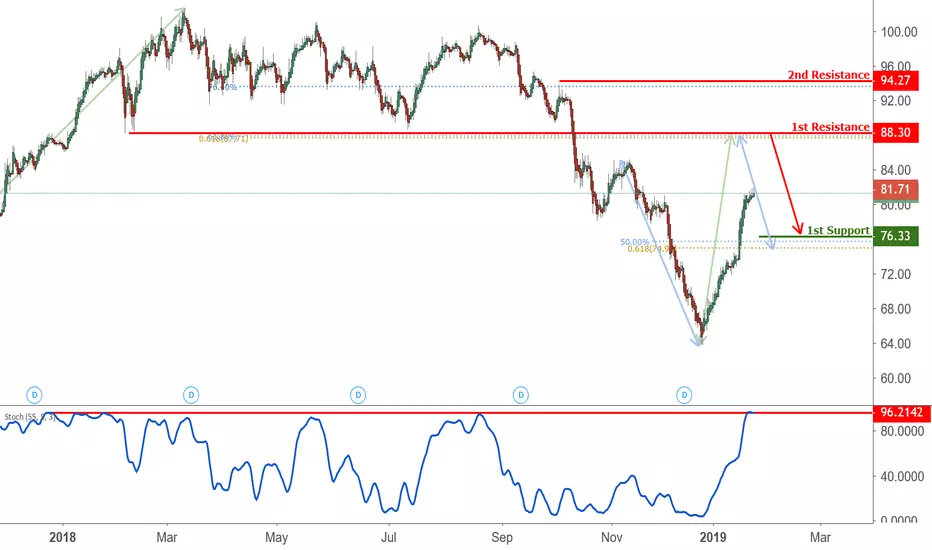
CMA Approaching resistance, potential drop! CMA is approaching our first resistance at 88.30 (horizontal pullback resistance, 50% Fibonacci retracement, 61.8% Fibonacci extension) where a strong drop might occur below this level pushing price down to our major support at 76.33 (50% Fibonacci retracement, 61.8% Fibonacci extension).
Stochastic (55,5,3) is also approaching resistance where we might see a corresponding drop in price.
CMA approaching resistance, potential drop! CMA is approaching our first resistance at 88.25 (horizontal pullback resistance, 61.8% Fibonacci extension, 61.8% Fibonacci retracement) where a strong drop might occur below this level pushing price down to our major support at 76.02 (horizontal swing low support 50% Fibonacci retracement).
RSI (55) is also approaching resistance where we might be seeing a drop below this level.
