BTC - More dump to comeAccording to Fixed Range Volume, the demand zone is $10,000 for BTC.
Many orders have been booked there. Lets see what the market gives us in the coming months.
We have a CME Gap at $9-10k(although CME gaps gets filled 60-80%), So far I have seen all CME gaps get filled 100%.
Cmegap
Bitcoin Weekly Analysis 📊 #BTCUSD (BTC)
💹 Time Frame : 1W (Log)
➖➖➖➖➖➖➖➖
🟡 ENGLISH : According to previous analysis, as we said, we needed to wait for the positive reaction to the BULLISH BREAKER BLOCK zone (in the range of $ 14850 to $ 19500) . The price reacted positively to this high-potential range of demand. Note that this upward movement will still need to consolidate and will not be a 100% sign of an uptrend (Bullish Trend) , Because macroeconomic factors show the opposite. With an optimistic view and if the price consolidates above this price range, we can expect growth to eventually reach $ 29,000 and then continue to fall ...!
⚠ This Analysis will be updated!!
➖➖➖➖➖➖➖➖
👤 Trader_Needs
📅 06.222.2022
⚠️ (DYOR)

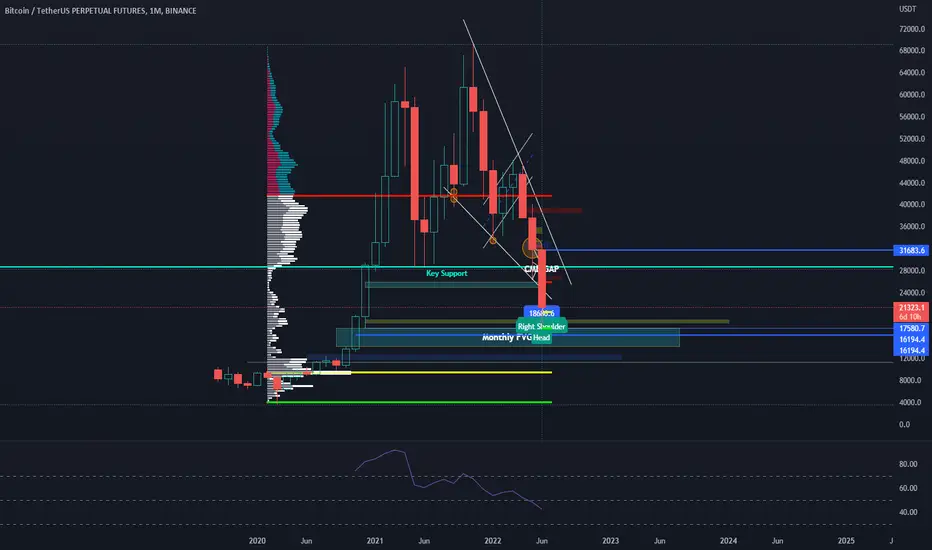
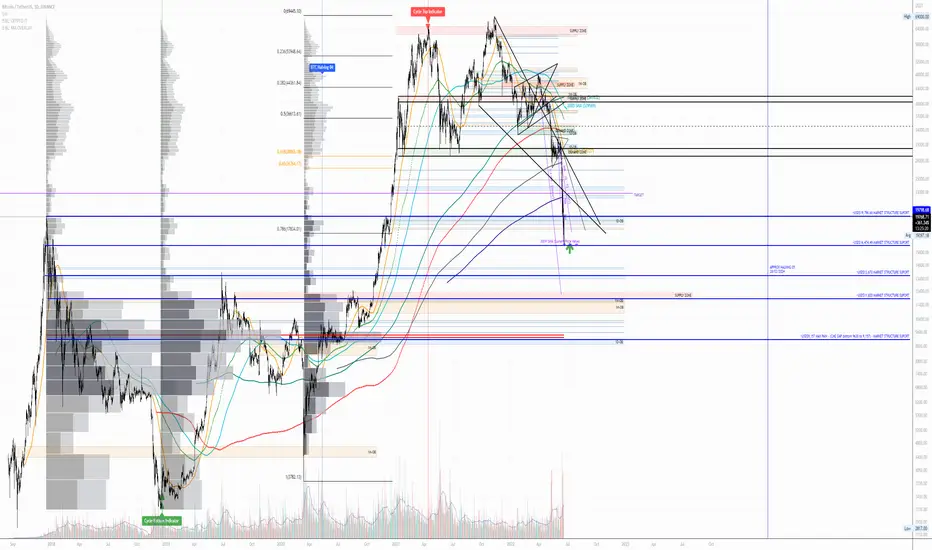
BTC Cycle Bottom - Bearish Liquidation Scenario ConsiderationsHi All,
I thought I would do a quick post this Sunday night I have been meaning to do for the last week or so to cover the bearish scenarios and max possible bearish scenarios I think may be possible for BTC current thinking is proven incorrect.
My current thought process for a potential new cycle bottom for BTC follows my reasoning in the below charts. Will be fun to see how wrong or right this is as we track close to activating the CBI (Cycle Bottom Indicator).
The above providing invalid with the LOG support lines and we do not hold the 300W SMA levels; the risk in the market as I see it for Btc is with the significant leveraged positions whales will find it hard to resist not to target.
See some FUD on this topic below.
fortune.com
If liquidation levels are hit, I do expect volatility and may see some COVID / may 2021 price action volatility.
This would provide an amazing opportunity for Whales (and the like) to scope up some BTC at high volumes and low slippage on exchanges.
However, such volatilities will make it hard to know at what price range the next accumulation range will sit over the short run.
For this scenario, BTC will be historically in uncharted waters in terms of where it has been on many metrics in terms of over sold. We have no other inputs at these low levels to go by other the confluence of TA and market structure.
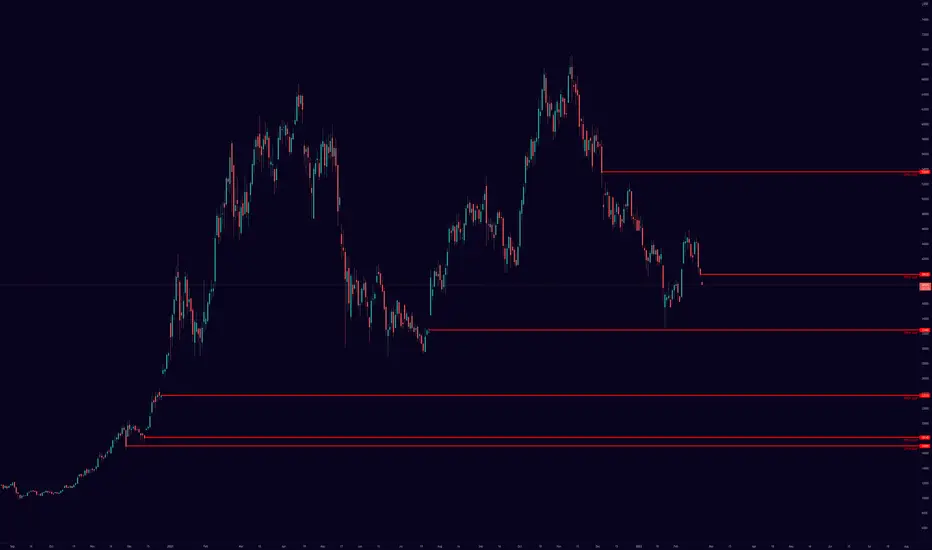
The chart in this post looks at market structure, Order Block Support over the Daily (Blue), Weekly (Orange) and Monthly (Orange), and Fixed Range Volume Profile (FRVP) from the COVID bottom, Cycle bottom and our 2017 ATH (All Time High) , and the FIB from the COVID bottom to our Cycle ATH (on the log chart settings for price).
I have done this analysis on the BINANCE BTC UTC chart as this has very good volume representation of the market.
Key Confluence levels which may hold up as support in a liquidation panic dump are shown in Navy Blue
* ~USD$19,798.68 MARKET STRUCTURE SUPORT
* ~USD$16,474.49 MARKET STRUCTURE SUPORT
* ~USD$13,670 MARKET STRUCTURE SUPORT
* ~USD$11,820 MARKET STRUCTURE SUPORT
* ~USD$9,157 MAX PAIN - (CME GAP bottom 9630 to 9,157) - MARKET STRUCTURE SUPORT
MAX PAIN levels would close the CME GAP at the ~$9,630 levels. GAP Boys from 2020 may finally be happy if big money can push markets down to these levels (would be a crazy ride).
See below chart for a supporting post explaining CME BTC Futures GAPS
NOTE: FRVP represents the volume of traded BTC for the horizontal price over the selected range. The longer the gray bar, the more volume traded at that price level over the selected range. Price generally respect levels of high FRVP.
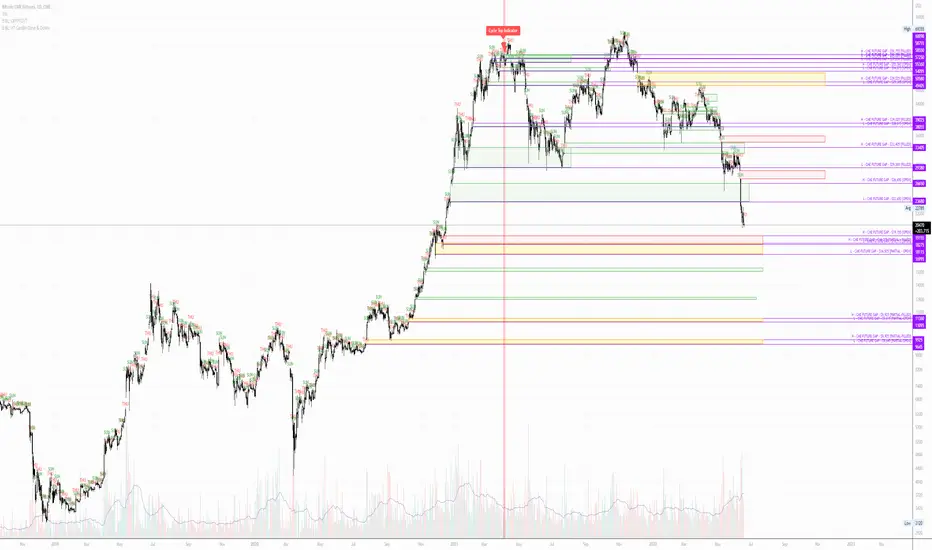
CME Future GAPThis chart has been developed for use in supplement posts.
CME chart reflects the futures treading for BTC derivatives (see link before for more information).
www.cmegroup.com
CME Futures allowed a lot of investors money to now short the asset.
CME Futures like other 'traditional' assets close their markets over the weekend and operate Monday to Friday (Shown as Thursday to Sunday corresponding to my Time Frame in Australia).
A 'CME GAP' for the purposes of this post refers to the 'GAP' which often forms with the Friday close and Monday open price of CME Futures, due to BTC (like other cryptocurrencies) continuing to trade over the weekend.
'Big Money' in Futures Markets are 'Speculated' to drive the BTC price to cover positions when big gaps form at the Monday Close.
In this post, we referee to a GAP being closed when the price of BTC drops through the gap price, allowing these positions to be 'closed' at break even if large short positions have been created and the price rises.
See below Legend with reference with this chart:
* Red Rectangle: CME GAP yet to be closed
* Yellow Rectangle: CME GAP partially closed
* Green Rectangle: CME GAP closed
Historically, since CME BTC Futures began operations around the time of BTC 2017 bull top in in December 2017, all CME GAPs have been close.
This has held true up until the 2021 Bull run where CME gaps post July have left many only partially filled and some open.
The questions now as BTC searches for a new bottom and big money are hunting over leveraged positions and pools of liquidity is will these gaps have their day and fully fill or will btc leave these gaps partially filled for ever and we will not see BTC at these prices again?
Significant CME gap close prices awaiting to be closed:
* July 2020 - ~USD$9,615
* October 2020 ~USD$11,110
* October 2020 ~USD$11,110
* November 2020 ~USD$16,925
* December 2020 ~USD$18,020
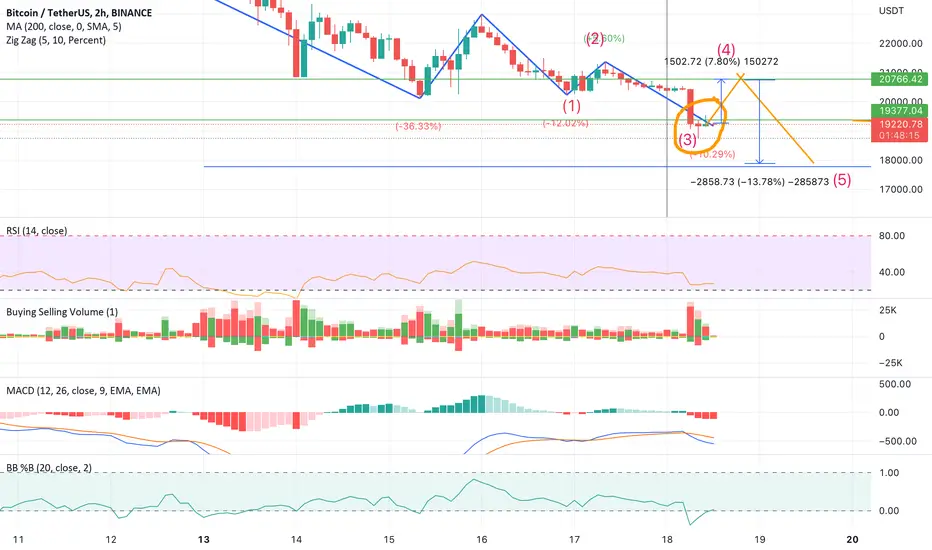
BTC short term agenda Bullish Engulfing confirmed on 2h timegrame
CME gap between 19,4k - 18.5 almost filled
MACD trend changed to bulish
BB median movement changed to bulish
3rd Elliot wave down completed
Going for 4th, which is a small ride till 20,7k (8%)
Enjoy it :)
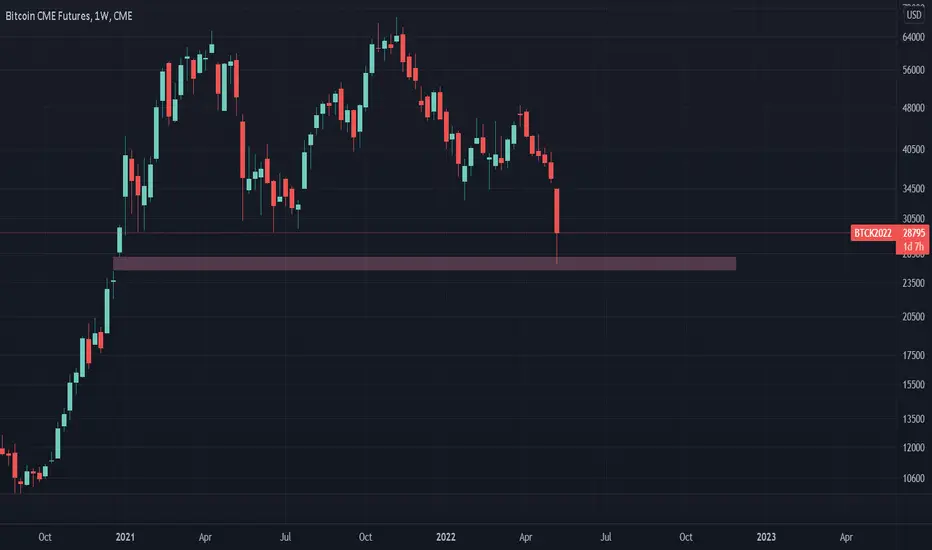
BITCOIN CME Futures Gap ($9600 / $9300)Stage 4 in progress atm.
Now we're reaching 2017 Dec. ATH.
Never the less keep in mind that BTC Futures gap.
Don't get me wrong guys. What I really want is a BTC pump and not this.
Never fight against markets. Follow the 🔴 🟢


CME gap 9 may 2022Hello friends.
are you okay?
thanks god...
because crypto market open green in monday we can still see it bullish for mid time.
and we have some factors that show this opinion and strenghen our analyze
lets look at them :
1-we can see two important levels of fibo retracement around CME gap.
these levels are 38.2% and 61.8%.
so we have an overlap area here.
2-we have a gap in CME from 9 may 2022.
because of weak momentum market couldnt fill it until now.
but if we breakout this pattern that i illustrate in chart we can fill it!
3-we have an old trendline that can be act as an resistance level there.
4-moving average 55 is here just around levels that cme gap occured.
5-and in the end i see increase in volumes in lower levels of this pattern
and it could be showing that we have good supports in this levels.
.
.
.
dont forget to manage your capital and risk.
.
.
.
if you take a trade you must set a good stoploss.
(NOTE!!! this article is my own opinion and its not a trade advice.
please tarde on your own opinion and use others opinion to improve your
analyze.)
.
.
.
so i will do that.please support me and i wish use your experience
and you can help me to improve my abilities.
thank you all.have good days.

BTCUSDT(Will fill the CME gap?)HEY GUYS what do you think about bitcoin ? Are you bearish on it?
If this post was useful to you, do not forget to like and comment.❤️
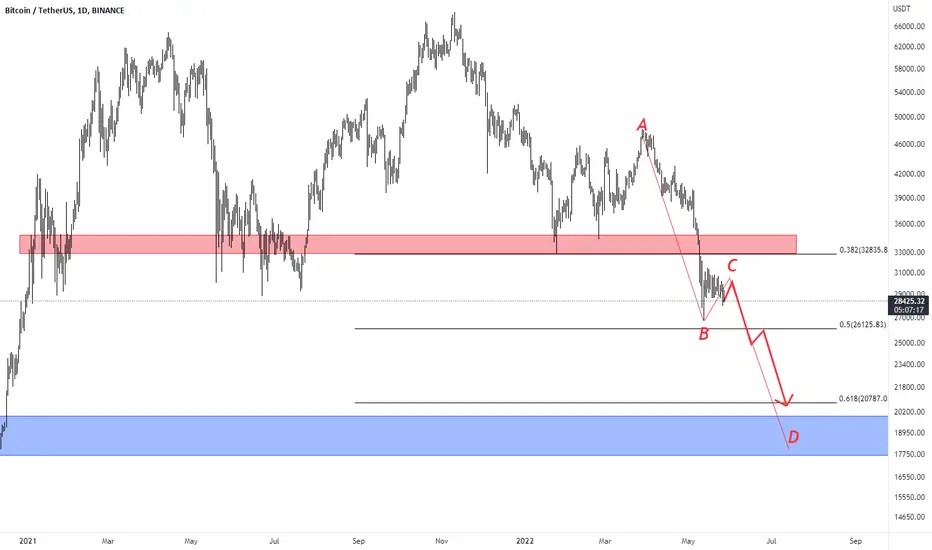
The Last Stand for Bitcoin📆🟡 BTC/USDT (BITCOIN)
📊 Time Frame: 4H
➖➖➖➖➖➖➖➖➖➖➖➖
Bitcoin is trying to hold the last local support at 3000$ and I think finally it will be break. Bitcoin needs to hold above 34000$ then we can see a movement to 39000$ (IN ORDER TO GATHERING LIQUIDITY).Lots of longs liquidated below 33000$ and many Stop Loss already hit. Now there are many sorters in the market and liquidity is around 35000$ and also CME gap is at 35000$. So I expect price to pump around 35K$ in next few days. Not even single good news affect on bitcoin price positively because of global tension in the market.

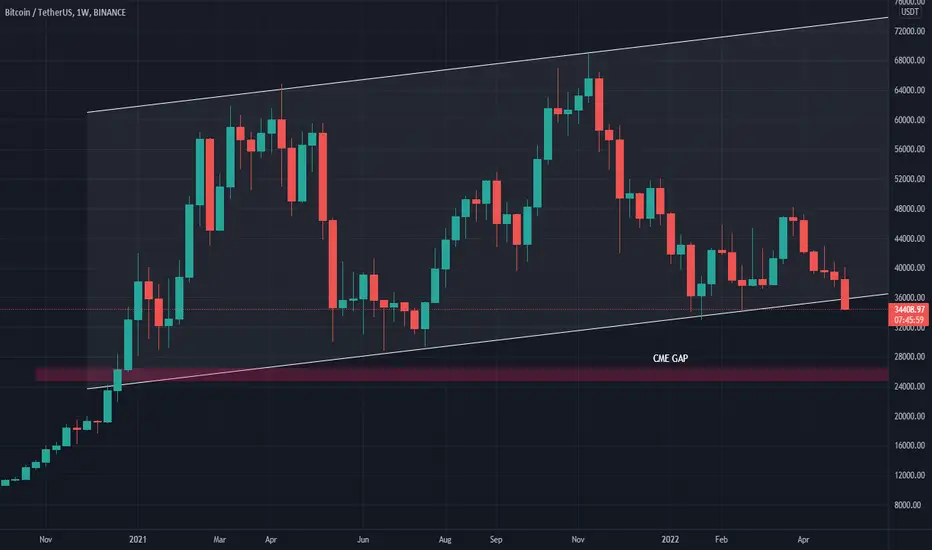
!!! $BTC LOSING THE SUPPORT TRENDLINE! - CME GAP NEXT? !!!price action has been shit lately
bitcoin is losing the lower channel of the parallel channel it had been forming since the start of 2021 on the weekly timeframe, which has been a big support in the past weeks
if the breakout is confirmed and we close this 1W candle (only 8 hours to go) below that, I think we might see a bear market for the next few weeks
rsi is about 32 on the 1D timeframe and 38 on the 1W timeframe, which shows us we have a lot of room for a huge fall to the downside
I think the price is going to fill the CME gap @ 26K which I highlighted on the chart, it would be a huge drop, but I think that's what's going to happen since CME gap are almost always filled and this one has been waiting to get filled since December 2020
let me know what you think about this! and drop a like and follow if you enjoyed this idea or you found it helpful!
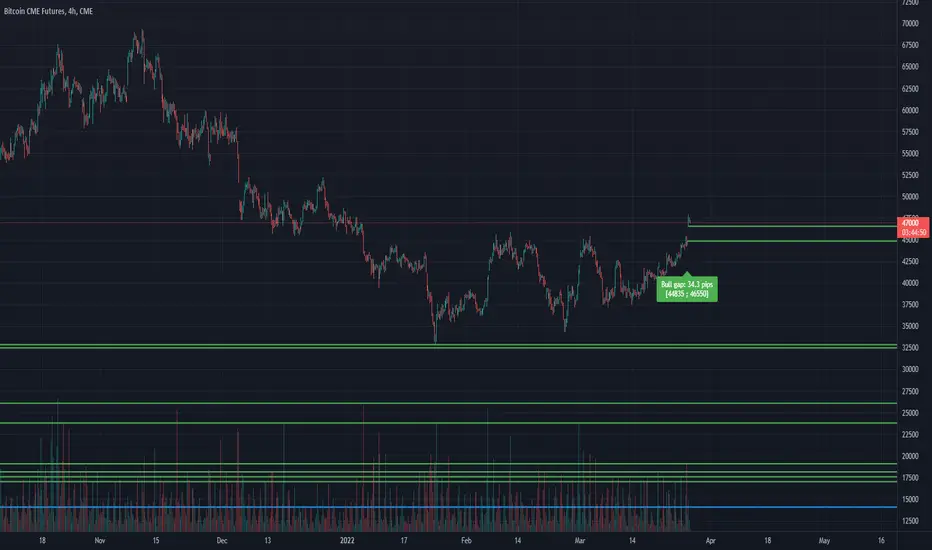
Filling CME Gap at 45K- Bearish for BITCOIN for whileThe Bitcoin CME gap, also called the “CME gap” for short, is the difference between the trading price of Bitcoin futures contracts when the market opens on Sunday, and when it closes on Friday. Unlike cryptocurrencies, traditional assets do not trade 24/7 around the clock. Most traditional exchanges follow normal working hours and close on holidays, and the CME is no exception to this!
While you can trade on Binance for example at any given time, the CME Bitcoin futures trading opens from Sunday evening until Friday evening (Central Time). From Friday to Sunday, the Bitcoin CME futures price is “fixed”, while Bitcoin’s price continues to move up (or down) on cryptocurrency spot exchanges. When the CME futures re-open, futures contracts catch up with spot prices, creating a gap!
Bitcoin CME gaps have often been known to “fill” .
Previously and normally all CME gaps has been filled, check CME gaps before in the graph. Now in March 28, we have a gap in 45K $ area and we saw a valid bearish divergence in 1hr TF. This shows that both signals is already confluence and might happen anytime soon to "FILL THE CME GAP". Using the FIB, retracement can be at 0.5 or 0.618 before the bullish trend in higher TF continues.
Please use this as a guide only and make your own Technical Analysis.

BTC - Bitcoin - BTC1 - CMEGaps - 28.03.2022Here is the current status of all CME Gaps
There are still a lot to go, lets see how fast we close the lower gap
March 11, 2022 CME GapI'm going to post these gaps up every weekend once the CME has closed.
As a trader, this is something you should consider in your TA. Be very careful of fake-outs as often times the price will get very close to the CME gap and then reverse and grab several percentage worth of liquidity before it it finally does fill the gap.

CME GAPBTC rallying to fill the CME GAP around 39k zone. if we get rejected again slight below the resistance close to thee CME gap zone, its another opportunity to short BTC. Watch out! #ReNLoG
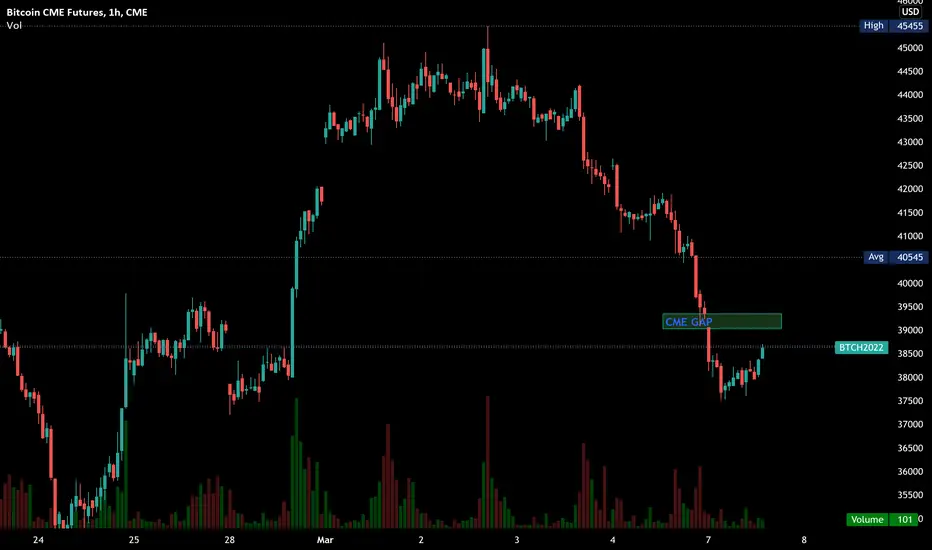
BTC - Bitcoin - BTC1 - CMEGap - 06.03.2022Current status, there is a micro 30$ gap on Monday morning.
Lets see how fast it get closed again, down are a lot that need to get closed ;)
BTC - Bitcoin - BTC1 - CME Gap - 02.03.2023I think I forgot to make current status .
So here we go after close of upper gap from last week
Looks like great Bart down :)

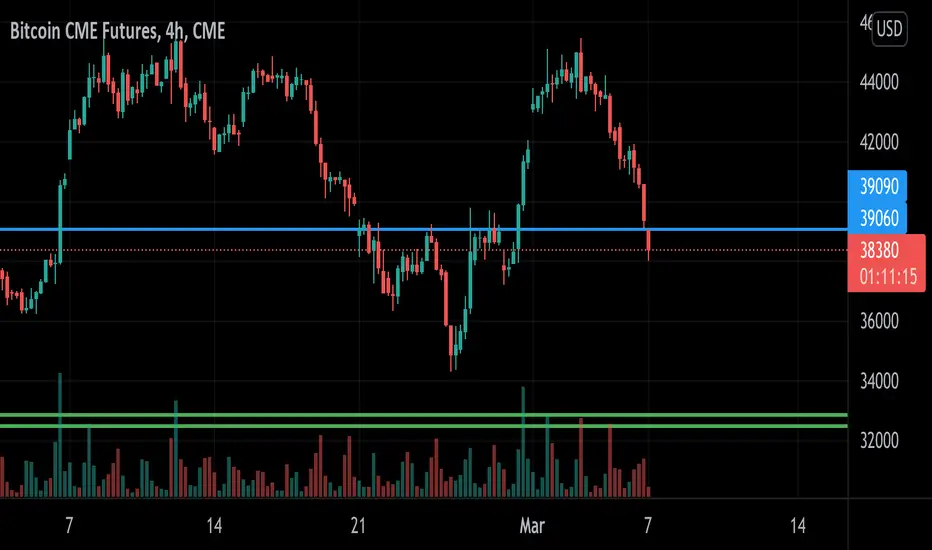
BTC - Bitcoin - BTC1 - CME Gaps - 28.02.2022Here is the current status on Monday open
We still have. Microgap from last week and a new one from this weekend
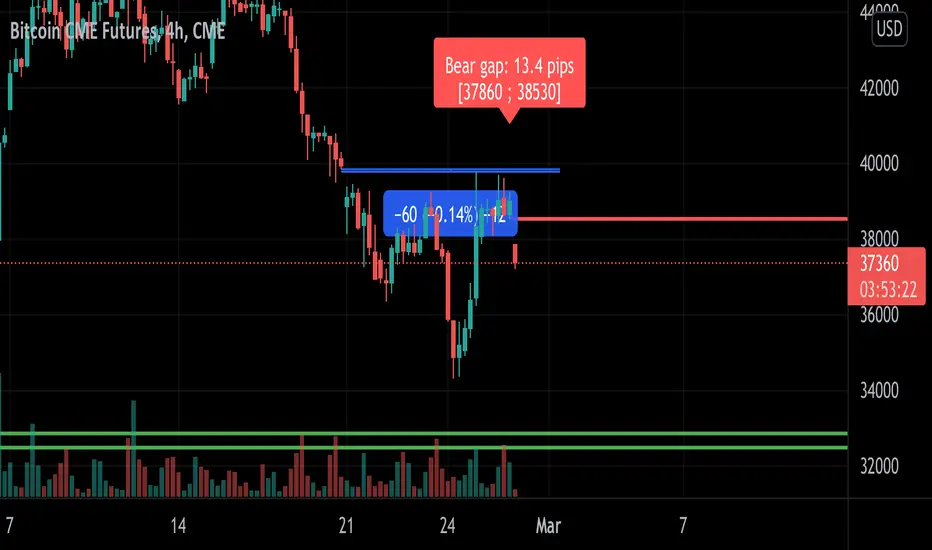
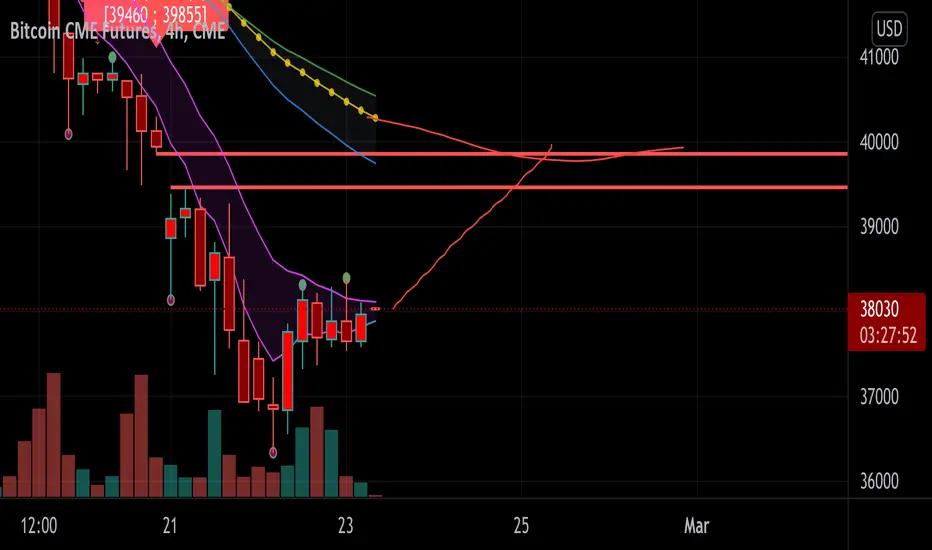
BTC - Bitcoin - BTC1 - CMEGaps - 21.02.2022Here is the current state of all open CME Gaps.
Lets see how fast we close the upper Gap.
;)

BTC - BTC1 - Bitcoin - CMEGapI think this is the current way of bitcoin
Lets see if we close the gap today or tomorrow
CME Gaps still untouchedIn this CME chart I've outlined all the gaps that we haven't filled during this bull run. If you feel I missed any or have any corrections please don't hesitate to comment or PM me.
$BTC CME GAP Update In H4$BTC CME GAP Update
As We Can See In The Chart Above,
It's Finally Filled The CME Gap (40935$ - 41420$) In 4 Hour Chart 📊....
Now,
$40K Is The Key Level,
So,
Keep Eyes On It 👀
