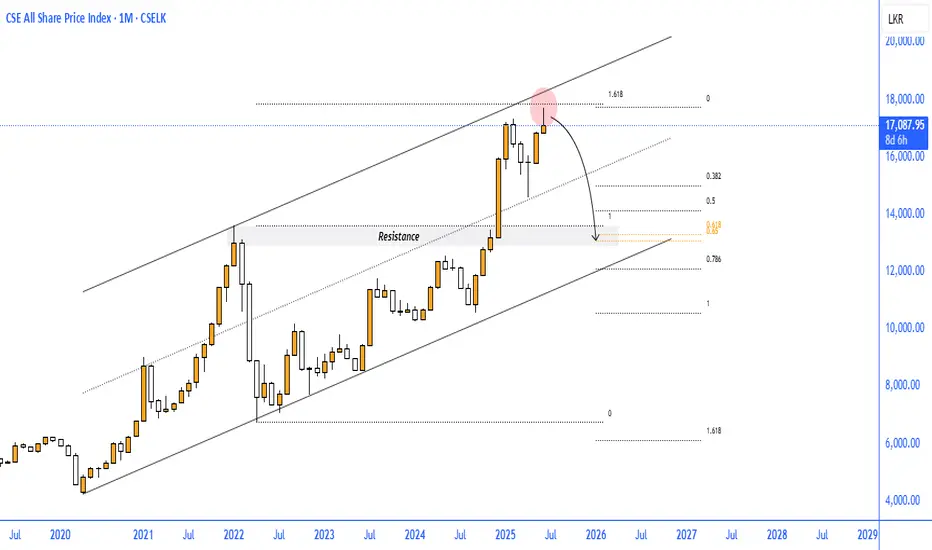
CSE ASI BEARISH SETUPThe monthly chart of the CSE All Share Price Index (ASI) reveals a technically significant scenario: the index is currently testing the upper boundary of a long-term ascending channel while also aligning with the 1.618 Fibonacci extension, both of which signal potential reversal pressure ahead.
Key Observations:
Long-Term Resistance: The price is testing the channel’s upper resistance line near the 17,000 – 17,700 zone, where rejection often occurs historically.
Fibonacci Confluence: The current high coincides with the 1.618 Fibonacci extension, a critical level where long rallies often stall or reverse.
Bearish Candlestick Pattern: The formation of a potential bearish reversal candle near the resistance zone is an early signal of seller interest.
Expected Retracement Levels:
Initial support lies at the 0.382 and 0.5 Fibonacci retracement zones, around 15,000 – 14,000.
Deeper correction could target the 0.618 level (~13,000), which aligns with previous breakout structure and the channel midline.
Conclusion:
The ASI appears overextended after a strong bullish leg and is currently showing signs of exhaustion at the top of a multi-year channel. Unless price breaks above and sustains above 17,700, a correction toward the 13,000–14,000 zone is likely, supported by Fibonacci retracement levels and the channel structure.
This presents a potential medium-term bearish outlook for investors and swing traders, with caution advised around current highs.
Colombostockexchange
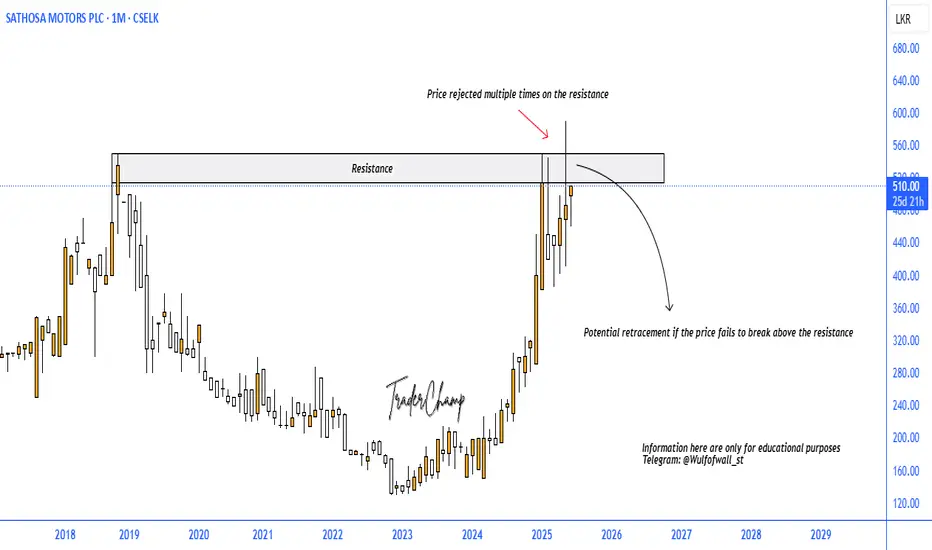
SMOT BEARISH SETUPWe have witnessed a major resistance zone under the monthly timeframe with multiple price rejections formed close to this area. We are expecting a retracement next, if the price remains unbreakable above the highlighted zone.
CHL BULLISH SETUPBreakout on the weekly trend hints us a potential rally laddering up towards the 138-148 region

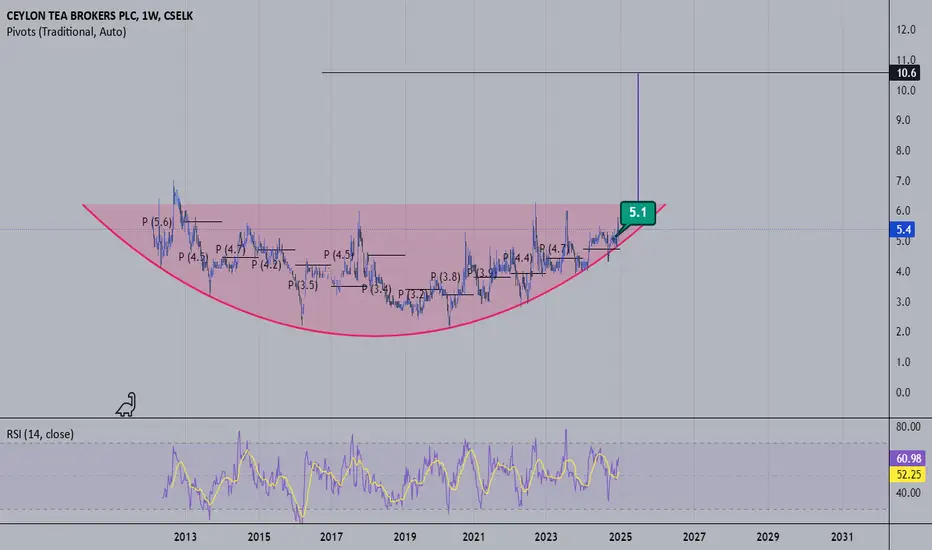
Celon Tea brokers is ready to goYou can see the frypan formation in the chart for Ceylon tea brokers. When the frypan breaks the chart price can reach the level I mention in the black line. So keep watching this chart and try to gain from it.