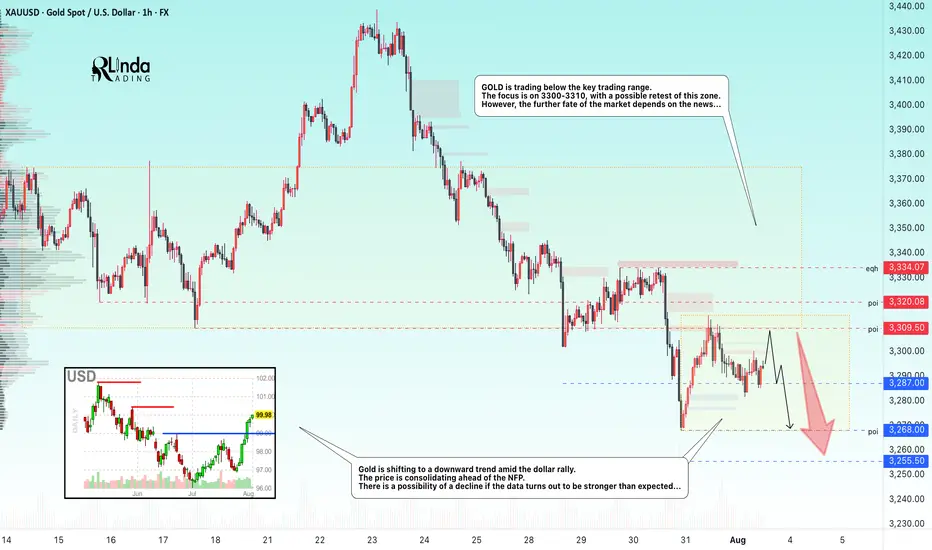
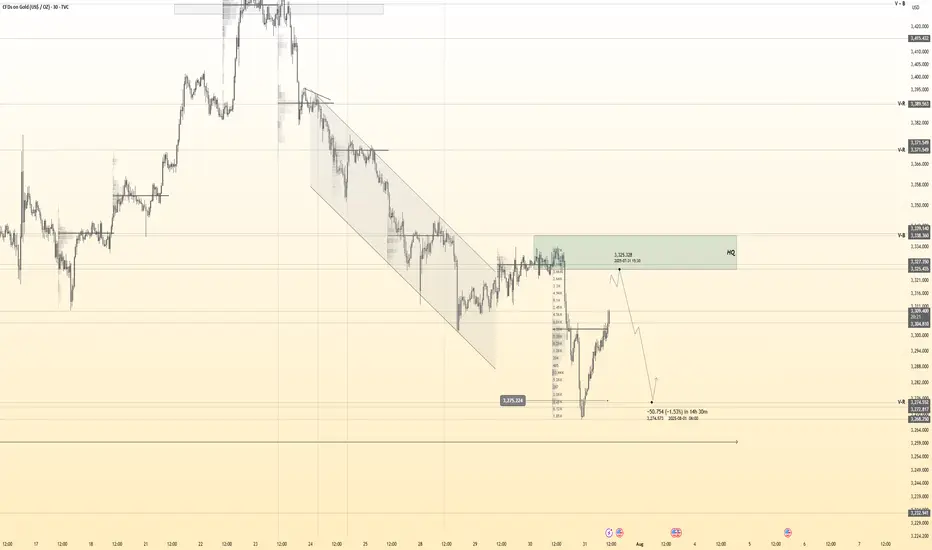
GOLD → The market is waiting for NFP. What could happen?FX:XAUUSD is bouncing off resistance at 3310, confirming the upper limit of the new trading range. The dollar continues to rally, but the market as a whole is stagnating ahead of upcoming news—NFP is coming up!
Gold is consolidating at monthly lows around $3268, awaiting key US labor market data (NFP). Trump's new tariffs (10% globally, 35% for Canada, 39% for Switzerland) have boosted demand for the dollar, putting pressure on gold. Markets are waiting for NFP: forecast +110K jobs, unemployment 4.2%. Weak data (<100K) → gold may rise to $3400. Strong (>150K) → the dollar will strengthen, gold will continue to fall. The probability of a Fed rate cut in September is <50%.
Based on yesterday's data, I would cautiously suggest that NFP will be in the range of 125K–145K, slightly above the consensus (110K). This will play into Trump's hands (I think you understand what I mean...).
Resistance levels: 3300, 3310, 3320
Support levels: 3287, 3268, 3255
The news has a negative nuance — unpredictability. Be careful.
Technically, based on the data we have at the moment, I would assume that the market may test resistance at 3300-3310 before a possible pullback to the specified support. BUT! Unpredictable data could turn the game around, and in that case, if the dollar falls, gold could start to rise.
Best regards, R. Linda!
Commodities
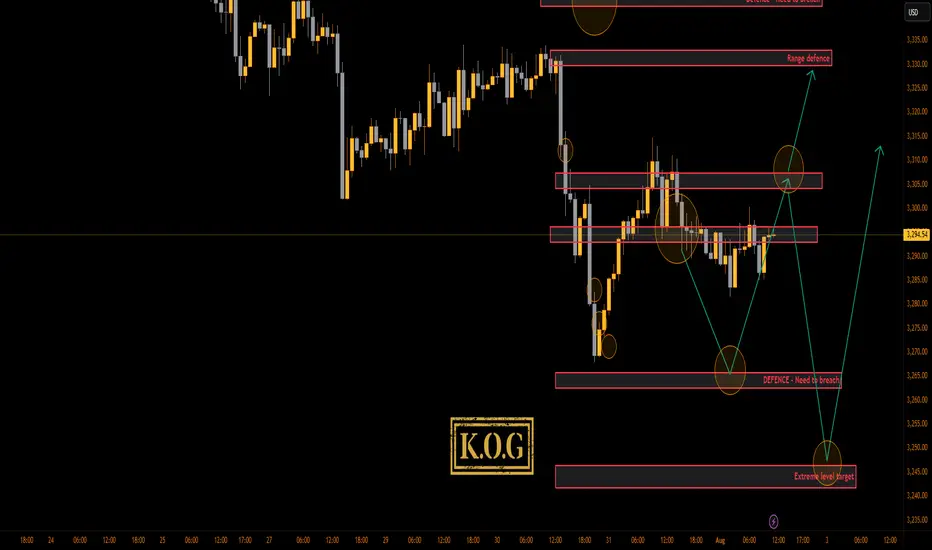
THE KOG REPORT - NFPTHE KOG REPORT – NFP
This is our view for NFP, please do your own research and analysis to make an informed decision on the markets. It is not recommended you try to trade the event if you have less than 6 months trading experience and have a trusted risk strategy in place. The markets are extremely volatile, and these events can cause aggressive swings in price.
Following on from the FOMC KOG Report which worked quite well, we’ll stick with the same chart and for today suggest caution. It’s the first day of the month and the last day of the weekly candle. The close here for gold is important and will give us further clues to the next few months.
We’ve shared the red boxes and the red box targets are below. There is a key level above 3306-10 which will need to be breached to correct the move back up to the 3330-34 region for the weekly close. However, we now have an undercut low which is potential if there is more aggressive downside to come and that level is sitting around the 3240-50 region which for us may represent an opportunity for a swing low. We’re a bit low and stretched here to short and as we’ve already hit our target for the day so we’ll wait for the extreme levels and if hit and our indicators line up, we may take some scalps. Otherwise, as usual on these events, the ideal trade will come next week.
RED BOXES:
Break above 3290 for 3295, 3306, 3310 and 3320 in extension of the move
Break below 3275 for 3267, 3260, 3255 and 3250 in extension of the move
Please do support us by hitting the like button, leaving a comment, and giving us a follow. We’ve been doing this for a long time now providing traders with in-depth free analysis on Gold, so your likes and comments are very much appreciated.
As always, trade safe.
KOG
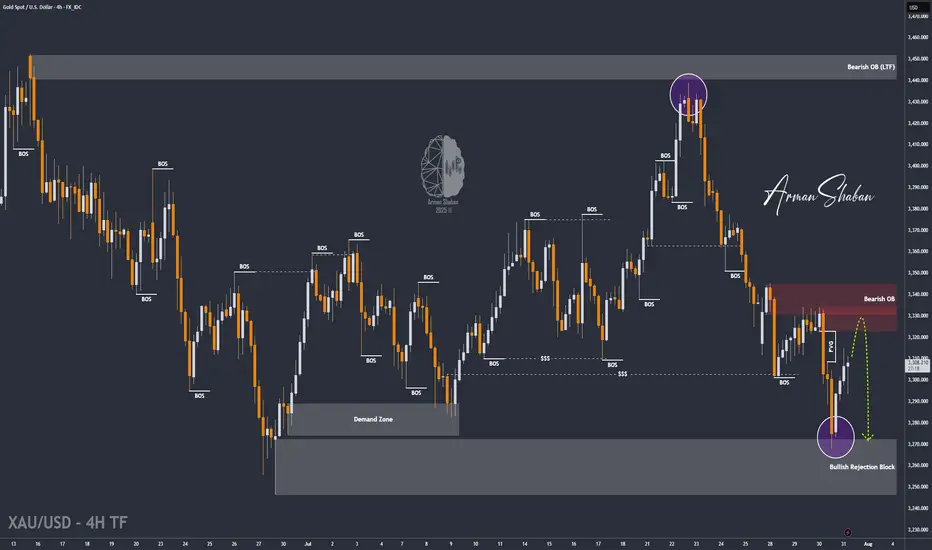
XAU/USD | Next Key Zone: Watch for Rejection at $3334! (READ)By analyzing the gold chart on the 4-hour timeframe, we can see that, just as expected, the price dropped from $3310 to $3288 in the first leg, where it hit a demand zone and bounced up to $3305, delivering a 170-pip rally. The main bearish move from $3333 to $3288 yielded 450 pips, bringing the total return on this analysis to over 620 pips!
In the second phase, gold dropped sharply again to $3268, and once more found demand, currently trading around $3307. If the price holds above $3294, we could expect further upside toward the $3322–$3334 zone. Once gold reaches this area, a strong bearish rejection is likely, with a potential return of 250 to 400 pips.
All key supply and demand levels are marked on the chart — make sure to monitor them closely and study the chart in detail. Hope you’ve made the most of this powerful analysis!
Please support me with your likes and comments to motivate me to share more analysis with you and share your opinion about the possible trend of this chart with me !
Best Regards , Arman Shaban
Gold 30Min Engaged ( Bearish Reversal Entry Detected )Time Frame: 30-Minute Warfare
Entry Protocol: Only after volume-verified breakout
🩸Bearish Reversal - 3325
➗ Hanzo Protocol: Volume-Tiered Entry Authority
➕ Zone Activated: Dynamic market pressure detected.
The level isn’t just price — it’s a memory of where they moved size.
Volume is rising beneath the surface — not noise, but preparation.
🔥 Tactical Note:
We wait for the energy signature — when volume betrays intention.
The trap gets set. The weak follow. We execute.
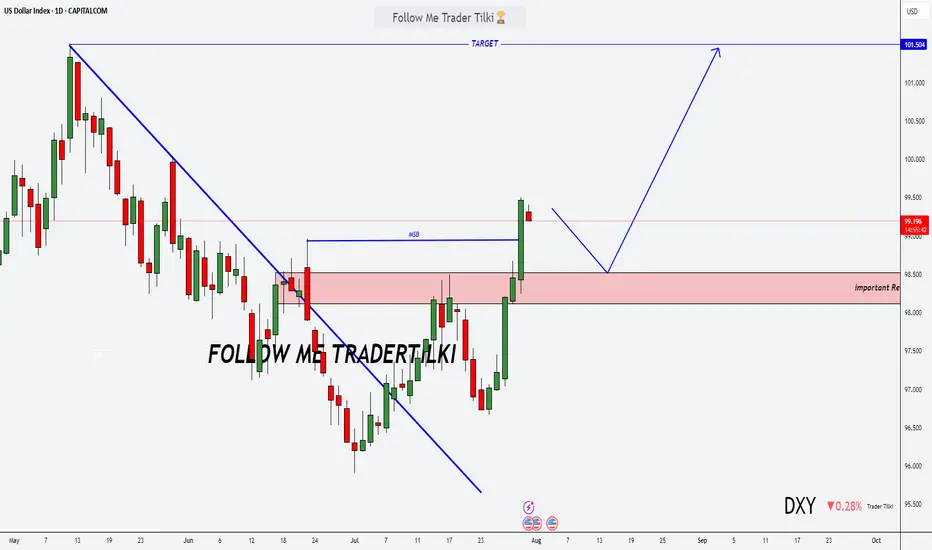
DXY Just Broke Through the Lock… Where’s the Market Headed Now?🌅 Good Morning, Friends!
A few days ago, I marked 98.950 as a key threshold for the DXY index. As of today, that level has officially been broken—and the bullish momentum we anticipated is now kicking in. 📈
The next target? 101.000.
That said, it’s crucial to remember: DXY is heavily influenced by fundamental data. Stay alert and keep a close eye on key economic developments—they’re essential for navigating this move.
This breakout validates the analysis I shared with you all. And it wasn’t just about charts—it was about discipline, precision, and timing.
Every single like from you is a huge boost to my motivation. Thanks from the heart—your support drives me to keep sharing these insights! 💙
GOLD ROUTE MAP UPDATEHey Everyone,
What a PIPTASTIC finish to the week! 🚀. We tracked the move down with precision durung the week and then rode the momentum right back up.
Yesterday, we confirmed the swing range activation and bounce, and that bullish follow through carried beautifully into today, completing our Bullish Target at 3348. Just perfect execution all around.
BULLISH TARGET
3348 - DONE
BEARISH TARGETS
3328 - DONE
EMA5 CROSS AND LOCK BELOW 3328 WILL OPEN THE FOLLOWING BEARISH TARGET
3305 - DONE
EMA5 CROSS AND LOCK BELOW 3305 WILL OPEN THE SWING RANGE
3289 - DONE
3267 - DONE
We will now come back Sunday with a full multi timeframe analysis to prepare for next week’s setups, including updated views on the higher timeframes, EMA alignments, and structure expectations going forward.
Thanks again for all your likes, comments, and follows.
Wishing you all a fantastic weekend!!
Mr Gold
GoldViewFX
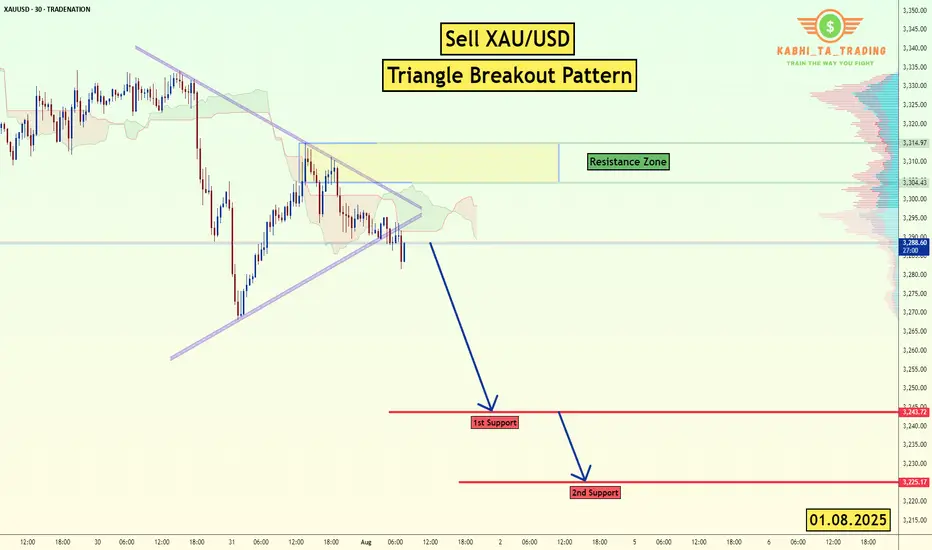
XAU/USD (Gold) - Triangle Breakout (1.08.2025)The XAU/USD Pair on the M30 timeframe presents a Potential Selling Opportunity due to a recent Formation of a Triangle Breakout Pattern. This suggests a shift in momentum towards the downside in the coming hours.
Possible Short Trade:
Entry: Consider Entering A Short Position around Trendline Of The Pattern.
Target Levels:
1st Support – 3249
2nd Support – 3225
🎁 Please hit the like button and
🎁 Leave a comment to support for My Post !
Your likes and comments are incredibly motivating and will encourage me to share more analysis with you.
Best Regards, KABHI_TA_TRADING
Thank you.
Disclosure: I am part of Trade Nation's Influencer program and receive a monthly fee for using their TradingView charts in my analysis.
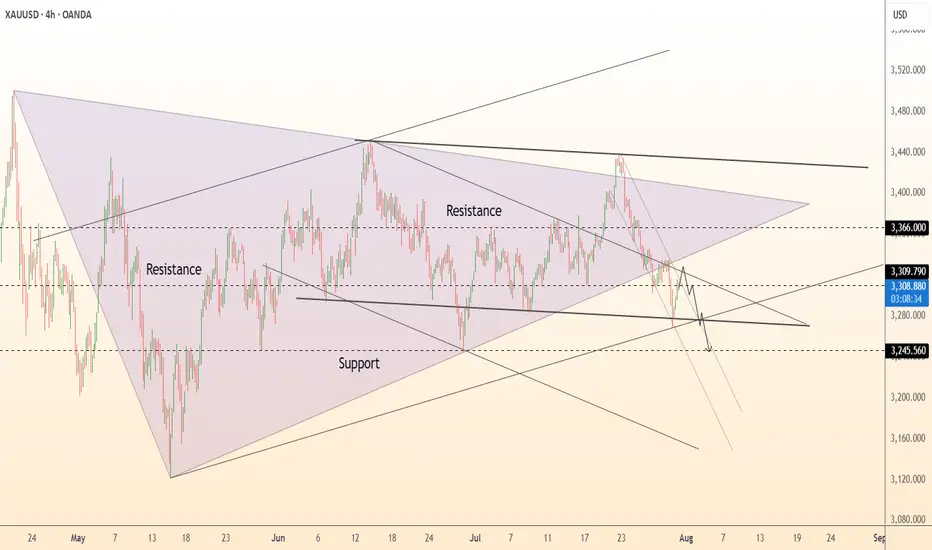
DeGRAM | GOLD fixed below the triangle📊 Technical Analysis
● XAUUSD is forming a bearish descending wedge within a broader symmetrical triangle, facing rejection at 3,310 near prior support-turned-resistance.
● Repeated failure to hold above trendlines and continued lower highs favor a drop toward the 3,246.56 level, with possible overshoot if support breaks.
💡 Fundamental Analysis
● Rising real yields and hawkish Fed tone continue to pressure gold; ISM Manufacturing Prices and NFP loom as next volatility catalysts.
● Reduced ETF inflows and strong dollar on resilient US macro data weigh on demand for non-yielding assets.
✨ Summary
Short bias below 3,310. Breakdown eyes 3,246 → 3,200 zone. Resistance holds while trendline caps recovery.
-------------------
Share your opinion in the comments and support the idea with a like. Thanks for your support!
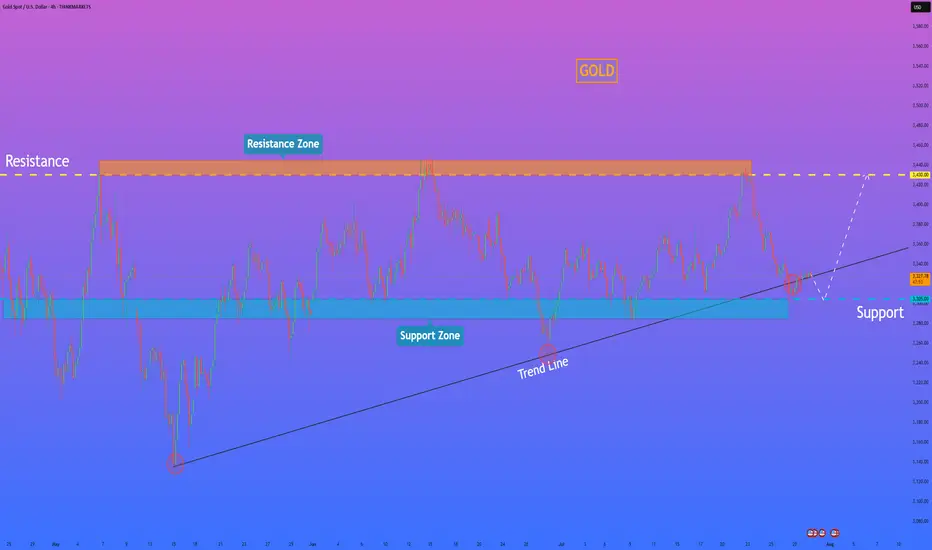
GOLD - Price can fall to support level and then start to riseHi guys, this is my overview for XAUUSD, feel free to check it and write your feedback in comments👊
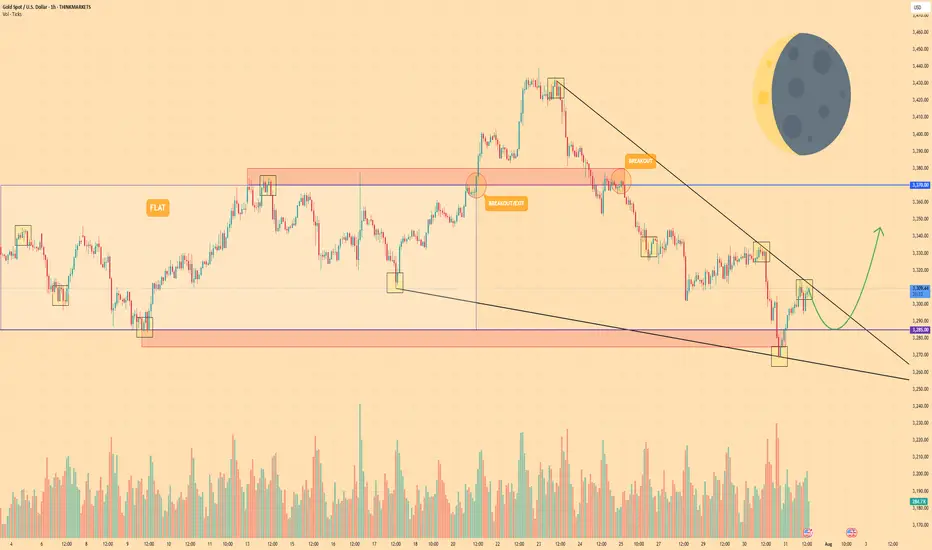
The price was consolidating for an extended period inside a wide, horizontal range.
A strong bullish impulse eventually broke the price out above the resistance of that flat channel.
This breakout move created a new significant high before sellers forcefully rejected the price downwards.
This rejection marked the beginning of the current falling wedge pattern, which has guided the price lower since.
The decline within the wedge has now brought the asset down to a critical historical support zone at $3285.
I expect that this key support will hold, causing a reversal and a new rally that targets the $3345
If this post is useful to you, you can support me with like/boost and advice in comments❤️
Disclaimer: As part of ThinkMarkets’ Influencer Program, I am sponsored to share and publish their charts in my analysis.
Gold 30Min Engaged ( Buy & Sell Reversal Entry Detected )Time Frame: 30-Minute Warfare
Entry Protocol: Only after volume-verified breakout
🩸Bearish Reversal - 3304
🩸Bullish Reversal - 3275
➗ Hanzo Protocol: Volume-Tiered Entry Authority
➕ Zone Activated: Dynamic market pressure detected.
The level isn’t just price — it’s a memory of where they moved size.
Volume is rising beneath the surface — not noise, but preparation.
🔥 Tactical Note:
We wait for the energy signature — when volume betrays intention.
The trap gets set. The weak follow. We execute.
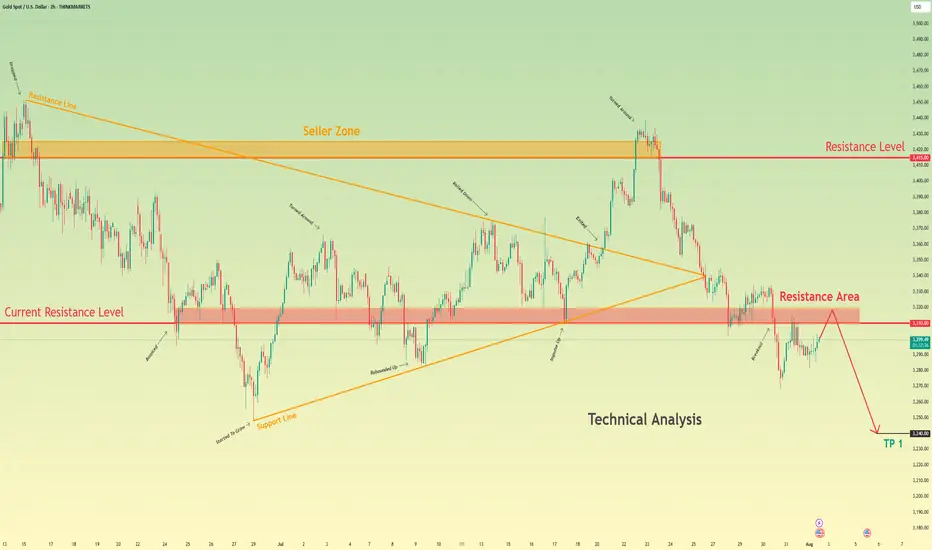
Gold can reach resistance area and then continue to fallHello traders, I want share with you my opinion about Gold. Over an extended period, the price action of Gold has been contained within a large descending triangle, a pattern characterized by a series of lower highs testing a descending resistance line and a relatively flat support base. The major seller zone around the 3415 resistance level has consistently capped upward rebounds, establishing a clear downward pressure on the asset. The most critical recent development has been a decisive breakdown, where the price broke below a key ascending trend line and, more importantly, below the horizontal support at 3310. This structural break has shifted the immediate market dynamics, turning the former support area of 3310 - 3320 into a new ceiling of resistance. The primary working hypothesis is a short scenario based on the principle of a breakdown and retest. It is anticipated that the price will attempt a corrective rally back towards this new resistance area around 3310. A failure to reclaim this level, confirmed by a strong rejection, would validate the breakdown and signal the continuation of the larger downward trend. Therefore, the tp for this next bearish leg is logically placed at the 3240 level. This target represents a significant area of potential support and a measured objective following the resolution of the recent consolidation. Please share this idea with your friends and click Boost 🚀
Disclaimer: As part of ThinkMarkets’ Influencer Program, I am sponsored to share and publish their charts in my analysis.
Gold Showing Signs of Reversal After Hitting Key ResistanceHello Guys.
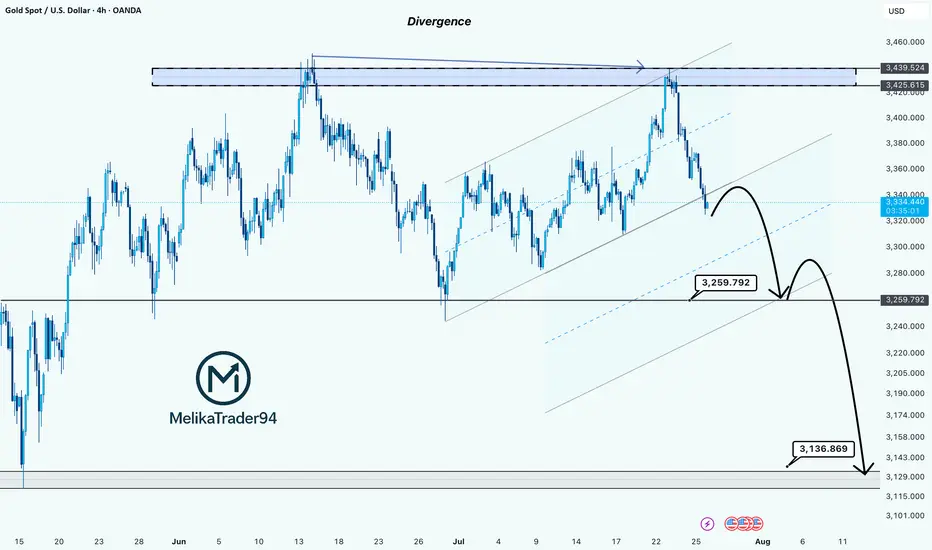
Gold has reached a major resistance zone around 3439–3425, which has already acted as a strong ceiling in the past. The price tapped into this area again, forming a clear divergence, and failed to break higher.
Here’s what stands out:
Divergence signals a weakening bullish momentum at the top.
The price rejected the resistance and is now breaking structure to the downside.
A minor pullback may occur before continuation, as shown in the projected moves.
First target: 3259.792
Second target (if support breaks): 3136.869, a deeper zone for potential bounce or further drop.
This setup hints at a bearish trend building up. Stay cautious on longs unless the price structure changes again.
Simple Psychology Tips Using Volume for Better TradingMany newer traders assume that when someone says "psychology" in trading, they are referring to mindset.
It is also widely believed that trading is about the BEST entries.
Now, think of it this way. It is not about winning trades, it is actually about managing losses well to allow you to take the winners over and over again. You might think that a 3 to 1 risk-to-reward strategy is boring, you might have gone all in on your favourite crypto project. But what makes the difference between gambling and trading is actually very, very simple. So simple, in fact, many overlook it or simply ignore it.
Most seek a silver bullet - high win rates and perfectly timed entries, then they overleverage and move stops on the one "good trade" they are seeking to make.
Whilst doing this, they tend to overload the 6 monitors they have purchased to trade with a thousand indicators, which they don't really need.
The candlesticks tell a story, volume supports that story. When you learn any technique from Elliott Waves to Wyckoff, they all have a dependence on volume - even if the correlation is not apparent.
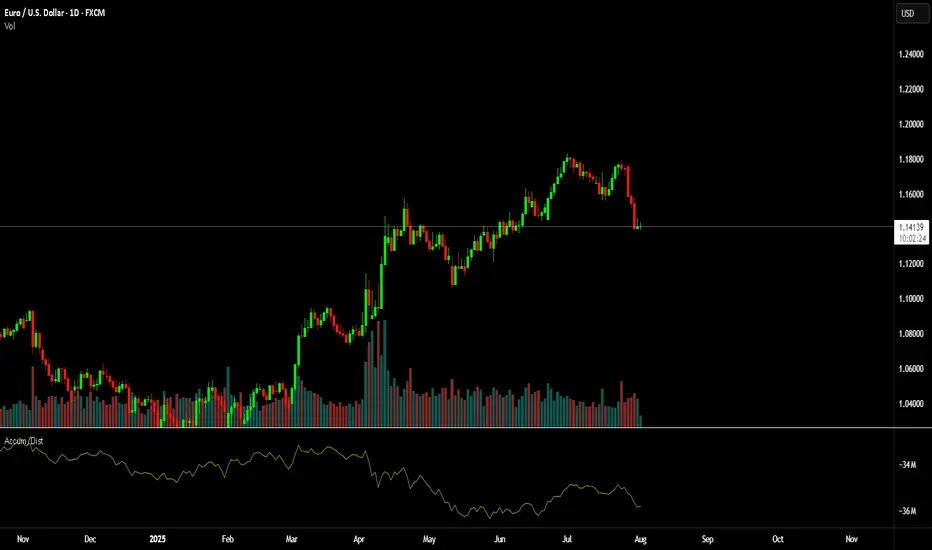
Look at this first image.
Price had moved down since the vertical line, the AD line also moved down - sell-off, in full swing. But then volume starts to shift before the AD line starts to increase.
Now, look at what happens next...
As we move forward and the new vertical line shows where volume spiked, the AD line starts to decrease as the price continues to rise.
This is enough of a story to start your analysis.
We then get a move with a lower high formed.
As this plays out, the sell-side volume rises, creating momentum for the short position.
Look a little closer and you will see, that the volume on the move up just before the drop was also decreasing. Making a divergence to price.
You might feel that the market is against you, or that the big players are single-handedly seeking your stops. But the truth is, the psychology in moves such as this one shown is where most retail traders either have greed that markets will only go up for ever or the fear that they are missing out on a market that only goes up forever.
It is that herd mentality that generates the liquidity for the professionals.
Losing 1% on a trade, is part of the process, risking 80%> on a single move will make you paper rich for about 10 minutes before the real losses set in.
This is where the psychology and the basic techniques such as risk management and understanding what candlesticks and volume bars are telling you, will make a world of difference to your results.
A/D line and volume are free on @TradingView and to be fair you don't need to overcomplicate it more than that!
Stay safe, have a great weekend all!!!
Disclaimer
This idea does not constitute as financial advice. It is for educational purposes only, our principal trader has over 25 years' experience in stocks, ETF's, and Forex. Hence each trade setup might have different hold times, entry or exit conditions, and will vary from the post/idea shared here. You can use the information from this post to make your own trading plan for the instrument discussed. Trading carries a risk; a high percentage of retail traders lose money. Please keep this in mind when entering any trade. Stay safe.
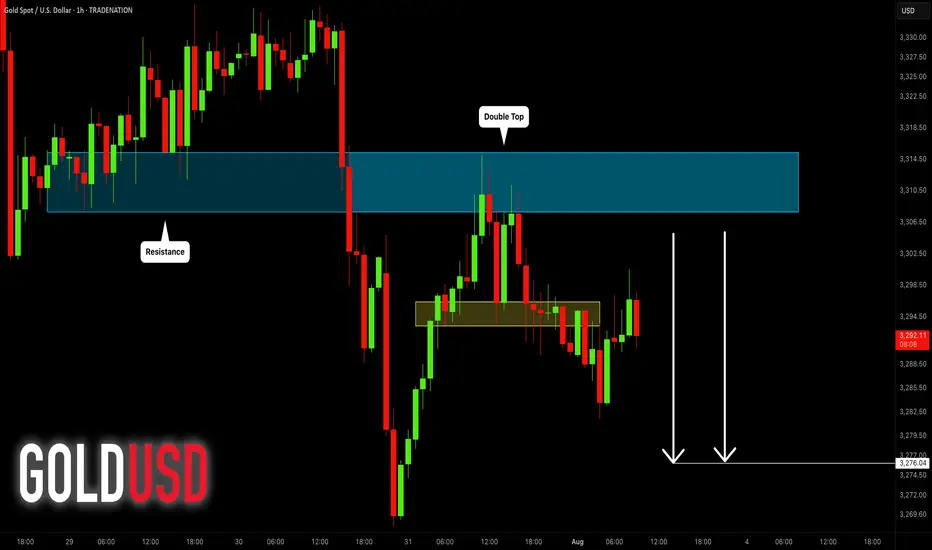
GOLD (XAUUSD): Bearish Continuation Ahead?!
Gold retested a recently broken significant liquidity cluster.
I see a clear sign of strength of the sellers after its test
with multiple intraday confirmation.
I think that the price will retrace to day to 3276 level.
❤️Please, support my work with like, thank you!❤️
I am part of Trade Nation's Influencer program and receive a monthly fee for using their TradingView charts in my analysis.
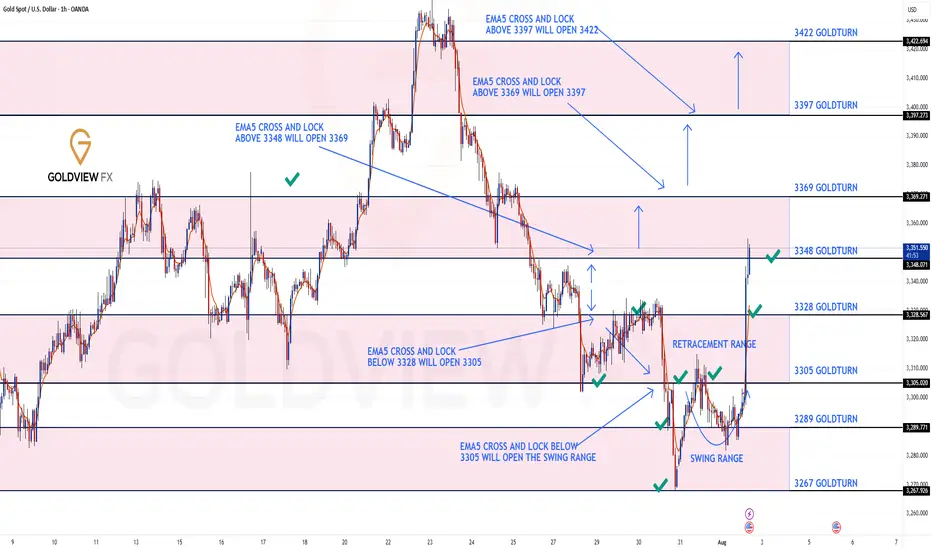
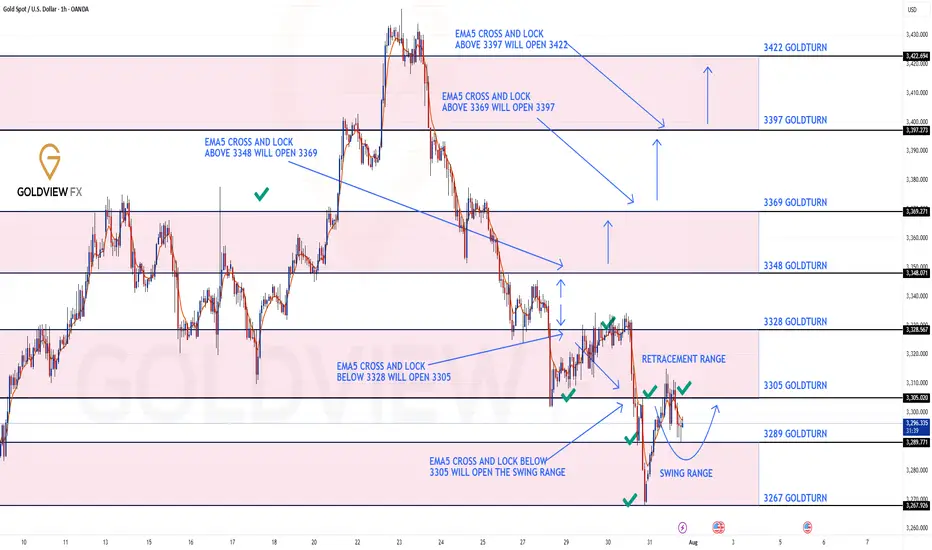
GOLD ROUTE MAP UPDATEHey Everyone,
Quick follow up on our 1H chart route map:
What can I say.....pure perfection on our chart analysis as everything played out exactly as expected.
Yesterday, we identified the first level of the swing range at 3289, which delivered a clean full swing into 3305.
Today, we hit Level 2 of the swing range at 3267, and once again, it played out flawlessly with another full swing up to 3305.
A perfect finish to the day. Great work all around!
We are now looking for support above the swing range and a break above 3305 to track the movement up or further retest and break below the 1st level of the swing range may open the the 2nd level at 3267 again.
We will keep the above in mind when taking buys from dips. Our updated levels and weighted levels will allow us to track the movement down and then catch bounces up.
We will continue to buy dips using our support levels taking 20 to 40 pips. As stated before each of our level structures give 20 to 40 pip bounces, which is enough for a nice entry and exit. If you back test the levels we shared every week for the past 24 months, you can see how effectively they were used to trade with or against short/mid term swings and trends.
The swing range give bigger bounces then our weighted levels that's the difference between weighted levels and swing ranges.
BULLISH TARGET
3348
EMA5 CROSS AND LOCK ABOVE 3348 WILL OPEN THE FOLLOWING BULLISH TARGETS
3369
EMA5 CROSS AND LOCK ABOVE 3369 WILL OPEN THE FOLLOWING BULLISH TARGET
3397
EMA5 CROSS AND LOCK ABOVE 3397 WILL OPEN THE FOLLOWING BULLISH TARGET
3422
BEARISH TARGETS
3328 - DONE
EMA5 CROSS AND LOCK BELOW 3328 WILL OPEN THE FOLLOWING BEARISH TARGET
3305 - DONE
EMA5 CROSS AND LOCK BELOW 3305 WILL OPEN THE SWING RANGE
3289 - DONE
3267 - DONE
As always, we will keep you all updated with regular updates throughout the week and how we manage the active ideas and setups. Thank you all for your likes, comments and follows, we really appreciate it!
Mr Gold
GoldViewFX
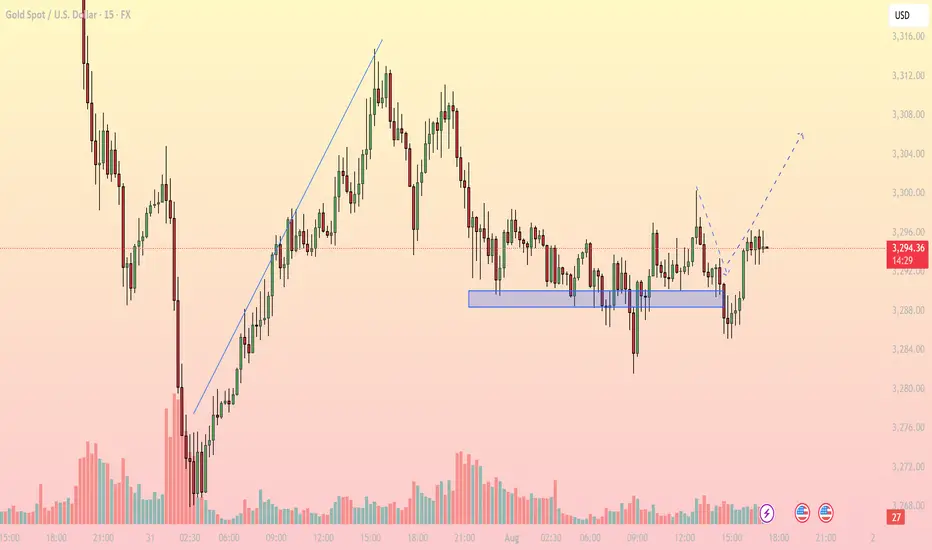
Bullish Rejection from Support, Upside in FocusMarket Overview: On the M15 timeframe, XAUUSD shows signs of a short-term bullish reversal after a prolonged sideways range around the key support zone of 3,286 – 3,289 USD. Price faked out below this support but quickly recovered, forming a V-shape reversal, suggesting strong buying interest has returned.
Key Levels to Watch:
Support Zones:
- 3,286 – 3,289: Strong intraday support, tested multiple times with sharp rejections
- 3,274: Next significant support if the above zone fails
Resistance Zones:
- 3,300 – 3,304: First resistance target aligned with the recent high
- 3,308 – 3,312: Higher resistance area where supply may emerge
Technical Indicators:
EMA: Price has reclaimed the short-term EMAs, indicating bullish momentum on lower timeframes
RSI: Rising above 50 but not yet overbought – there’s room for further upside
Volume: Increasing volume during the bounce confirms buying strength
Trading Strategy:
- Bullish Scenario (Preferred): Entry Zone: Watch for pullback toward 3,290 – 3,292
Stop Loss: Below 3,285
Take Profit 1: 3,300
Take Profit 2: 3,304
Extended Target: 3,308 – 3,312 (if bullish momentum continues beyond breakout zone)
- Bearish Scenario (Alternate): Only valid if price breaks and closes strongly below 3,286
Short Target: 3,274 – 3,270
Note: Counter-trend strategy – higher risk, requires strong confirmation
Conclusion: Gold is showing a bullish price structure on the 15-minute chart. As long as price holds above the 3,286 – 3,289 support zone, the path of least resistance appears to be upward, with 3,300 and 3,304 as the next logical targets. Monitor price action closely during the U.S. session for a potential long setup.
- Follow for more real-time gold trading strategies and save this idea if you find it helpful!
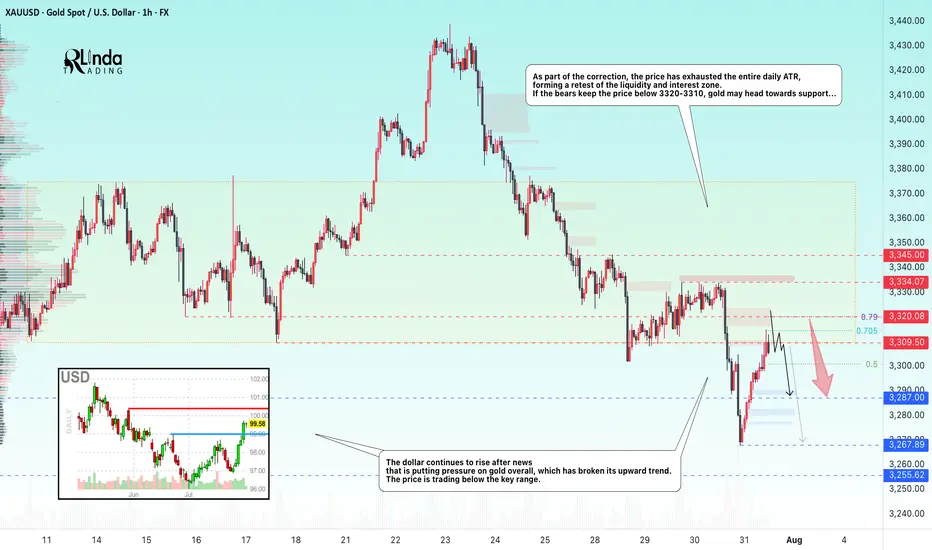
GOLD → Retest of resistance within a bearish runFX:XAUUSD breaks through the upward trend support amid a rallying dollar. Since the opening of the session, the price has been testing the zone of interest, but bears are quite aggressive...
Gold is partially recovering after falling to $3,268, a monthly low caused by the Fed's hawkish tone. The Central Bank kept its rate at 4.25–4.5% (9 votes to 2), highlighting uncertainty due to Trump's tariffs. Markets now estimate the probability of the rate remaining unchanged in September at 58% (previously 35%). The dollar's rise slowed amid concerns about the extension of the US-China trade truce and profit-taking ahead of key US employment data (after strong ADP and GDP reports). The nearest drivers are labor market statistics and trade news, while the technical picture for gold remains bearish.
Technically, on D1, the price is breaking key support zones, including the trend line, which overall only increases selling pressure on the metals market...
Resistance levels: 3310, 3320, 3334
Support levels: 3287, 3267, 3255
As part of the correction, the price has exhausted the entire daily ATR, forming a retest of the liquidity and interest zone. If the bears keep the price below 3320-3310, gold may head towards support...
Best regards, R. Linda!
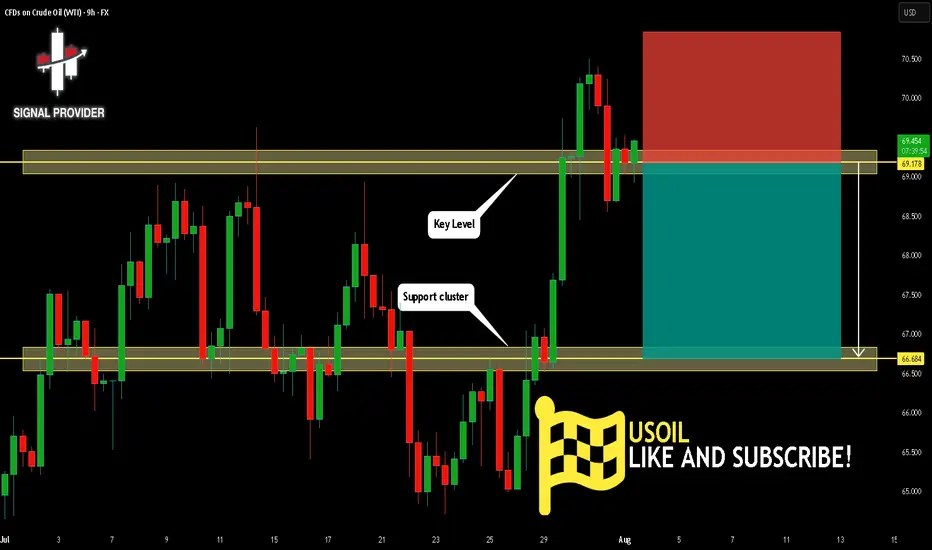
USOIL Is Bearish! Short!
Please, check our technical outlook for USOIL.
Time Frame: 9h
Current Trend: Bearish
Sentiment: Overbought (based on 7-period RSI)
Forecast: Bearish
The market is approaching a significant resistance area 69.178.
Due to the fact that we see a positive bearish reaction from the underlined area, I strongly believe that sellers will manage to push the price all the way down to 66.684 level.
P.S
The term oversold refers to a condition where an asset has traded lower in price and has the potential for a price bounce.
Overbought refers to market scenarios where the instrument is traded considerably higher than its fair value. Overvaluation is caused by market sentiments when there is positive news.
Disclosure: I am part of Trade Nation's Influencer program and receive a monthly fee for using their TradingView charts in my analysis.
Like and subscribe and comment my ideas if you enjoy them!
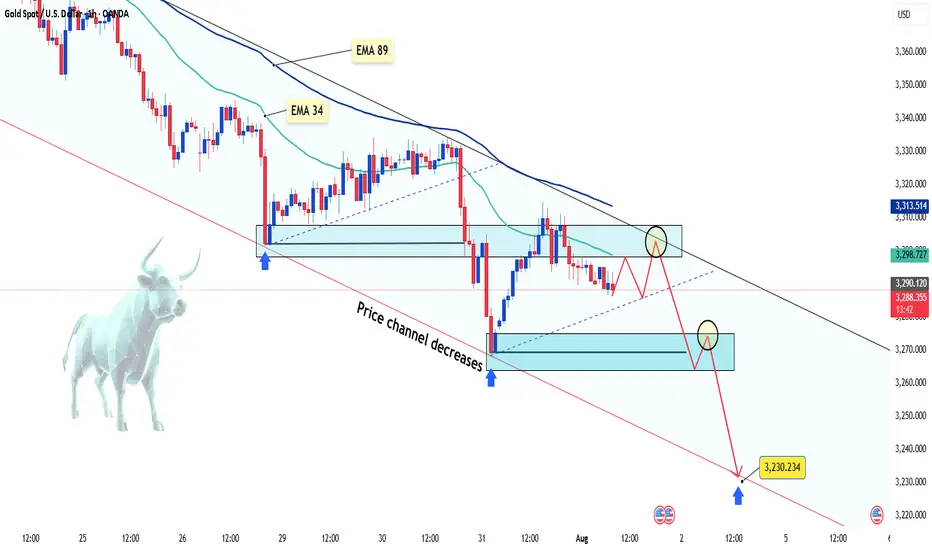
Gold keeps falling – is there more to come?Hello everyone, great to see you again!
Today, gold remains under pressure following a series of strong U.S. economic data releases, which have reinforced expectations that the Federal Reserve will keep interest rates elevated for longer. As a result, the U.S. dollar has strengthened, Treasury yields have climbed, and gold has lost its footing.
On the H1 chart, XAUUSD is clearly trading within a descending price channel. Both the EMA 34 and EMA 89 are acting as dynamic resistance zones. Recent attempts to rally have consistently failed at these levels, mirroring the bearish setup seen before July 29.
Currently, price is retesting a minor resistance area. If this retest fails, the next downside targets lie near 3,270 – and potentially down to 3,230 USD, which aligns with the lower boundary of the price channel.
From my perspective, the bearish momentum is likely to continue.
What about you? How do you think gold will close the day?
HelenP. I After correction to support level, Gold start to growHi folks today I'm prepared for you Gold analytics. An examination of the chart highlights a well-established long-term uptrend, with the bullish structure being clearly defined by a major ascending trend line that has consistently provided dynamic support. Currently, the price is undergoing a healthy correction after being rejected from the major resistance zone around 3430. This pullback is now guiding the price towards a critical confluence of support, where the aforementioned ascending trend line intersects with a strong horizontal support zone at 3305 - 3285. My analysis for a long position is based on the high probability of a bullish reaction from this key area. I believe that as the price enters this support confluence, it will be met with strong buying pressure, as it represents a logical point for buyers to defend the trend. A confirmed bounce from this zone, demonstrated by a rejection of lower prices, would be the main condition to validate the continuation of the uptrend. Therefore, the primary goal for the subsequent rally is set at the 3430 resistance level, as a retest of the recent high is the most logical objective following a successful defense of the trend. If you like my analytics you may support me with your like/comment ❤️
Disclaimer: As part of ThinkMarkets’ Influencer Program, I am sponsored to share and publish their charts in my analysis.
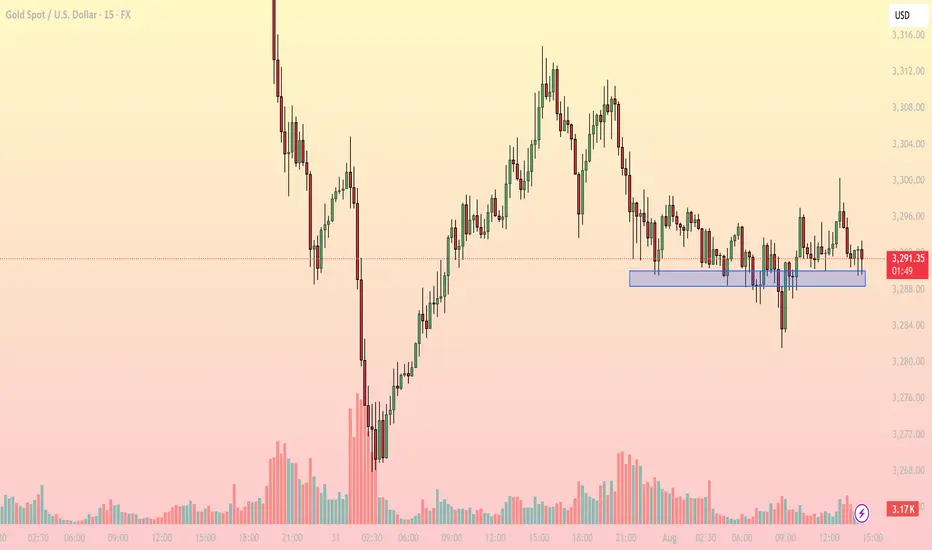
Gold consolidates near key support – What's next for?1. Market Overview
On the 15-minute chart, XAUUSD is trading around 3,290–3,292 USD, hovering just above a critical intraday support zone at 3,287–3,289 USD (highlighted in blue). This area has repeatedly provided a bounce in recent sessions, indicating persistent buying interest.
The current price action reflects sideways movement within a narrow range (3,287–3,296 USD), and notably, declining volatility, as shown by reduced candle range and trading volume.
2. Technical Breakdown
EMA: Price is moving around the EMA20 and EMA50, reflecting indecision and lack of directional momentum.
RSI (inferred): Likely hovering near the neutral 50–55 zone, confirming a balanced market.
Trendline: A descending series of lower highs from the 3,312 peak suggests bearish pressure, though buyers still defend key support.
Fibonacci: The 3,287 USD zone aligns with the 61.8% Fibonacci retracement level, reinforcing its strength as a bounce area.
3. Key Levels to Watch
3,287–3,289: Support - Repeated reactions here – key demand zone
3,296: Immediate resistance - Needs breakout to confirm bullish move
3,302: Next resistance - Breakout target – short-term top
3,275: Deeper support - Retest level if support breaks
4. Trading Strategy Scenarios
🔹 Scenario 1 – Long setup at support
Entry: 3,287–3,289 (wait for bullish reaction like pin bar or engulfing)
Stop Loss: Below 3,284
TP1: 3,296 | TP2: 3,302
🔹 Scenario 2 – Short setup on breakdown
Entry: Below 3,284 (after clear bearish candle close)
Stop Loss: 3,288
TP1: 3,275 | TP2: 3,268
5. Conclusion
Gold is in a tug-of-war at a sensitive support zone. Whether bulls defend or bears break below will set the tone for the rest of the session. Focus on price reaction around 3,287 to determine direction – avoid blind predictions.
Make sure to follow for more live strategies as the New York session unfolds – and save this post if you find it helpful!
What’s your view on this support zone? Let’s discuss below!
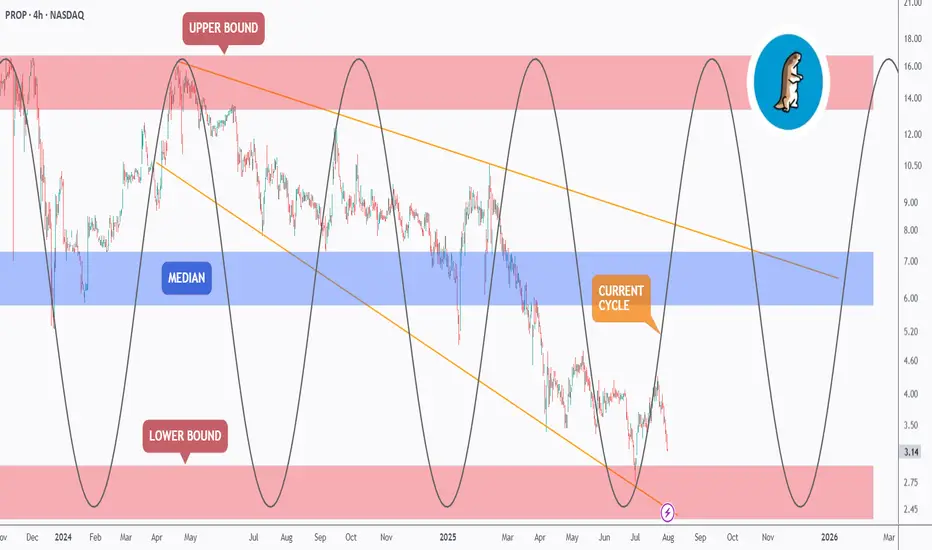
PROP - Riding the Cycle? The Next Wave May Just Be Starting!Markets move in cycles; and PROP is no exception.
If you’ve been following our previous analyses, you’ll recognize the accumulation zone we highlighted earlier. Well, this updated chart adds another layer: the cyclical rhythm of price action.
🔁As shown, PROP has been moving in clearly defined waves, bouncing between key zones with consistency. The current cycle appears to have bottomed — once again — inside the lower bound, where strong demand continues to hold.
We’re now in the early phase of what could be a fresh bullish cycle. If the rhythm plays out as before, the path of least resistance could take us toward the median zone ($6.5 - $7.5) and possibly all the way back to the upper bound ($15 - $17) by late 2025 or early 2026.
🔍 Supporting Fundamentals
While the chart speaks volumes, the fundamentals back it up:
Energy demand is surging globally, fueled by AI, data centers, and electric infrastructure — all of which require massive power capacity.
Oil and gas remain essential in this transition phase, especially with renewable infrastructure still years away from matching base-load demand.
PROP (Prairie Operating Co.) controls 65,000 acres in the DJ Basin — one of the most productive oil regions in the U.S. With advanced drilling tech and low-cost operations, PROP is well-positioned to ride out volatility and capitalize on rising demand.
🎯 Key Zones to Watch
- Support: $2.5–$3
- Median target: $6.5–$7.5
- Macro resistance: $15–$17
📌 We’re not just seeing structure — we’re seeing rhythm, confluence, and timing align.
If this cycle continues to play out, PROP might just be preparing for its next major wave.
Are you ready to catch it?
🧠 Previous posts and technical breakdowns are attached for full context.
➡️ As always, speak with your financial advisor and do your own research before making any investment decisions.
📚 Always follow your trading plan => including entry, risk management, and trade execution.
Good luck!
All strategies are good, if managed properly.
~ Richard Nasr
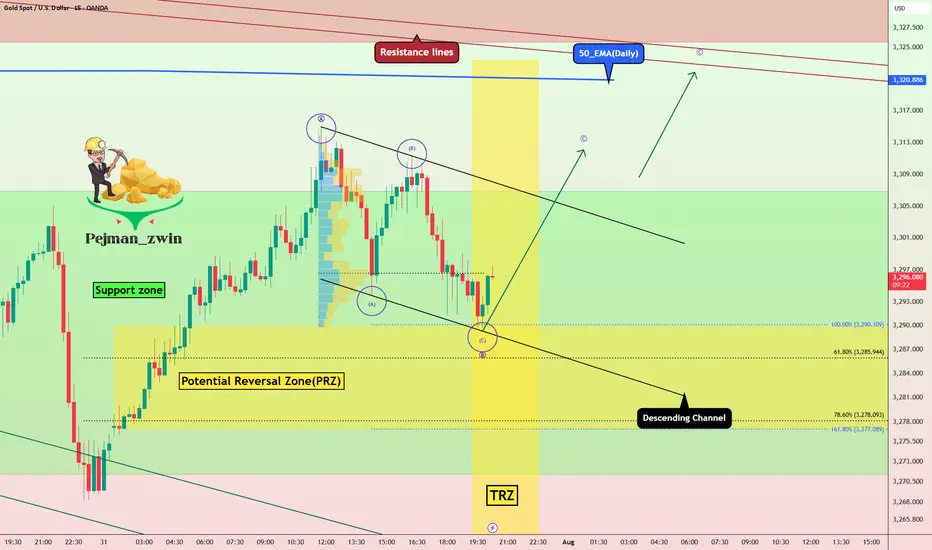
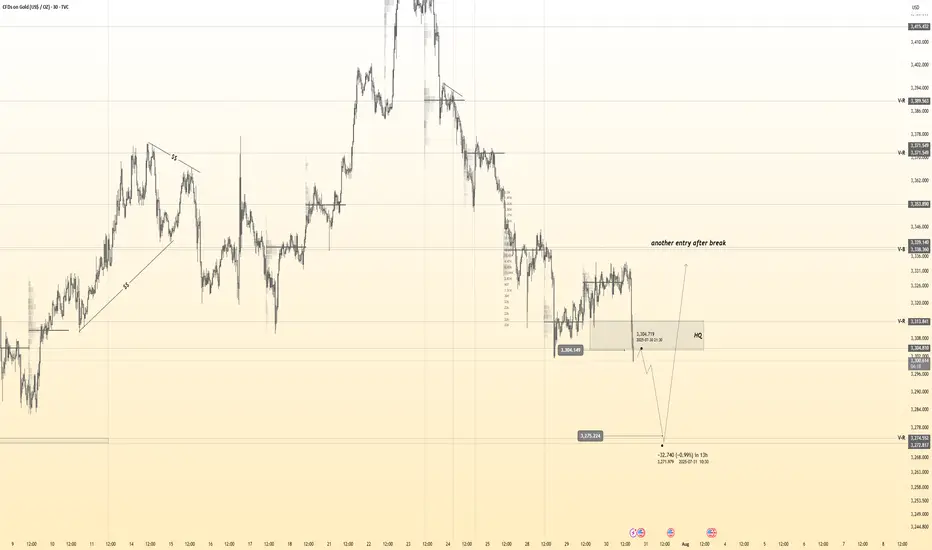
Gold in PRZ + TRZ: Is a Bullish Reversal Brewing(Short-term)?Gold , as I expected in yesterday's idea , fell to the Potential Reversal Zone(PRZ) and started to rise again .
Today's Gold analysis is on the 15-minute time frame and is considered short-term , so please pay attention .
Gold is currently trading in the Support zone($3,307-$3,275) and near the Potential Reversal Zone(PRZ) and Time Reversal Zone(TRZ) .
In terms of Elliott Wave theory , it seems that Gold can complete the microwave C of wave B at the lower line of the descending channel.
I expect Gold to trend higher in the coming hours and rise to at least $3,311 .
Note: Stop Loss (SL) = $3,267
Gold Analyze (XAUUSD), 15-minute time frame.
Be sure to follow the updated ideas.
Do not forget to put a Stop loss for your positions (For every position you want to open).
Please follow your strategy; this is just my idea, and I will gladly see your ideas in this post.
Please do not forget the ✅ ' like ' ✅ button 🙏😊 & Share it with your friends; thanks, and Trade safe.