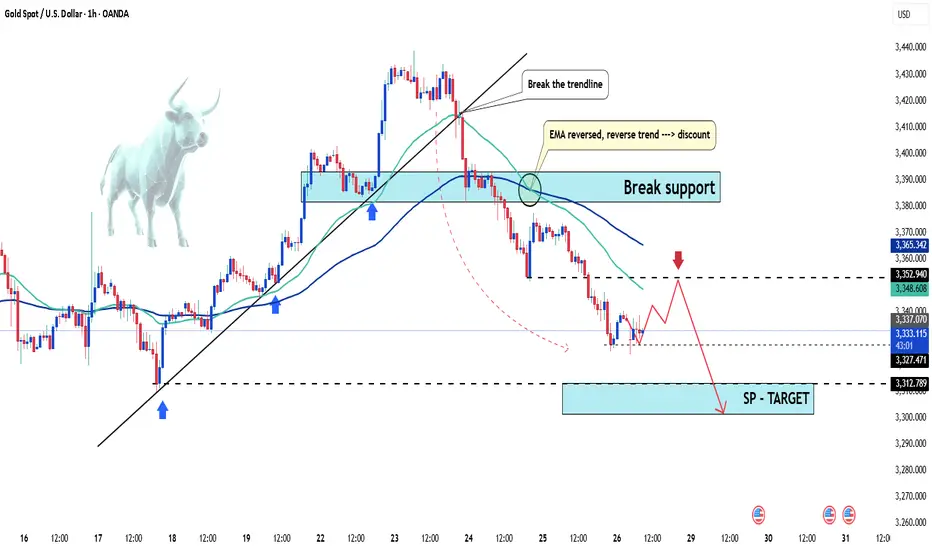
Downward Pressure Resumes After Channel BreakdownXAUUSD OANDA:XAUUSD – Downward Pressure Resumes After Channel Breakdown: Key Levels and Strategy for Today
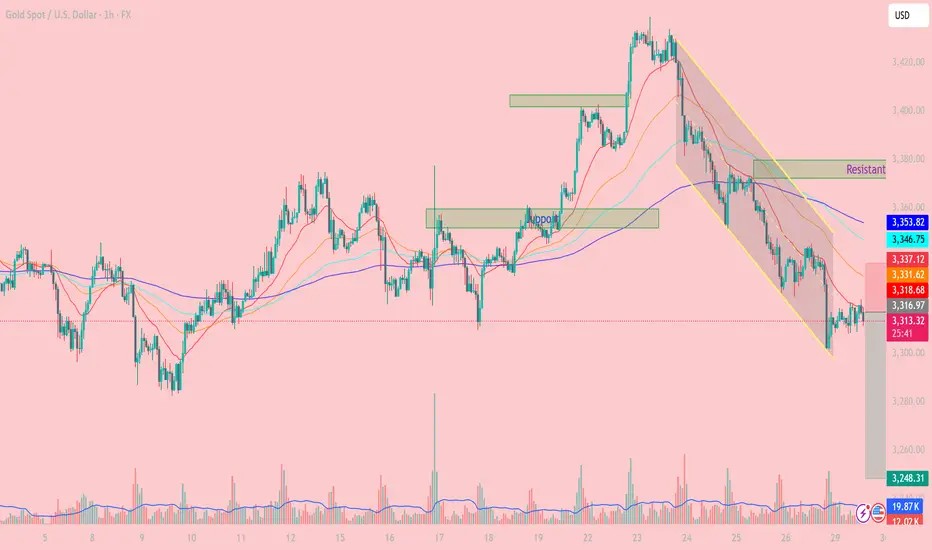
As of the July 29 session, gold (XAUUSD) remains under short-term bearish pressure, having broken below the descending price channel on the 1H timeframe. The market structure confirms a dominant bearish trend as price continues to trade below the EMAs cluster.
1. Price Action and Market Behavior
XAUUSD is forming a clear sequence of lower highs and lower lows, confirming a short-term downtrend.
Price is currently hovering around $3,316 after breaking below the lower boundary of the channel, signaling potential continuation of the sell-off.
2. Key Resistance and Support Levels
Immediate resistance: 3,337 – 3,346 USD (aligned with EMA20, EMA50 and prior channel resistance).
Major resistance: 3,378 – 3,385 USD (confluence of Fibo and former high).
Near-term support: 3,300 USD (psychological level).
Major support: 3,248 USD (projected target based on measured move from channel height).
3. Technical Indicators
EMA20 and EMA50 are both below EMA200, forming a classic “death cross” – a strong bearish signal.
Volume increased on the breakdown, reinforcing the strength of bearish momentum.
RSI remains below 50, indicating weak bullish retracements and room for further downside.
4. Trading Strategy
Primary Strategy: Sell on Rally
Ideal entry zone: 3,331 – 3,346 USD.
Stop Loss: Above 3,353 USD (above key resistance zone).
TP1: 3,300 USD.
TP2: 3,248 USD (extended target based on breakout structure).
Alternative Strategy: Countertrend Long
Only consider buy setups if strong reversal candles and bullish RSI divergence appear near 3,248 USD.
XAUUSD continues to face downside risk after the channel breakdown. Unless bulls reclaim the 3,337 – 3,346 zone, price is more likely to drift lower toward 3,300 and potentially 3,248. Traders should remain patient and wait for clean setups around these key zones.
Follow for more strategies and remember to save this post if you found it helpful.
Let me know if you'd like a short version for the TradingView caption or hashtags suggestion.
Commodities
Gold. wave e (green) of triangle possible reached. 29/July/25XAUUSD based on speed of chart + confluence zone 1) Channel Support 2) POC of volume profile 3) Trendline support. Gold probably completed its wave e (green) of triangle.
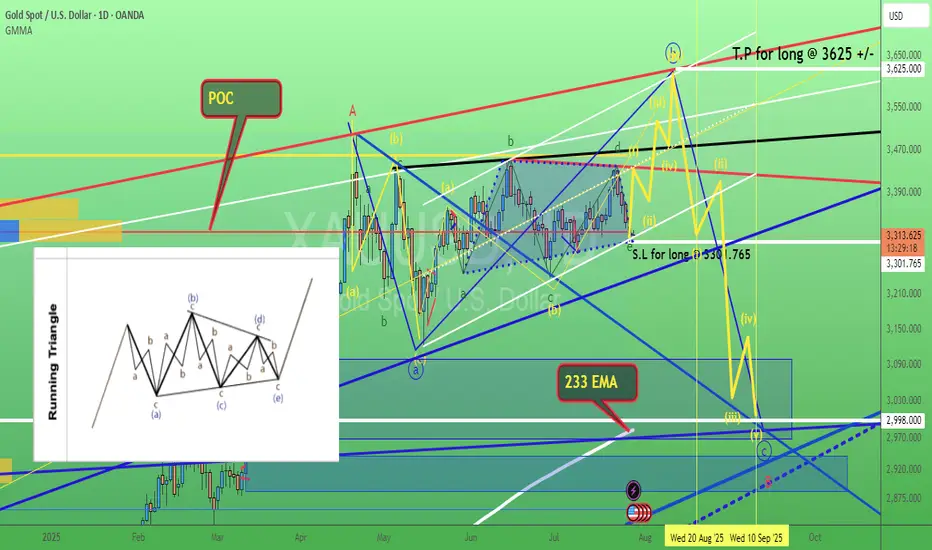
Gold major trendline3 Bull points
RSI div
Major trendline
and hoping to reversal trend 30min timeframe very soon...
Buy stop order
RRR 1:2
Hold for 3430 for more gain but manage your risk

Crude oil-----sell near 67.50, target 65.00-64.00Crude oil market analysis:
The idea of crude oil today is still bearish. Xiaoyang predicts that it will rebound first and then continue to fall. Consider selling near 67.50 if it rebounds. Crude oil is basically weak if it does not stand above 70.00. Crude oil is a repair market after a big drop. In theory, it will continue to fall after the repair. In addition, pay attention to crude oil inventory data later.
Operation suggestions:
Crude oil-----sell near 67.50, target 65.00-64.00

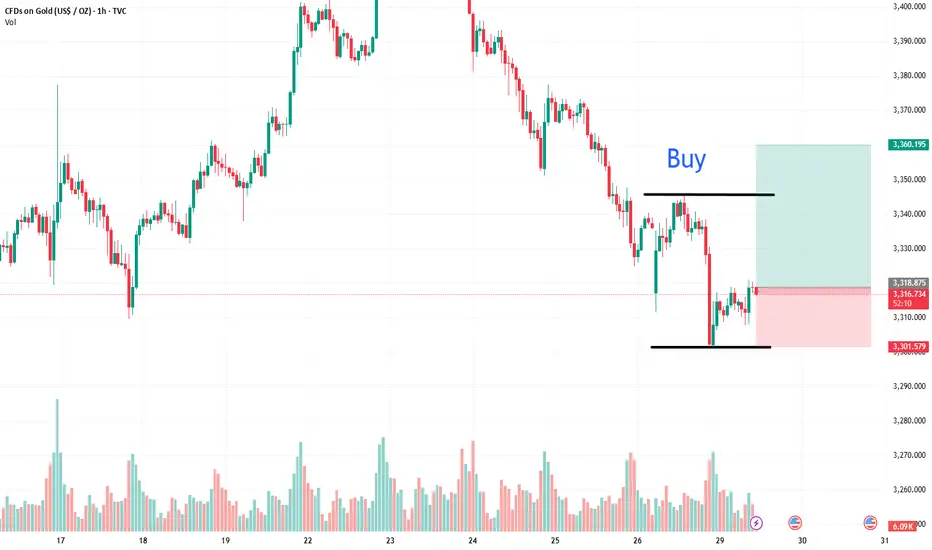
XAUUSD (GOLD) - SCALPING IDEA🧠 Clean Price Action Outlook – Patience Until the Range Breaks
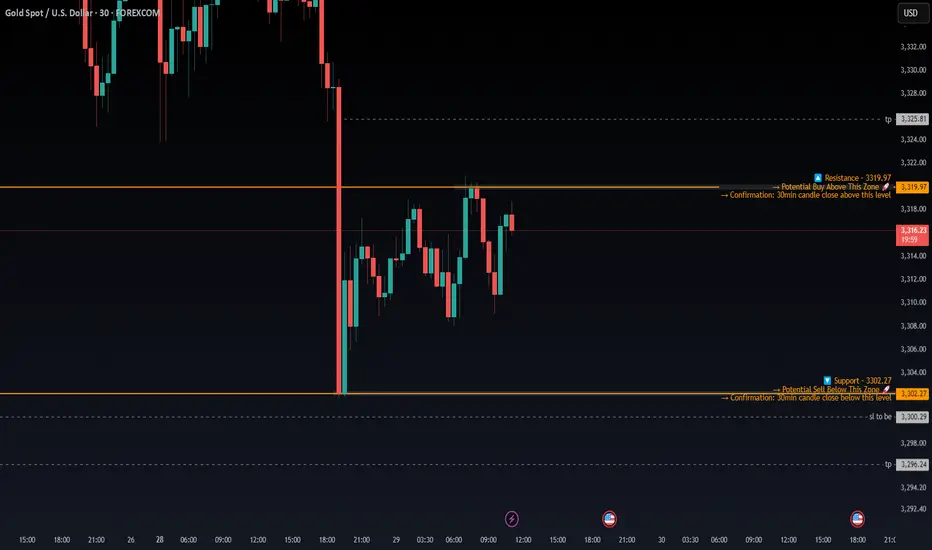
Currently, price is consolidating between 3319.97 (resistance) and 3302.27 (support) a well defined short-term range that’s been respected multiple times. Both levels are holding firmly, with wicks and reactions showing that buyers and sellers are actively defending these zones.
Right now, I'm not interested in trading inside this chop zone there's too much noise and no clear directional conviction. My focus is on waiting for price to break cleanly out of the range with confirmation.
📈 Bullish Scenario (Buy Plan):
If price breaks and closes above 3319.97 on the 30-minute timeframe, that would be the first sign of bullish strength. Ideally, I want to see:
A strong bullish candle close above 3319.97
Follow-through in the next candle (not a fakeout or wick trap)
Volume pickup or price holding above the level during retest
📍 If this happens, I’ll look to enter long trades on confirmation, with a potential target around 3325.81, which is the next minor resistance.
SL would ideally be placed just below the breakout candle or the breakout zone itself depending on the price structure at the time.
📉 Bearish Scenario (Sell Plan):
On the flip side, if price breaks down below 3302.27 and closes below it on the 30-minute chart, that opens the door for shorts.
Here’s what I want to see:
A full candle body close below the level (not just a wick spike)
Possibly a retest + rejection of 3302.27 from below
Weak price action around the level confirming sellers are in control
If that plays out, I’ll consider short entries with an SL above the structure (around 3304+), and a first target around 3296.00, where there’s minor demand.
⚠️ Until Then – No Trade Zone
Until we get a confirmed breakout, I’m staying out. No point guessing which side will win the market will show us.
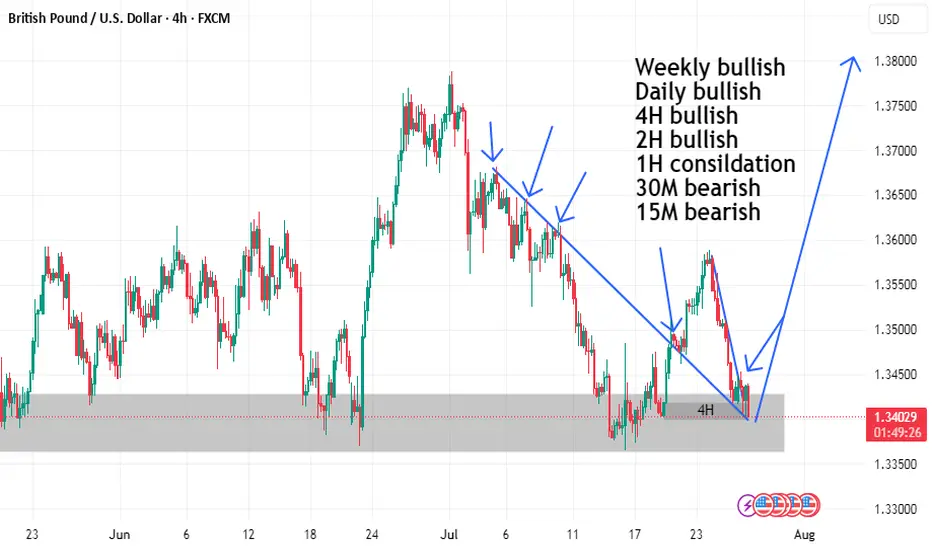
GBPUSD BUY TIGER SETUP LOOOOOOOOOOOONGwelcome
we have strong mitigation order block on time frame weekly and daily
and on 4H we have break downtrend and retest on it
and we in well discount area
and we have demand on high time frame
so this is good idea for buying
Don't forget to follow me
so that get refresh analysis
7.29 Gold 1-hour bottom signal appearsIn the short term, we see the daily line as the range of 3301-3345, and the current price is showing a volatile rebound, so we have to buy on dips. Then 3306-08 is the long point, but the price has risen in the morning, so the long position should be around 3310-12 in advance. If it falls below 3301 during the day, it will continue to test the 3292-3282 line downward. Similarly, if it breaks above 3345 during the day, it will continue to test 3372 upward and show a rebound trend in the next few days.
WTI(20250729)Today's AnalysisMarket news:
After gold prices soared to an all-time high of more than $3,500 an ounce in April, the latest report from the Commodity Futures Trading Commission (CFTC) showed that fund managers have increased their bullish bets to the highest level in 16 weeks.
Technical analysis:
Today's buy and sell boundaries:
66.09
Support and resistance levels:
68.13
67.37
66.87
65.30
64.80
64.04
Trading strategy:
If the price breaks through 66.87, consider buying, the first target price is 67.37
If the price breaks through 66.09, consider selling, the first target price is 65.30

Bullish Sentiment Returns to Gold?Hello everyone, what are your thoughts on XAUUSD?
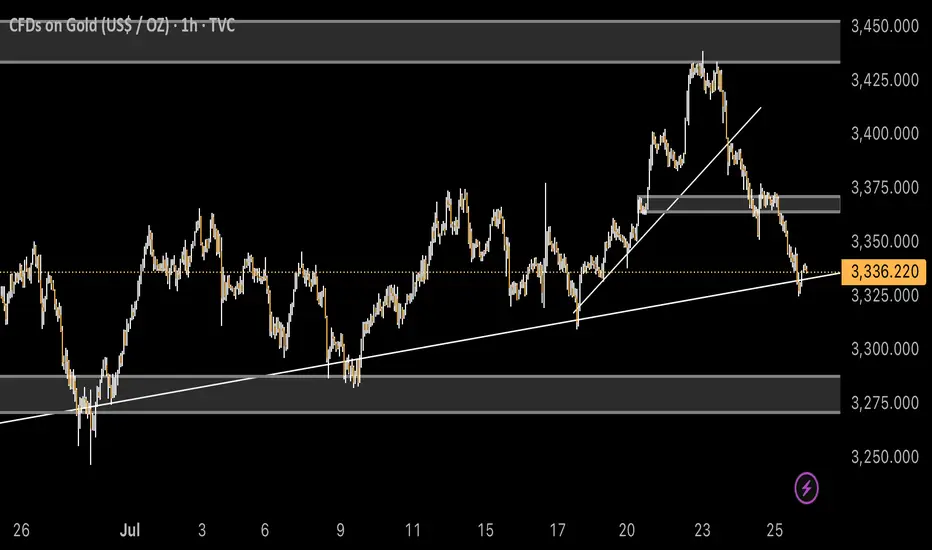
From a technical perspective, XAUUSD has just retested its long-term ascending trendline and formed a bullish reaction candle, suggesting that buying pressure may be returning.
Recently, a survey of 206 investors revealed that market sentiment remains optimistic, with 66% expecting gold prices to continue rising, 19% predicting a decline, and 15% anticipating a sideways market.
What do you think? Share your opinion in the comments!

Gold Under Pressure – Temporary Pullback or Start of a DowntrendHello everyone, great to see you again.
Today, let’s focus on the bearish factors surrounding gold. At the time of writing, gold is trading around 3,331 USD, down 50 pips on the day, continuing its downward correction since the end of last week.
Within just a few days, gold has plunged from its peak of 3,433 USD—losing nearly 100 USD per ounce.
This sharp drop is largely driven by profit-taking and market anticipation ahead of key economic data next week, including U.S. interest rate decisions, inflation, and job reports.
This week is packed with critical updates: growth figures, inflation stats, employment numbers, and monetary policy decisions from major central banks—all of which could significantly impact gold’s next move.
According to a recent survey, 36% of analysts expect gold to fall further, while retail investors remain optimistic about a rebound.
For now, the market is clearly in a correction phase. Caution is advised.
What do you think—will gold bounce back or continue to drop?
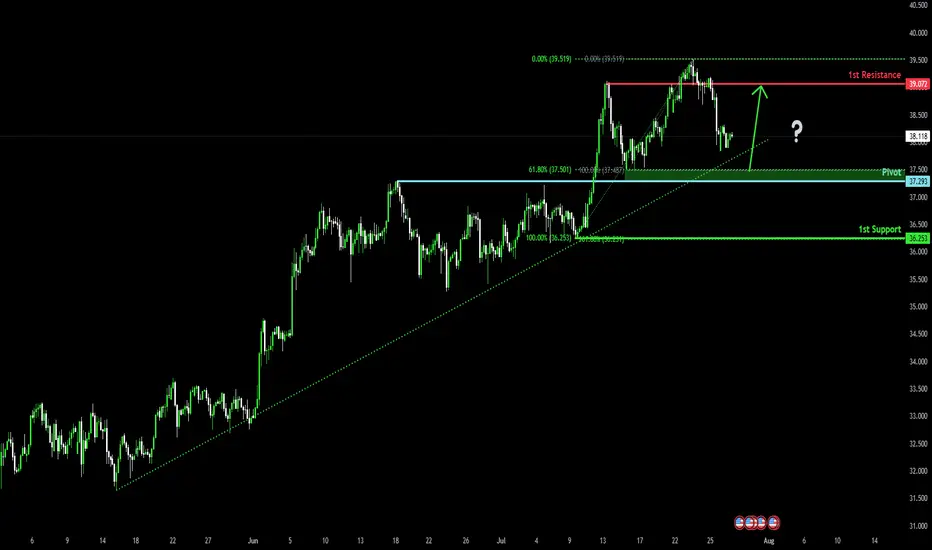
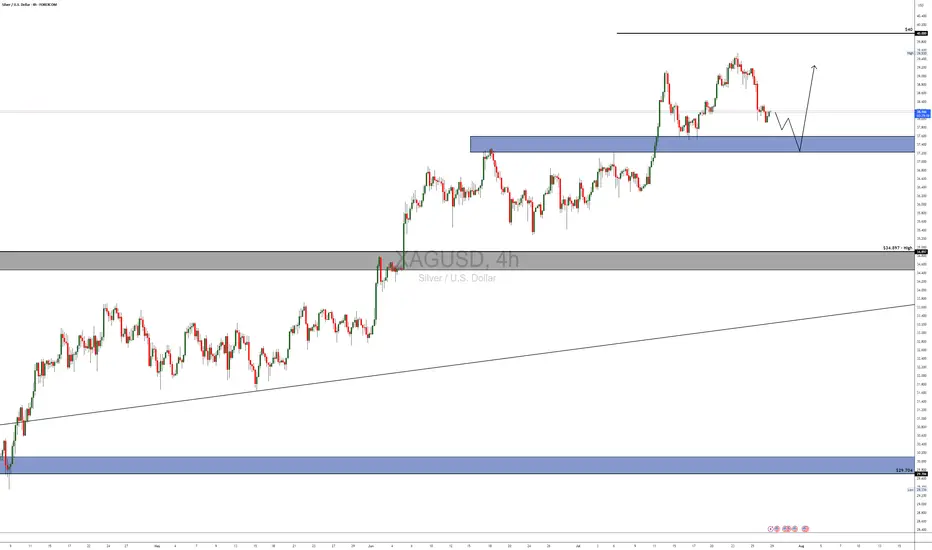
Falling towards pullback support?The Silver (XAG/USD) is falling towards the pivot, which is a pullback support and could rise to the 1st resistance.
Pivot: 37.29
1st Support: 36.25
1st Resistance: 39.07
Risk Warning:
Trading Forex and CFDs carries a high level of risk to your capital and you should only trade with money you can afford to lose. Trading Forex and CFDs may not be suitable for all investors, so please ensure that you fully understand the risks involved and seek independent advice if necessary.
Disclaimer:
The above opinions given constitute general market commentary, and do not constitute the opinion or advice of IC Markets or any form of personal or investment advice.
Any opinions, news, research, analyses, prices, other information, or links to third-party sites contained on this website are provided on an "as-is" basis, are intended only to be informative, is not an advice nor a recommendation, nor research, or a record of our trading prices, or an offer of, or solicitation for a transaction in any financial instrument and thus should not be treated as such. The information provided does not involve any specific investment objectives, financial situation and needs of any specific person who may receive it. Please be aware, that past performance is not a reliable indicator of future performance and/or results. Past Performance or Forward-looking scenarios based upon the reasonable beliefs of the third-party provider are not a guarantee of future performance. Actual results may differ materially from those anticipated in forward-looking or past performance statements. IC Markets makes no representation or warranty and assumes no liability as to the accuracy or completeness of the information provided, nor any loss arising from any investment based on a recommendation, forecast or any information supplied by any third-party.
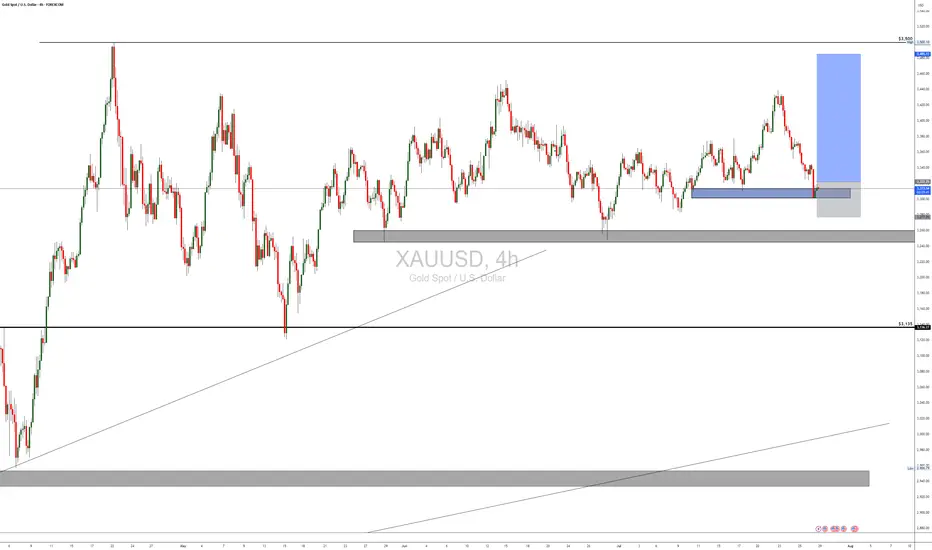
Bearish drop for the Gold?The price is reacting off the pivot and could drop to the 1st support, which is a swing low support that aligns with the 127.2% Fibonacci extension.
Pivot: 3,319.63
1st Support: 3,271.54
1st Resistance: 3,345.37
Risk Warning:
Trading Forex and CFDs carries a high level of risk to your capital and you should only trade with money you can afford to lose. Trading Forex and CFDs may not be suitable for all investors, so please ensure that you fully understand the risks involved and seek independent advice if necessary.
Disclaimer:
The above opinions given constitute general market commentary, and do not constitute the opinion or advice of IC Markets or any form of personal or investment advice.
Any opinions, news, research, analyses, prices, other information, or links to third-party sites contained on this website are provided on an "as-is" basis, are intended only to be informative, is not an advice nor a recommendation, nor research, or a record of our trading prices, or an offer of, or solicitation for a transaction in any financial instrument and thus should not be treated as such. The information provided does not involve any specific investment objectives, financial situation and needs of any specific person who may receive it. Please be aware, that past performance is not a reliable indicator of future performance and/or results. Past Performance or Forward-looking scenarios based upon the reasonable beliefs of the third-party provider are not a guarantee of future performance. Actual results may differ materially from those anticipated in forward-looking or past performance statements. IC Markets makes no representation or warranty and assumes no liability as to the accuracy or completeness of the information provided, nor any loss arising from any investment based on a recommendation, forecast or any information supplied by any third-party.

Has gold Bottomed Out? Will the Bullishness continue from here?Looking for the bullish activity to continue from here but need to see a sweep and reject of the Previous daily Low before I want to get active. This would give confirmation that the price want to continue with this bullishness.

BUY TRADE SETUP ON XAGUSDCheck this buy trade setup i got on SILVER.
Anticipate a retest of the demands zone at 37.45 zone and plan for a buy entry there.
A Swing Trade Plan.
BUY TRADE SETUP ON XAUUSDA Quick Trade setup on Gold for Gold traders who are crazy about Gold!
Swing Trade.
Check it out!
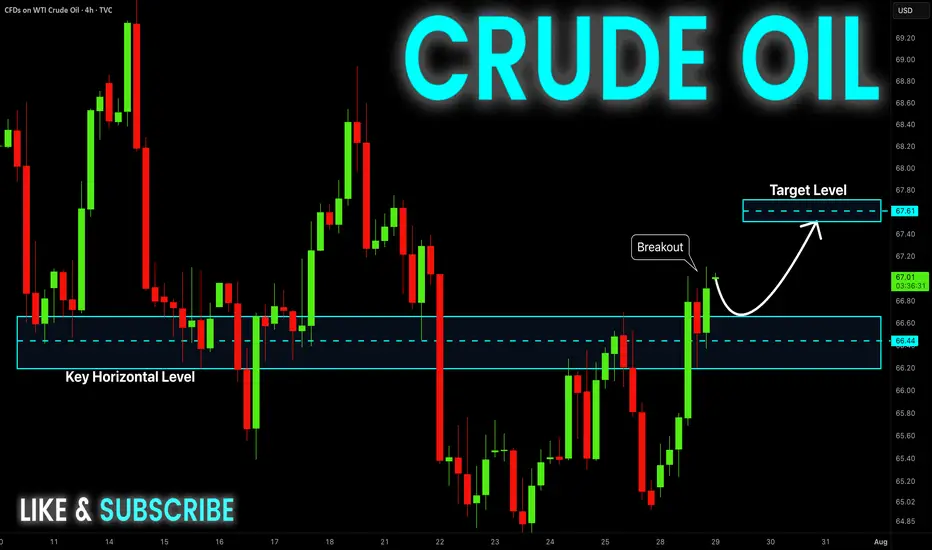
CRUDE OIL Bullish Continuation! Buy!
Hello,Traders!
CRUDE OIL made a rebound
From the support just as
I predicted and the price
Went further still and broke
The key horizontal level
Of 66.50$ and the breakout
Is confirmed so we are
Bullish biased and we will be
Expecting a further bullish
Move up!
Buy!
Comment and subscribe to help us grow!
Check out other forecasts below too!
Disclosure: I am part of Trade Nation's Influencer program and receive a monthly fee for using their TradingView charts in my analysis.
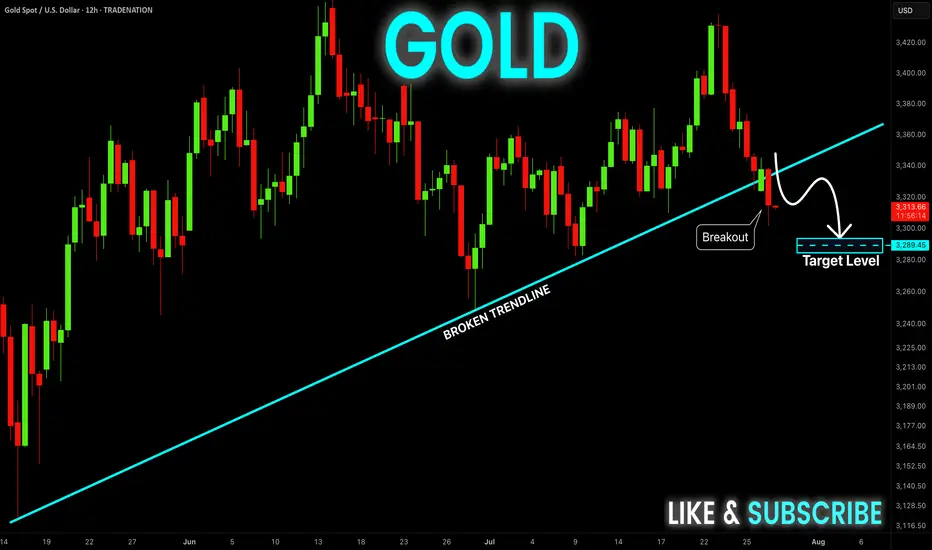
GOLD Epic Trendline Breakout! Sell!
Hello,Traders!
GOLD was trading along
A long-term trend-line but
It is broken now and the
Breakout is confirmed so
We are bearish biased now
And we will be expecting a
Further bearish move down
Sell!
Comment and subscribe to help us grow!
Check out other forecasts below too!
Disclosure: I am part of Trade Nation's Influencer program and receive a monthly fee for using their TradingView charts in my analysis.
Gold Price Rally: Why Hedge Funds Are Making Their Biggest Bet Glimmer of Gold: Why Hedge Funds Are Making Their Biggest Bullish Bet in Months
In the complex and often turbulent theater of global finance, the movements of so-called "smart money" are watched with an eagle's eye. When these sophisticated players, particularly hedge funds, move in concert, it often signals a fundamental shift in market sentiment. Recently, a powerful signal has emerged from the depths of the commodities market: hedge funds have dramatically increased their bullish bets on gold, pushing their net long positions to a 16-week high. This aggressive positioning is not a random fluctuation; it is a calculated response to a potent cocktail of persistent geopolitical instability, simmering trade tensions, and a growing conviction that the global economic landscape is tilting in favor of the ultimate safe-haven asset.
The surge in bullish sentiment represents a significant vote of confidence in the yellow metal. It suggests that some of the world's most well-resourced and analytically driven investors are looking past the daily noise of equity markets and are instead positioning themselves for a future where security, stability, and tangible value take precedence. They are not merely dipping their toes in the water; they are making a decisive, leveraged bet that the forces buffeting the global economy will continue to drive capital towards gold's enduring allure. This move has sent ripples across the financial world, prompting investors of all stripes to ask a critical question: What does the smart money see that we should be paying attention to?
Decoding the Data: A Sharp Turn Towards Bullishness
To understand the magnitude of this shift, one must look to the weekly Commitments of Traders (COT) report published by the U.S. Commodity Futures Trading Commission (CFTC). This report provides a detailed breakdown of positions in the futures markets, separating traders into different categories, including "Managed Money." This category, which primarily consists of hedge funds and commodity trading advisors, is a key barometer for speculative sentiment.
The latest data reveals a sharp and decisive increase in bullish conviction. Hedge funds significantly ramped up their gross long positions—outright bets that the price of gold will rise. Simultaneously, they have been closing out their short positions—bets that the price will fall. The combination of these two actions has a powerful magnifying effect on the "net long" position, which is the difference between the number of long and short contracts.
Reaching a 16-week high is particularly noteworthy. It indicates a reversal of previous caution or bearishness and the establishment of a new, more aggressive bullish trend. For months, hedge funds may have been hesitant, weighing the prospects of higher-for-longer interest rates against emerging geopolitical risks. The current data shows that the scales have tipped decisively. This isn't a gradual accumulation; it's a forceful pivot, suggesting a high degree of conviction in the upside potential for gold. This influx of speculative capital acts as a powerful tailwind for the gold price, creating upward pressure as more funds chase the emerging momentum.
The Three Pillars of the Golden Thesis
The coordinated move by hedge funds is not based on a single factor but on a confluence of three powerful, interlocking macro-economic and geopolitical narratives. Each pillar reinforces the others, creating a compelling case for holding gold.
1. The Unsettled World: Geopolitical Risk as a Prime Catalyst
Gold has, for millennia, served as the ultimate barometer of fear. In times of peace and prosperity, its appeal can wane in favor of assets that offer growth and yield. But in an environment of escalating geopolitical tension, its value proposition becomes unparalleled. The current global landscape is rife with such tensions.
Persistent conflicts in key regions continue to create uncertainty, threatening to disrupt energy supplies, shipping lanes, and international relations. The risk of these conflicts widening or drawing in other powers keeps a floor under the demand for haven assets. Beyond active conflicts, the world is witnessing a broader realignment of global power. The rise of multi-polarity and the challenging of the post-Cold War order create a backdrop of systemic instability.
Furthermore, political uncertainty within major economies adds another layer of risk. Election cycles in dominant nations can lead to unpredictable policy shifts on everything from trade and taxation to international alliances. This policy uncertainty makes investors nervous, prompting them to allocate capital to assets that are insulated from the whims of any single government or political outcome. Gold, being a stateless monetary asset with no counterparty risk, is the natural recipient of these capital flows. Hedge funds are betting that these geopolitical undercurrents will not only persist but potentially intensify, making gold an essential portfolio hedge.
2. The Friction of Trade: A Drag on Global Growth
The era of seamless globalization has given way to a period of strategic competition and trade friction. The ongoing trade disputes between the world's largest economic blocs, most notably the United States and China, have moved beyond mere rhetoric and are now an entrenched feature of the global economy. Tariffs, export controls, and national security-driven industrial policies are disrupting long-established supply chains and creating a more fragmented and less efficient global marketplace.
This environment is a significant headwind for global economic growth. The uncertainty surrounding trade policy makes it difficult for businesses to make long-term investment decisions, dampening corporate spending and hiring. Slower global trade directly translates to slower economic growth, which in turn puts pressure on corporate earnings and equity valuations.
In this context, gold shines. As an asset that does not rely on economic growth to generate returns, it acts as a valuable diversifier in a portfolio dominated by stocks and bonds. When growth falters, gold's role as a store of value becomes more pronounced. Hedge funds are positioning for a scenario where persistent trade tensions continue to weigh on the global economy, making riskier assets less attractive and defensive assets like gold more appealing.
3. The Central Bank Pivot: Anticipating Looser Money
Perhaps the most powerful financial driver for gold is the outlook for monetary policy, particularly from the U.S. Federal Reserve. The price of gold has an inverse relationship with real interest rates (interest rates minus inflation). When real rates are high, the opportunity cost of holding a non-yielding asset like gold is also high, as investors can earn a handsome, risk-free return in government bonds. Conversely, when real rates are low or falling, the opportunity cost of holding gold diminishes, making it a more attractive investment.
For the past couple of years, central banks have been in a fierce battle against inflation, raising interest rates at an aggressive pace. However, the market is now increasingly looking ahead to the next phase of the cycle: rate cuts. While the timing is still a matter of debate, the consensus is that the next major policy move from the Fed and other major central banks will be to lower rates to support a slowing economy.
Hedge funds are front-running this anticipated pivot. They are accumulating gold now in expectation that falling interest rates in the future will provide a significant tailwind for its price. Even before the cuts materialize, the mere expectation of looser monetary policy is enough to fuel a rally. Furthermore, there is a persistent fear that central banks might make a policy error—either by keeping rates too high for too long and triggering a deep recession, or by cutting rates too soon and allowing inflation to become re-anchored. Either scenario is bullish for gold, which performs well during both economic downturns and periods of high inflation.
This speculative demand from hedge funds is layered on top of a powerful, long-term structural trend: voracious buying from the world's central banks. For several years, central banks, particularly those in emerging markets like China, India, and Turkey, have been steadily diversifying their foreign reserves away from the U.S. dollar and into physical gold. This "de-dollarization" trend is a strategic move to reduce dependence on the U.S. financial system and to hold a neutral reserve asset in an increasingly fractured world. This consistent, price-insensitive buying from official institutions creates a strong and stable floor of demand for gold, providing hedge funds with the confidence to build their own large, speculative positions on top of it.
Conclusion: A Resounding Vote for a Golden Future
The sharp increase in bullish gold bets by hedge funds is more than just a statistic; it is a story about risk, fear, and the search for security in an uncertain world. It reflects a growing consensus among sophisticated investors that the confluence of geopolitical turmoil, economic friction, and an impending shift in monetary policy has created a uniquely favorable environment for the precious metal.
These funds are acting as canaries in the coal mine, signaling a potential increase in market volatility and a flight to safety. Their aggressive positioning, backed by billions of dollars in capital, can become a self-fulfilling prophecy, driving prices higher and drawing in more waves of investors. As the world continues to grapple with deep-seated structural changes, the decision by the "smart money" to make its largest bullish wager on gold in months is a clear and resounding signal: in the quest for a safe harbor, all that glitters is, once again, gold.

BEAR TREND COMMING FOR GOLD trader in 28.july . 2025
XAUUSD : in my expectation and analysis i tend to see gold to make bear run for short to med term ,, target 2850 USD
good luck

Bullish bounce for the Silver?The price is falling towards the support level whch i anoverlap support that is slighly below the 61.8%Fibonacci retraecment and could bounce from this level to our takeprofit.
Entry: 37.24
Why we like it:
There is an overlap support that is slightly below the 61.8% Fibonacci retracement.
Stop loss: 36.28
Why we like it:
There is a swing low support that aligns with the 161.8% Fibonacci extension.
Take profit: 39.05
Why we like it:
There is a pullback resistance.
Enjoying your TradingView experience? Review us!
Please be advised that the information presented on TradingView is provided to Vantage (‘Vantage Global Limited’, ‘we’) by a third-party provider (‘Everest Fortune Group’). Please be reminded that you are solely responsible for the trading decisions on your account. There is a very high degree of risk involved in trading. Any information and/or content is intended entirely for research, educational and informational purposes only and does not constitute investment or consultation advice or investment strategy. The information is not tailored to the investment needs of any specific person and therefore does not involve a consideration of any of the investment objectives, financial situation or needs of any viewer that may receive it. Kindly also note that past performance is not a reliable indicator of future results. Actual results may differ materially from those anticipated in forward-looking or past performance statements. We assume no liability as to the accuracy or completeness of any of the information and/or content provided herein and the Company cannot be held responsible for any omission, mistake nor for any loss or damage including without limitation to any loss of profit which may arise from reliance on any information supplied by Everest Fortune Group.

Bearish reversal?XAU/USD is rising towards the resistance level, which serves as a pullback resistance and could drop from this level to our take-profit target.
Entry: 3,319.22
Why we like it:
There is a pullback resistance.
Stop loss: 3,354.19
Why we like it:
There is a pullback resistance that aligns with the 38.2% Fibonacci retracement.
Take profit: 3,271.39
Why we like it:
There is a swing low support that lines up with the 127.2% Fibonacci extension.
Enjoying your TradingView experience? Review us!
Please be advised that the information presented on TradingView is provided to Vantage (‘Vantage Global Limited’, ‘we’) by a third-party provider (‘Everest Fortune Group’). Please be reminded that you are solely responsible for the trading decisions on your account. There is a very high degree of risk involved in trading. Any information and/or content is intended entirely for research, educational and informational purposes only and does not constitute investment or consultation advice or investment strategy. The information is not tailored to the investment needs of any specific person and therefore does not involve a consideration of any of the investment objectives, financial situation or needs of any viewer that may receive it. Kindly also note that past performance is not a reliable indicator of future results. Actual results may differ materially from those anticipated in forward-looking or past performance statements. We assume no liability as to the accuracy or completeness of any of the information and/or content provided herein and the Company cannot be held responsible for any omission, mistake nor for any loss or damage including without limitation to any loss of profit which may arise from reliance on any information supplied by Everest Fortune Group.

GOLD ROUTE MAP UPDATEHey Everyone,
Please see update on our 1H chart route map.
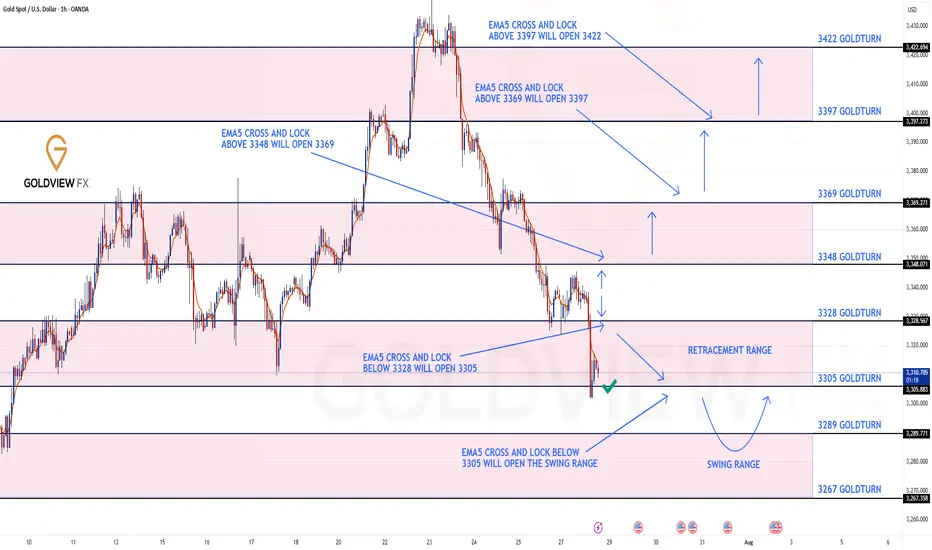
Gold continued its bearish momentum into today, hitting our bearish target at 3238, while leaving the 3348 bullish gap still open.
After a break below 3328, price followed through and hit 3305, entering our key retracement range, which gave the bounce to manage any premature positions on the top. We’re now watching closely for a reaction at this level.
A clean EMA5 cross and lock below 3305 will open the path toward the swing range.
However, failure to lock below this level could trigger a bounce from here.
This is a pivotal area for the next directional move.
We will keep the above in mind when taking buys from dips. Our updated levels and weighted levels will allow us to track the movement down and then catch bounces up.
We will continue to buy dips using our support levels taking 20 to 40 pips. As stated before each of our level structures give 20 to 40 pip bounces, which is enough for a nice entry and exit. If you back test the levels we shared every week for the past 24 months, you can see how effectively they were used to trade with or against short/mid term swings and trends.
The swing range give bigger bounces then our weighted levels that's the difference between weighted levels and swing ranges.
BULLISH TARGET
3348
EMA5 CROSS AND LOCK ABOVE 3348 WILL OPEN THE FOLLOWING BULLISH TARGETS
3369
EMA5 CROSS AND LOCK ABOVE 3369 WILL OPEN THE FOLLOWING BULLISH TARGET
3397
EMA5 CROSS AND LOCK ABOVE 3397 WILL OPEN THE FOLLOWING BULLISH TARGET
3422
BEARISH TARGETS
3328 - DONE
EMA5 CROSS AND LOCK BELOW 3328 WILL OPEN THE FOLLOWING BEARISH TARGET
3305 - DONE
EMA5 CROSS AND LOCK BELOW 3305 WILL OPEN THE SWING RANGE
3289
3267
As always, we will keep you all updated with regular updates throughout the week and how we manage the active ideas and setups. Thank you all for your likes, comments and follows, we really appreciate it!
Mr Gold
GoldViewFX
Analysis for the next week (XAUUSD) Hello Traders, Happy Weekend.
The market is going to open tonight, As you see the down trend is running, the price is falling like a waterfall.
Now the market is on the support area according to H1 & H4 TimeFrame.
The market is respecting the support area and there is a Trend line support according to D1 TimeFrame.
The market is respecting the Trend line and support area.
According to my analysis gold will drop till 3287 to 3271.
If gold fly, it can fly till 3350 then it will fall.
Stay tune for update.
Kindly share your views and leave positive comments here, Thanks.