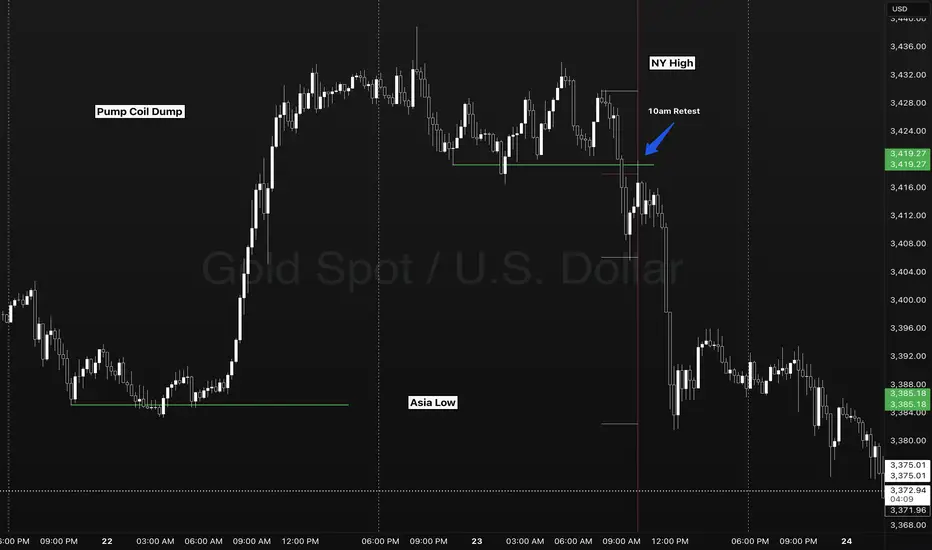
Gold two session setups - Timings Levels Behavior of PriceIn this example we see FOREXCOM:XAUUSD forming a simple and scalable setup interacting with key session levels and key times of day.
- 4HR OPEN CLOSE (10:00am)
- SESSION TIME RANGES
- DAILY HIGH/LOW
- SESSION HIGH/LOW
Here on my chart I use no lagging indicators. A previous session ranges high and low represents the major liquidity levels. A classic break and retest going into the NY session took place at 10:00am offering a parabolic opportunity back to a previous days session low.
SIMPLICITY IS KEY. Stay away from trading gaps, sweeps, hunts, soups on the inside of a high and low. The market only does two things.
- Breakout, fail, reverse.
- Breakout, pullback, continue.
Its important to be on a higher time frame to capture multiple sessions of liquidity areas. As a new trader I found looking to take a trade instead of waiting for a setup. 1 minute charts with multiple moving averages, oscillators, macd. Essentially a science project! Keep it simple traders. Patience pays. Timing, levels, behavior of price.
Commodities
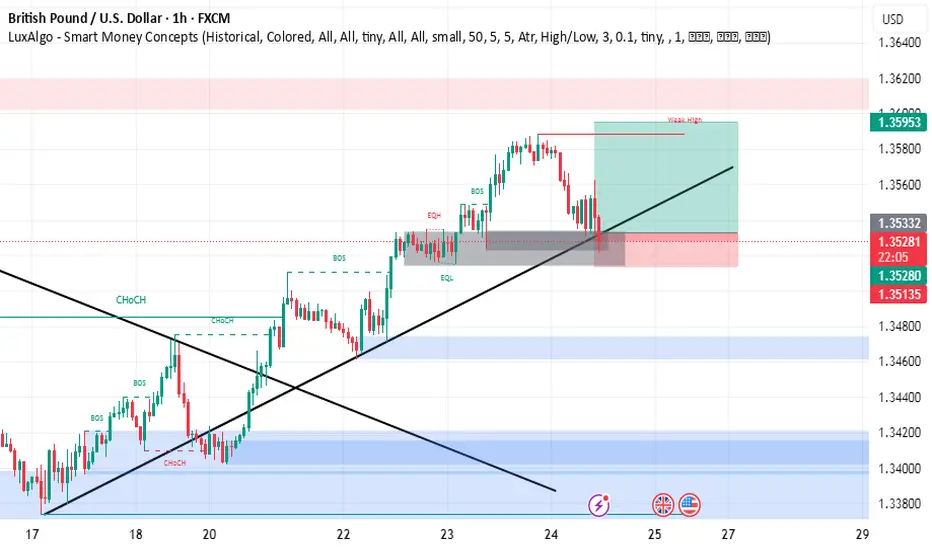
GBPUSD buy setupsimply
this is 6 deals after 5 CONSECUTIVE WINNING traders
we have demand
uptrend
the price can't make lower low
and make more candle in the area with more rejection
so the price will go up
be careful on your risk money management
BEST WISHES
The callback is coming to an end, don't chase the short easily#XAUUSD
The long positions held last night have already left the market at a loss😔. After the Asian session opened, I continued to watch the trend of gold, but it did not effectively rebound to the ideal target area. After repeatedly testing around 3393, I chose to manually exit the market📀.
Gold is currently somewhat overcorrected, with the hourly line falling into severe oversold territory📉. But the market will eventually return to the bullish trend🐂. Why do I say that? First, there are less than 8 days left before the final deadline for tariffs. Second, the Federal Reserve’s interest rate cut is also approaching. In the medium and long term, there is definitely no problem with being bullish. There will be initial jobless claims data later, which will affect the trend of gold today. We need to pay some attention to it👀.
From the daily line, the current Bollinger Band middle track is near the 3343 line, and the SMA60 moving average is near the 3330 below. In the short term, the downward momentum of gold is released, and it is expected to test the 3343 mid-line support below💪.
📊Therefore, we can consider going long again at 3360-3343 below and look towards 3375-3385. Short-term losses don’t mean anything. With the recent frequent news fluctuations, we still have a good chance to turn losses into profits🚀.
🚀BUY 3360-3350
🚀TP 3375-3385
From 3,430 USD GOLD falls below 3,400 USD on optimistic newsOANDA:XAUUSD has suffered a sharp sell-off after rising sharply earlier in the week. Media reports said the United States and the European Union were getting closer to reaching a tariff deal, and the news weighed on safe-haven demand.
OANDA:XAUUSD fell below $3,400 an ounce on Wednesday, down more than 1.2%, following news that the United States and the European Union were close to signing a deal similar to the one Washington and Tokyo signed on Tuesday. It is now trading below that key base point.
The European Union and the United States are moving toward a trade deal that could see more EU goods hit with a 15 percent U.S. import tariff, two diplomats said. Earlier, U.S. President Donald Trump reached a trade deal with Japan that would cut auto tariffs to 15 percent.
Optimism about an imminent U.S.-EU trade deal overshadowed a decline in the U.S. dollar. The U.S. dollar index (DXY), which measures the greenback against a basket of six currencies, fell 0.05 percent on the day to 97.160.
U.S. Treasury yields rose, with the 10-year Treasury yield rising to 4.396%. U.S. real yields, calculated by subtracting inflation expectations from nominal yields, rose nearly 4 basis points to 1.994%.
Gold tends to gain in value during times of uncertainty and low-interest-rate environments because gold itself does not generate interest, and in low-interest-rate environments, the opportunity cost of holding gold is relatively low.
U.S., EU near trade deal
The Financial Times reported on Wednesday that the European Union and the United States are close to reaching a trade deal that would impose a 15% tariff on imports from Europe, similar to the one reached between US President Donald Trump and Japan this week.
The Financial Times reported that Brussels is likely to agree to so-called “reciprocal tariffs” to avoid tariffs that Trump has threatened to impose on EU goods of up to 30% from August 1.
“The agreement reached with Japan is clearly extortionate in terms. Most member states are swallowing their anger and are likely to accept the deal,” an EU diplomat said.
The two sides will exempt some products, including aircraft, spirits and medical equipment, from tariffs.
The agreement between the US and Japan has also left Brussels reluctant to accept higher reciprocal tariffs to avoid a damaging trade war, according to the Financial Times.
Technical Outlook Analysis OANDA:XAUUSD
On the daily chart, after gold reached its target at $3,430, it failed to break above this important resistance level and fell slightly. The decline brought gold back to test the support confluence area, which is the location of the 0.236% Fibonacci retracement with the lower edge of the price channel. And with the current position, gold still technically has enough conditions for a possible increase in price.
Specifically, gold is still in/above the supports from the short-term price channel, the long-term rising price channel and the support from the EMA21, as long as gold is still trading above the EMA21, it still has a bullish outlook in the short term. On the other hand, the short-term target is still at 3,430 USD, while once the 3,430 USD level is broken, it will provide the possibility of further upside with the next target at around 3,450 USD in the short term, more than the all-time high.
RSI remains above 50, far from the 80 – 100 area (overbought area). Showing that there is still a lot of room for upside ahead.
During the day, the technical outlook for gold prices continues to favor upside and notable positions will be listed as follows.
Support: 3,371 – 3,350 USD
Resistance: 3,400 – 3,430 – 3,450 USD
SELL XAUUSD PRICE 3421 - 3419⚡️
↠↠ Stop Loss 3425
→Take Profit 1 3413
↨
→Take Profit 2 3407
BUY XAUUSD PRICE 3354 - 3356⚡️
↠↠ Stop Loss 3350
→Take Profit 1 3362
↨
→Take Profit 2 3368
GOLD - Price can make correction and then bounce upHi guys, this is my overview for XAUUSD, feel free to check it and write your feedback in comments👊
The price has been developing within a broadening wedge formation for some time.
This pattern began after the asset found strong support in the key zone around the $3305 level.
Within this structure, buyers recently pushed the price upwards in a notable impulse wave.
This impulse culminated in a test of the wedge's upper boundary and the resistance area near $3430.
After being rejected from that resistance, the price is now in a corrective decline towards the lower trendline.
I expect that this correction will find its footing on the lower boundary, leading to a rebound and a new rally towards the $3430 resistance.
If this post is useful to you, you can support me with like/boost and advice in comments❤️
Disclaimer: As part of ThinkMarkets’ Influencer Program, I am sponsored to share and publish their charts in my analysis.

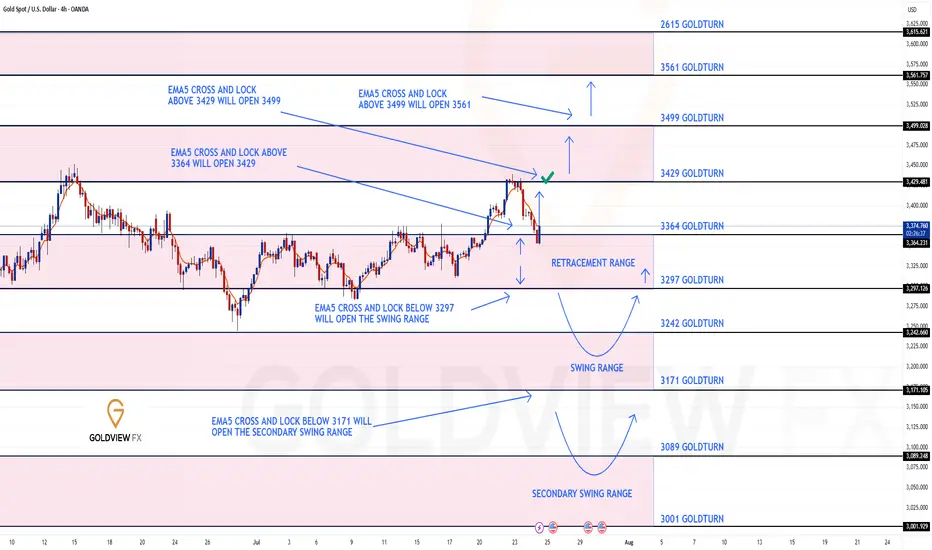
GOLD 4H CHART ROUTE MAP UPDATEHey Everyone,
After completing our 1h chart idea update yesterday, please see our 4chart idea also played out to perfection!!!
We started with our Bullish target hit at 3364 followed with ema5 cross and lock opening 3429. This was also hit perfectly with no further cross and lock above 3429 confirming the perfect rejection.
We are now seeing price play into the retracement zone and will continue to look for reactions on the lower Goldturn, inline with our plans to buy dips.
We will keep the above in mind when taking buys from dips. Our updated levels and weighted levels will allow us to track the movement down and then catch bounces up.
We will continue to buy dips using our support levels taking 20 to 40 pips. As stated before each of our level structures give 20 to 40 pip bounces, which is enough for a nice entry and exit. If you back test the levels we shared every week for the past 24 months, you can see how effectively they were used to trade with or against short/mid term swings and trends.
The swing range give bigger bounces then our weighted levels that's the difference between weighted levels and swing ranges.
BULLISH TARGET
3364 - DONE
EMA5 CROSS AND LOCK ABOVE 3364 WILL OPEN THE FOLLOWING BULLISH TARGETS
3429 - DONE
EMA5 CROSS AND LOCK ABOVE 3429 WILL OPEN THE FOLLOWING BULLISH TARGET
3499
EMA5 CROSS AND LOCK ABOVE 3499 WILL OPEN THE FOLLOWING BULLISH TARGET
3561
BEARISH TARGETS
3297
EMA5 CROSS AND LOCK BELOW 3297 WILL OPEN THE SWING RANGE
3242
3171
EMA5 CROSS AND LOCK BELOW 3171 WILL OPEN THE SECONDARY SWING RANGE
3089
3001
As always, we will keep you all updated with regular updates throughout the week and how we manage the active ideas and setups. Thank you all for your likes, comments and follows, we really appreciate it!
Mr Gold
GoldViewFX
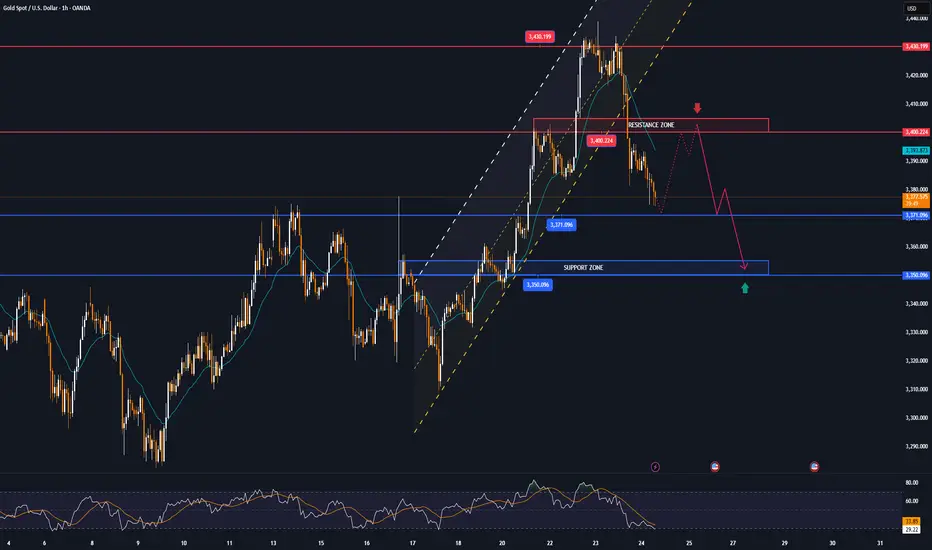
Correction in Play, Long-Term BUY Opportunity Ahead XAUUSD 24/07 – Correction in Play, Long-Term BUY Opportunity Ahead
🧭 Market Outlook
Gold has dropped sharply from the 343x region, exactly as outlined in yesterday’s plan. Price has broken below the ascending trendline on the H1 chart and is now tapping into lower liquidity zones (FVG + OBS), signaling continuation of the short-term bearish move.
Key context to watch:
Traders are awaiting final decisions on US global trade policy agreements.
Next week’s FOMC meeting may confirm expectations of an interest rate cut.
Later today, markets will react to US PMI data and Jobless Claims, which could trigger volatility.
📊 Technical View
While the higher timeframe trend (D1/H4) remains bullish, the short-term structure has broken, and the market is now exploring unfilled liquidity pools below. Once these are swept, we anticipate a strong long-term BUY opportunity.
🎯 Trading Plan for Today
📌 Short-Term Strategy:
Look for short-term SELL setups on retracements toward resistance zones. Wait for clear rejection signals before entering.
📌 Mid/Long-Term Strategy:
Prepare to BUY from major Key Levels once price taps into deep liquidity zones. Ensure confluence and good risk/reward before entering.
🔎 Key Levels to Watch
🔺 Upper Resistance Zones:
3393 – 3404 – 3414 – 3420 – 3428
🔻 Lower Support Zones:
3375 – 3366 – 3352 – 3345 – 3330
🔽 Trade Setups
✅ BUY ZONE: 3352 – 3350
SL: 3345
TP: 3356 → 3360 → 3364 → 3370 → 3375 → 3380 → 3390 → 3400
🔻 SELL ZONE: 3414 – 3416
SL: 3420
TP: 3410 → 3406 → 3400 → 3395 → 3390 → 3380
⚠️ Risk Reminder
No major economic news is scheduled for today, but unexpected political statements or geopolitical tensions could cause price spikes.
✔️ Always follow your SL/TP strictly.
✔️ Avoid entering without solid confirmation.
✔️ Watch how price reacts to the levels above.
📣 Follow MMF on TradingView
If this trading roadmap helps your strategy,
📌 Follow the MMF team on TradingView for daily actionable setups, real levels, and no-nonsense analysis based on real market conditions.
🎯 Real trades. Real zones. Real discipline.

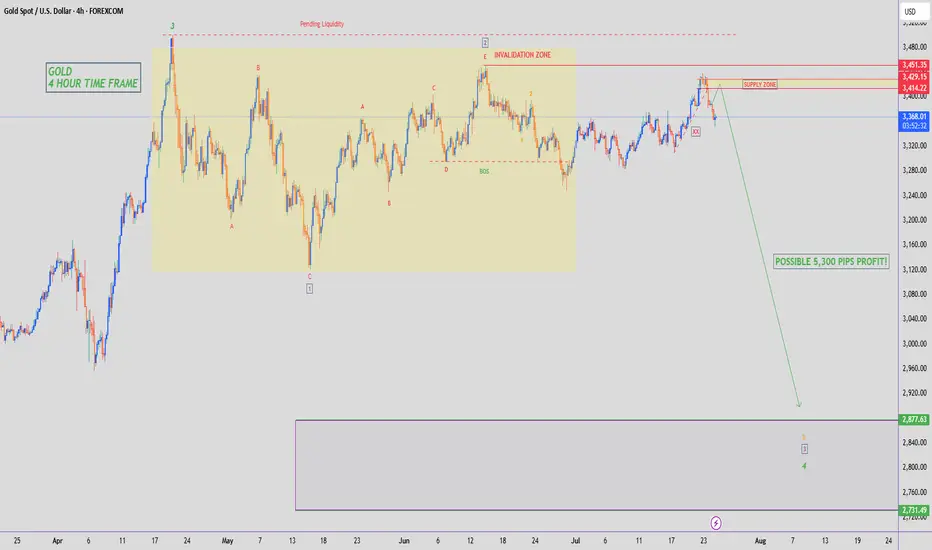
GOLD - SHORT TO $2,880 (UPDATE)Beautiful melt overnight, with Gold down close to 400 PIPS so far. Zoom in to the left & you'll see I've also added in a trendline which sellers have now start taking out. Another strong confluence of sellers taking control.
I warned you all last night not to sleep on Gold. My Gold Fund investors are in deep profits😉
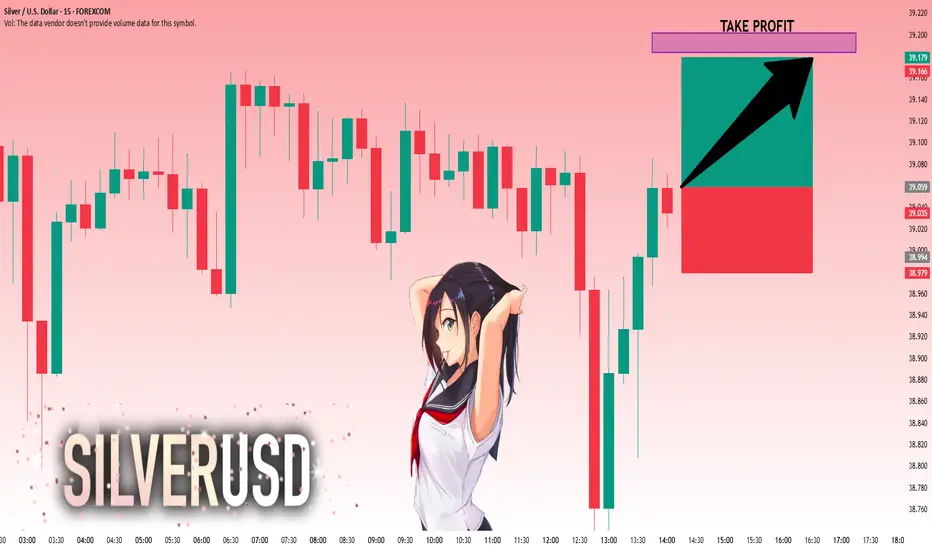
SILVER: Bulls Are Winning! Long!
My dear friends,
Today we will analyse SILVER together☺️
The market is at an inflection zone and price has now reached an area around 39.025 where previous reversals or breakouts have occurred.And a price reaction that we are seeing on multiple timeframes here could signal the next move up so we can enter on confirmation, and target the next key level of 39.148.Stop-loss is recommended beyond the inflection zone.
❤️Sending you lots of Love and Hugs❤️
GOLD: Target Is Down! Short!
My dear friends,
Today we will analyse GOLD together☺️
The recent price action suggests a shift in mid-term momentum. A break below the current local range around 3,359.59 will confirm the new direction downwards with the target being the next key level of 3,350.22.and a reconvened placement of a stop-loss beyond the range.
❤️Sending you lots of Love and Hugs❤️
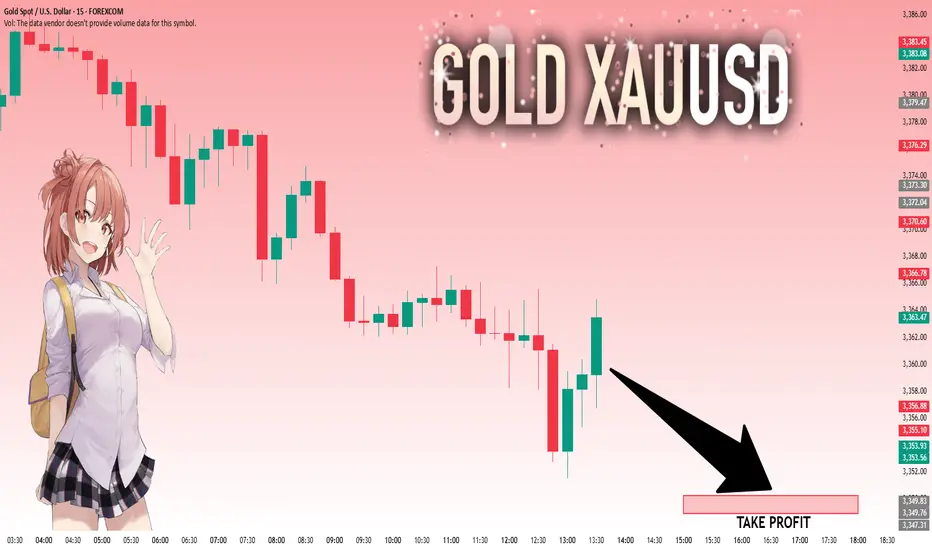
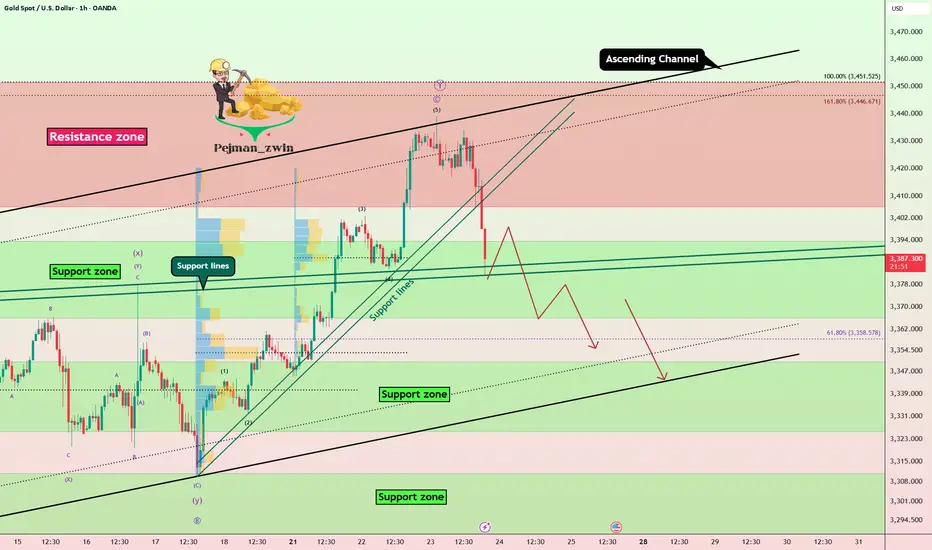
Gold Fails at Resistance, Elliott Wave Signals Deeper CorrectionGold ( OANDA:XAUUSD ) started to rise after the Richmond Manufacturing Index(Actual:-20/Forecast:-2/Previous-7) index was announced, but failed to break the upper line of the ascending channel and the Resistance zone($3,451-$3,406) .
Gold has now broken through the Support lines and is attempting to break through the next Support lines and Support zone($3,394-$3,366) .
In terms of Elliott Wave theory , it appears that the main wave Y has completed above the ascending channel.
I expect that given the momentum of gold's decline , gold will be able to break the Support zone($3,394-$3,366) and Support lines and fall to at least $3,356 . The next target could be the lower line of the ascending channel .
Note: Stop Loss (SL) = $3,423
Gold Analyze (XAUUSD), 1-hour time frame.
Be sure to follow the updated ideas.
Do not forget to put a Stop loss for your positions (For every position you want to open).
Please follow your strategy; this is just my idea, and I will gladly see your ideas in this post.
Please do not forget the ✅ ' like ' ✅ button 🙏😊 & Share it with your friends; thanks, and Trade safe.
BULLISH ON GOLDPrice is in Daily FVG and bearish momentum starts slowing down on 1H Timeframe. Entry off London Low sweep with rejection.

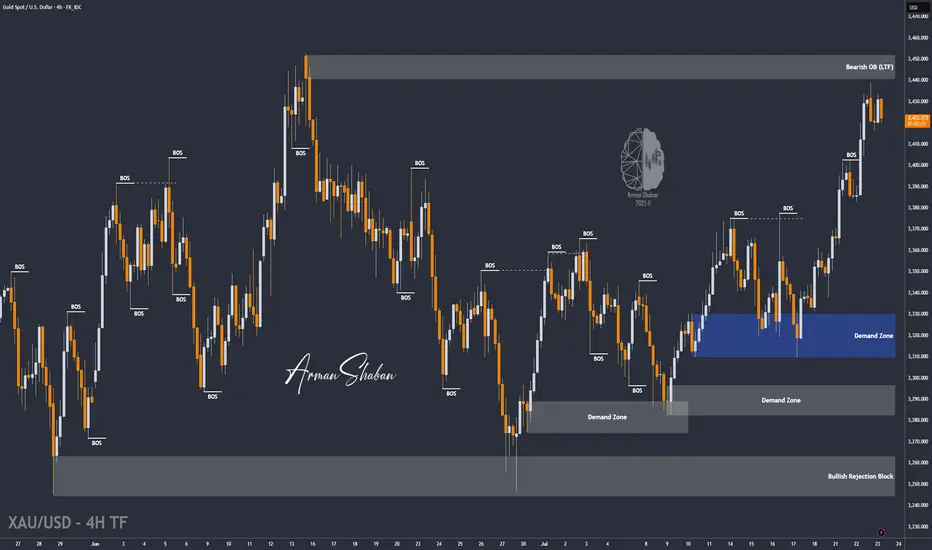
XAU/USD | Watching for Potential Drop Toward $3391! (READ)By analyzing the gold chart on the 4-hour timeframe, we can see that gold continued its bullish move after holding above $3409, successfully hitting the $3440 target and delivering over 200 pips in returns! After reaching this key supply zone, gold corrected down to $3415 and is now trading around $3421. If the price stabilizes below $3431, we can expect further downside movement, with the next bearish targets at $3415, $3404, and $3391. If this scenario fails, an alternative setup will be shared.
Please support me with your likes and comments to motivate me to share more analysis with you and share your opinion about the possible trend of this chart with me !
Best Regards , Arman Shaban
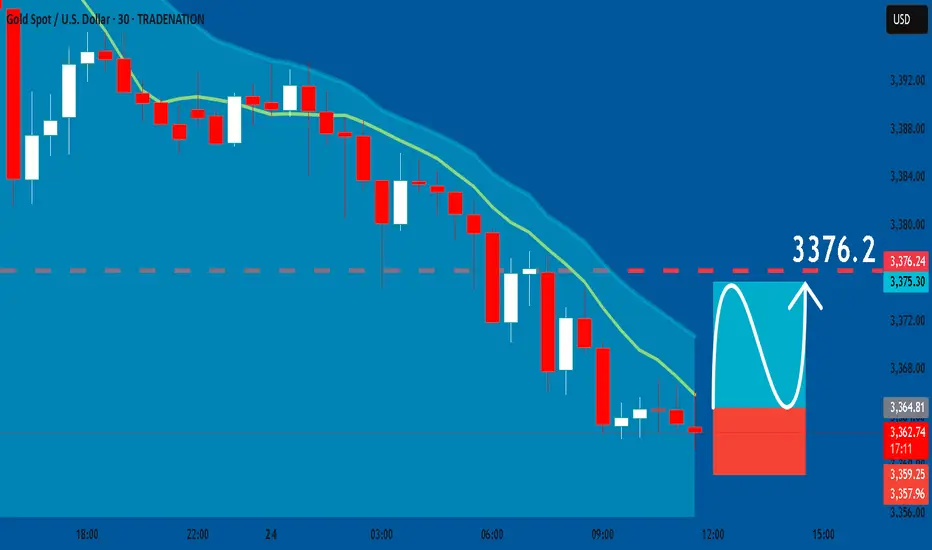
GOLD: Bullish Continuation & Long Signal
GOLD
- Classic bullish formation
- Our team expects growth
SUGGESTED TRADE:
Swing Trade
Buy GOLD
Entry Level - 3364.8
Sl - 3359.2
Tp - 3376.2
Our Risk - 1%
Start protection of your profits from lower levels
Disclosure: I am part of Trade Nation's Influencer program and receive a monthly fee for using their TradingView charts in my analysis.
❤️ Please, support our work with like & comment! ❤️
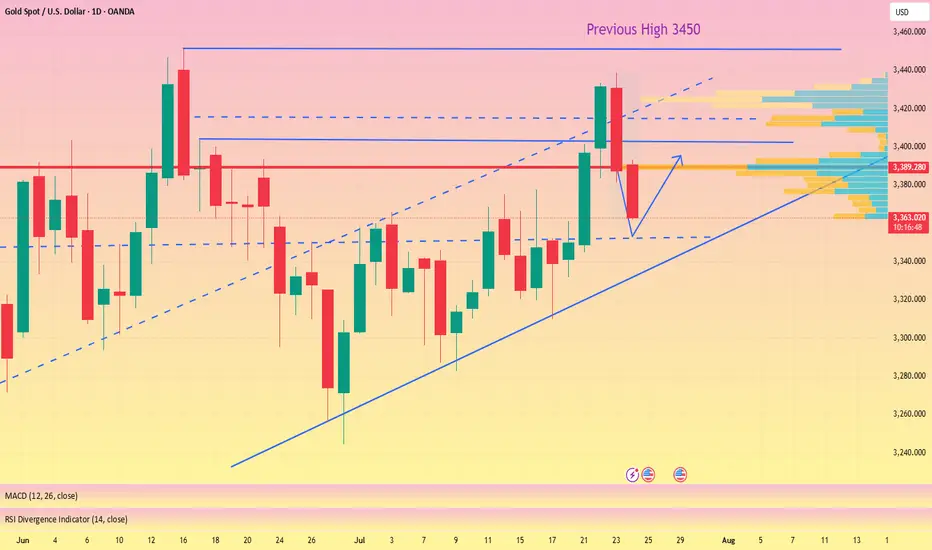
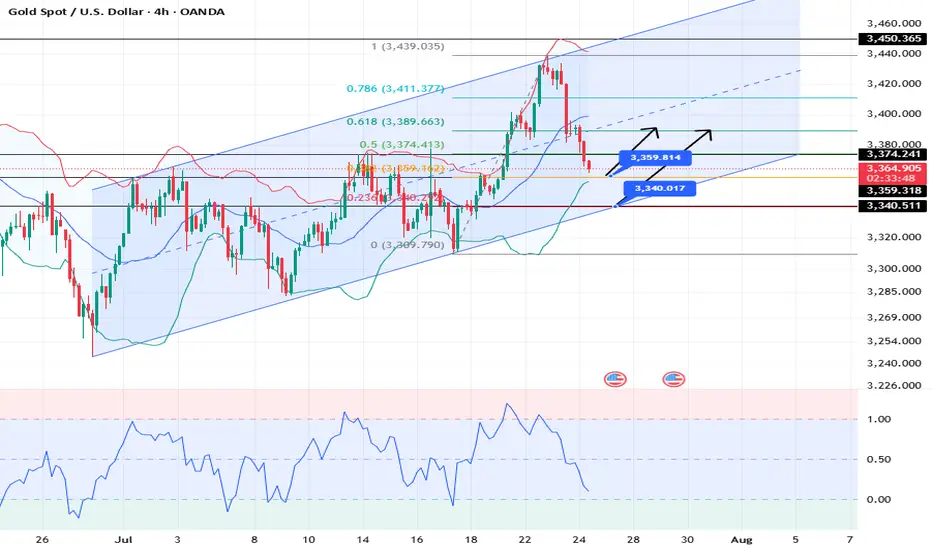
XAUUSD 24/07 Bullish Reversal Potential from Falling Channel1. Price Overview & Trendline Context
Gold (XAUUSD) is currently trading around 3,369.67 USD after a notable pullback from the recent high near 3,428. A clear descending channel has formed, marking a short-term corrective move within a larger bullish trend. Price action suggests a potential reversal setup as price approaches a strong support zone around 3,340 – 3,350 USD, previously acted as demand in the breakout on July 22.
2. Fibonacci & Structure Analysis
The Fibonacci retracement drawn from the recent swing low to the top at ~3,428 reveals that the pullback has reached the 0.9 level, often seen as an exhaustion point for corrections in strong bullish trends. This area aligns with:
Key horizontal support: 3,340 – 3,350
Previous breakout zone
Volume spike at base (20.6K vs avg.)
This convergence suggests a high-probability bullish reversal setup.
3. EMA & Momentum Indicators
Although the chart primarily uses SMA 9, the structure suggests price is extended from shorter EMAs. A break above the upper boundary of the falling channel may trigger EMA crossovers, further confirming reversal momentum.
4. Trading Strategy Suggestion
Setup
Description
Buy Zone: 3,350 – 3,365 USD
Take Profit 1: 3,385 USD (short-term supply zone)
Take Profit 2: 3,428 USD (recent swing high)
Stop Loss: Below 3,340 USD
This trade follows the "Buy the Dip in Uptrend" strategy, aligning with trendline, fib support, and volume confirmation.
5. Key Resistance & Support Levels
Resistance: 3,385 – 3,428 USD
Support: 3,340 – 3,350 USD
Breakout Confirmation Level: 3,375 (channel breakout)
6. Final Insights
Gold remains in a broader bullish structure. Today’s chart shows strong technical confluence for a short-term reversal. Traders should monitor closely for breakout candles from the falling wedge/channel, preferably with volume confirmation.

XAUUSD: Market analysis and strategy for July 24.Gold technical analysis:
Daily chart resistance 3440, support 3310
4-hour chart resistance 3390, support 3340
1-hour chart resistance 3375, support 3360.
Yesterday, according to news, the United States and the European Union were close to reaching a trade agreement, which led to the recent risk aversion sentiment to subside, and the bulls took profits. The gold price has fallen by nearly $80 from its peak.
From the current power comparison, the bears are temporarily dominant. Since yesterday, the candlestick chart of the 4-hour chart has completed 6 candles today (2 of which are sideways and 4 are falling sharply). It is expected that it will not rebound until today's NY market trading session.
Gold may reach 3359 or even 3340. At that time, we will observe the stabilization of the candlestick chart. Once the downward momentum is exhausted and it starts to close higher, we can buy. The upper pressure is 3380/3400.
Buy: 3359near
Buy: 3340near
Sell: 3380near
Sell: 3400near
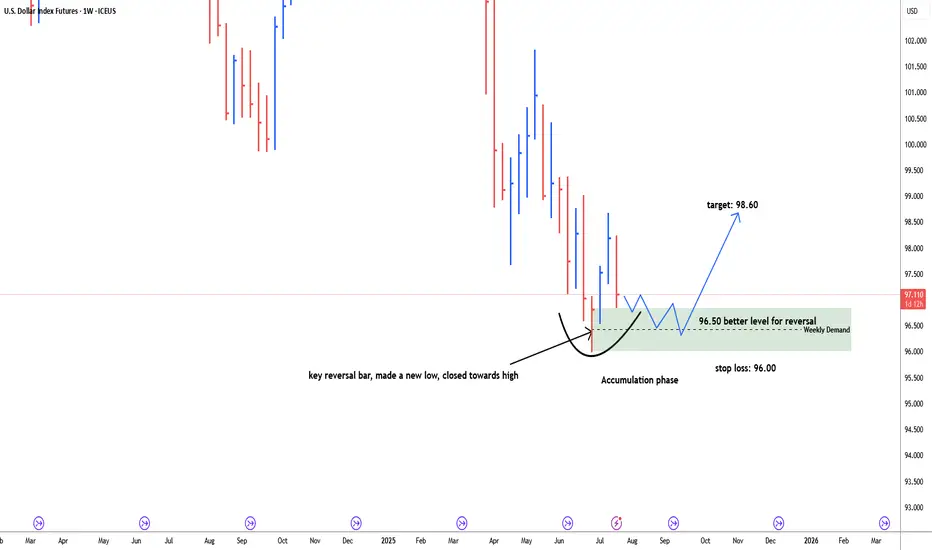
USD Dollar index possbile bullish reversal#usddollarindex, last weekly bar of the month of June is key reversal bar, made a new low and closed towards high. price retracing back down to test weekly demand zone. discount zone of demand is 96.50. possible bullish reversal target: 98.60. Stop loss below 96.00. price need time to build energy for bullish momentum. 96.50-96.00 is more secure level for long.
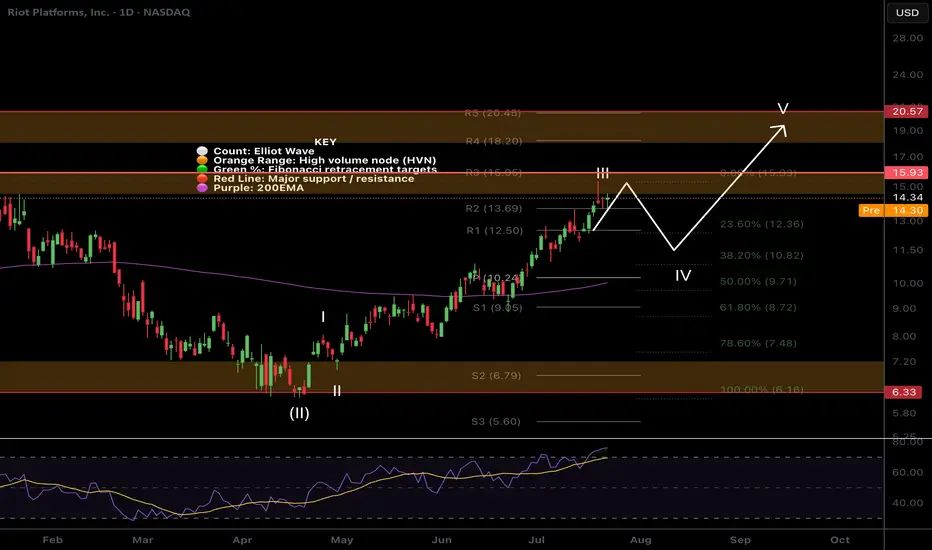
$RIOT Targets hitNASDAQ:RIOT has hit my take profit target at the High Volume Node and R3 daily pivot where it has found resistance.
Wave III appears to be complete with wave IV expected targets being the 0.382-0.5 Fibonacci retracement, also the daily pivot point and ascending daily 200EMA, $10.24.
Analysis is invalidated if we continue to the upside with a new swing high. RSI is overbought no bearish divergence.
Safe trading
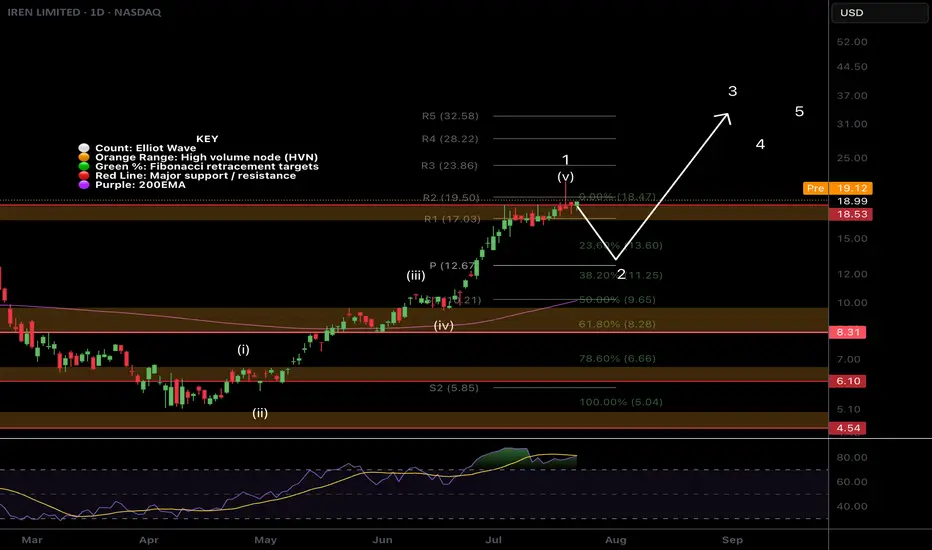
$IREN More downside after huge rally!NASDAQ:IREN is printing bearish divergence on the daily RSI at all tie high resistance.
An Elliot wave motif wave appears complete and wave looks underway with a shallow target of the daily pivot, 0.382 Fibonacci retracement and ascending daily 200EMA.
The daily red wick after printing a 20% start to the day is reminiscent of a blow off top in this asset trapping newbs with FOMO price discovery pump. Market behaviour in action!
Analysis is invalidated if price returns to all time high.
Safe trading
XAUUSD H1 I Bearish Reversal Based on the H1chart, the price is approaching our sell entry level at 3383.87, a pullback resistance.
Our take profit is set at 3360.61, a pullback support that aligns with the 61.8% Fib retracement.
The stop loss is set at 3402.30, a pullback resistance.
High Risk Investment Warning
Trading Forex/CFDs on margin carries a high level of risk and may not be suitable for all investors. Leverage can work against you.
Stratos Markets Limited (tradu.com ):
CFDs are complex instruments and come with a high risk of losing money rapidly due to leverage. 63% of retail investor accounts lose money when trading CFDs with this provider. You should consider whether you understand how CFDs work and whether you can afford to take the high risk of losing your money.
Stratos Europe Ltd (tradu.com ):
CFDs are complex instruments and come with a high risk of losing money rapidly due to leverage. 63% of retail investor accounts lose money when trading CFDs with this provider. You should consider whether you understand how CFDs work and whether you can afford to take the high risk of losing your money.
Stratos Global LLC (tradu.com ):
Losses can exceed deposits.
Please be advised that the information presented on TradingView is provided to Tradu (‘Company’, ‘we’) by a third-party provider (‘TFA Global Pte Ltd’). Please be reminded that you are solely responsible for the trading decisions on your account. There is a very high degree of risk involved in trading. Any information and/or content is intended entirely for research, educational and informational purposes only and does not constitute investment or consultation advice or investment strategy. The information is not tailored to the investment needs of any specific person and therefore does not involve a consideration of any of the investment objectives, financial situation or needs of any viewer that may receive it. Kindly also note that past performance is not a reliable indicator of future results. Actual results may differ materially from those anticipated in forward-looking or past performance statements. We assume no liability as to the accuracy or completeness of any of the information and/or content provided herein and the Company cannot be held responsible for any omission, mistake nor for any loss or damage including without limitation to any loss of profit which may arise from reliance on any information supplied by TFA Global Pte Ltd.
The speaker(s) is neither an employee, agent nor representative of Tradu and is therefore acting independently. The opinions given are their own, constitute general market commentary, and do not constitute the opinion or advice of Tradu or any form of personal or investment advice. Tradu neither endorses nor guarantees offerings of third-party speakers, nor is Tradu responsible for the content, veracity or opinions of third-party speakers, presenters or participants.

Gold. How to "kill" bull or bear (triangle)? 24/July/25XAUUSD. are you betting (gambling) OR trading for bull/bear triangle? With or without "active lost/cut lost"?.. No stop lost = passive (cut) lost = Let the "gambling" games end for you. Not you end the "trading" any time actively. The "happy ending" always come with good risk management with good risk/reward ratio where ONLY happened when we have T.P and S.L plans.

The Edge Of The Fork - The Joker In Your PocketWOW!
\ \ First of all, I want to say THANK YOU for all the boosts, follows, and comments. You guys & gals give me the energy to continue this journey with you.\ \
Today, I want to show you that what we’ve learned with horizontal lines can also be applied to "Medianlines," or Forks.
Listen, I don’t want you to blow your brain with all the rules.
Not at the beginning of this journey, and not later on either.
Don’t ask yourself:
* when to use which Fork
* which swing to measure
* when to trade
* where to set your stop
* what if... bla bla bla
That’s not fun — that’s stress.
I don’t like stress — nobody does.
So let’s just chill and have fun here.
That’s my personal reason for doing all this Trading thing. I want to have fun — the money will take care of itself, just like the destination of a trail takes care of itself, as long as I keep putting one foot in front of the other. And that’s simple, right?
So let’s do it exactly the same way.
Just simple steps, connecting some dots, and BAM! — You’re there before you even know it §8-)
\ Let’s jump to the chart:\
Today, you’ll find out why Medianlines/Forks are a cousin of the horizontal Channel — but NOT the same.
Where are they different?
Forks are different because they’re capable of projecting the most probable path of price. And that’s a HUGE difference.
Yes, you can apply the full rule set of Forks to a horizontal Channel.
But the Channel CANNOT project the most probable path of price.
I hear you, I hear you: "No one and nothing can foresee the future. How is it even possible that Forks can?"
\ Here’s why:\
There’s a thing called "Statistical Importance." And it means that if something happens very often in the same way, we have a higher chance of seeing the same behavior again in the future.
And that’s what the inventor, Allan Andrews, discovered — and he created the rules around his findings.
\ A high probability that price will move in the direction of the projected path, as long as it stays within the boundaries of the Medianlines/Fork.\
That’s the whole "magic" behind Medianlines/Forks.
And the same applies to the "Behavior of Price" within and around Medianlines. That’s really all there is to it.
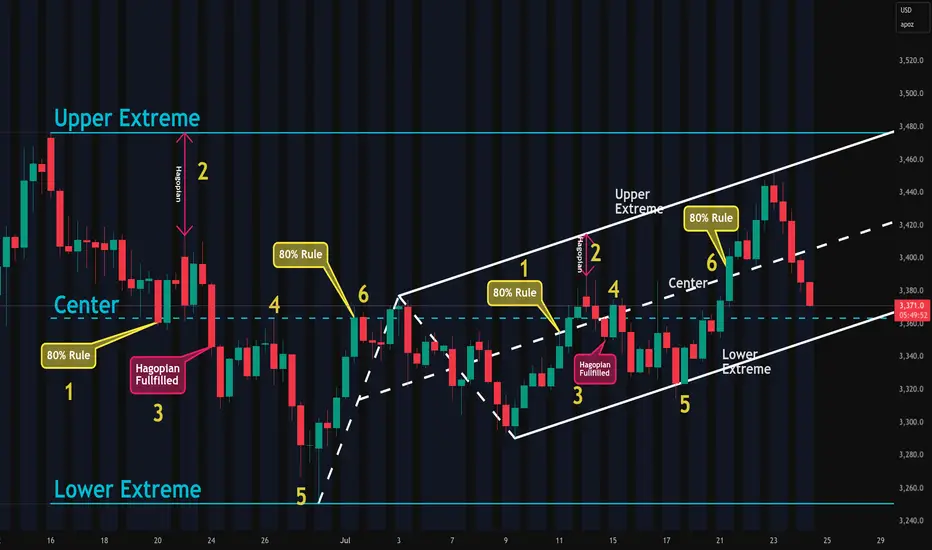
Look at the chart and compare the Channel and the Fork:
1. Price reaches the Centerline about 80% of the time
2. HAGOPIAN → price goes farther in the opposite direction than where it came from
3. HAGOPIAN’s rule fulfilled
4. Price reaches the Centerline again
5. Price reaches the other extreme
6. Price reaches the Centerline about 80% of the time
You’ll see the same behavior inside the Fork!
That’s beautiful, isn’t it? §8-)
And here’s a little Joker in your pocket — if you know the difference between the Channel and the Forks!
Do you know what it is?
Yep! You’d automatically know the direction to trade — giving you another 10% edge right out of the box — LONG TRADES ONLY. Because the Fork projects the most probable path of price to the upside, not down.
That's all folks §8-)
Like this lesson?
With a simple boost and/or a little comment, you load my Battery so I can continue my next step on the trail with you.
Thank you for spending your time with me §8-)
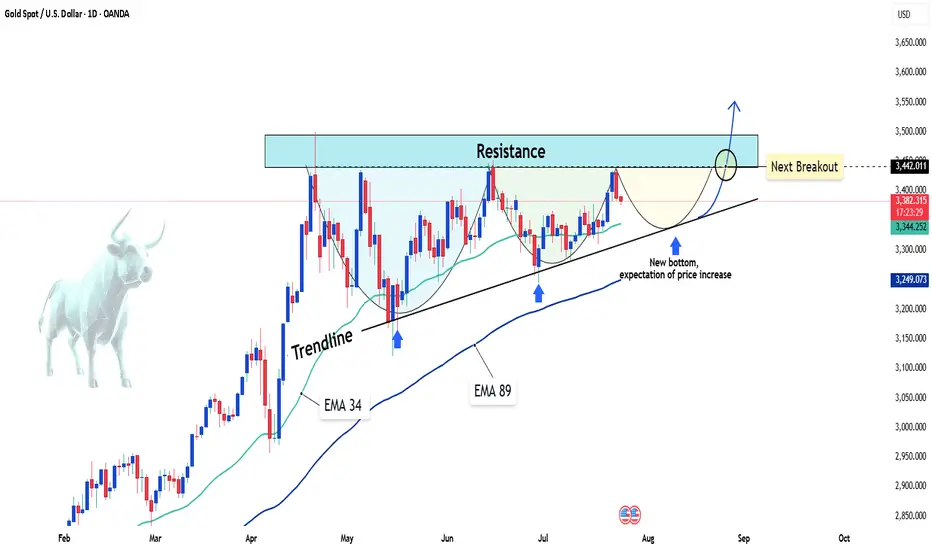
Gold sets sights on 3,500 USD – will the rally continue?Hello traders, do you think gold will keep rising?
Today, OANDA:XAUUSD is trading around 3,380 USD after a slight pullback from the 5-week high of 3,438 USD reached on Tuesday. Despite this short-term dip, the overall trend remains bullish, supported by both technical structures and market expectations.
On the news front, the US Dollar Index (DXY) has dropped to 97.4 – its lowest level in weeks. This reflects growing expectations that the Federal Reserve may cut interest rates by the end of the year, as recent data points to slowing inflation and weakening consumer spending. A softer dollar typically strengthens gold’s appeal.
From a technical perspective, the daily chart reveals a clear bullish structure supported by the rising trendline and the EMA34 and EMA89. Price is consolidating just above the trendline, forming a potential bullish continuation pattern. The resistance zone near 3,440 USD is being repeatedly tested – and if gold breaks out with strong volume, the path toward 3,500 USD could open up quickly.
From my perspective, I expect gold to make new highs above this level soon. What’s your take? Drop your thoughts in the comments!