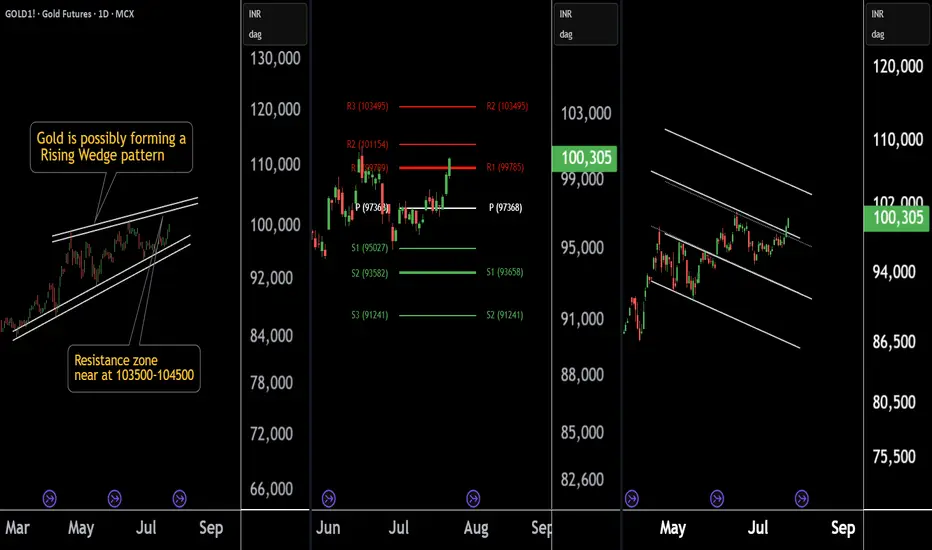
Gold at a Crossroad: Long or Short? Key Levels in FocusThere are three chart of Gold .
Gold1! is forming a Rising Wedge pattern, with resistance positioned between 103500-104000 levels.
Gold1! is facing Pivot Point resistance around the 103500 level, indicating potential supply pressure.
Gold1! is approaching the parallel channel resistance, and the upside move is nearly complete in percentage terms, with resistance around 103800-104000.
if this level sustain then we may see first of all higher prices then again fall in gold1!
Thank You !!
Commodities
Nifty Metal: Heating Up or Just Polishing the Armor?After a healthy consolidation phase, the Nifty Metal Index is finally starting to flex some muscle. While it’s been behaving like a shy warrior at a dance-off, the structure now looks technically stronger and poised for a potential bullish breakout.
We’ve seen two failed breakout attempts (clearly marked with trendlines)—both classic cases of “all hype, no flight.” But this time, after a tight range consolidation between July 9th and July 18th, it has stepped out of its shell and is teasing a real move.
Next resistance around ₹9,675—and maybe even beyond, if momentum supports the story.
Until then, sitting tight, sharpening the filters, and scouting for individual metal stocks showing relative strength!!!

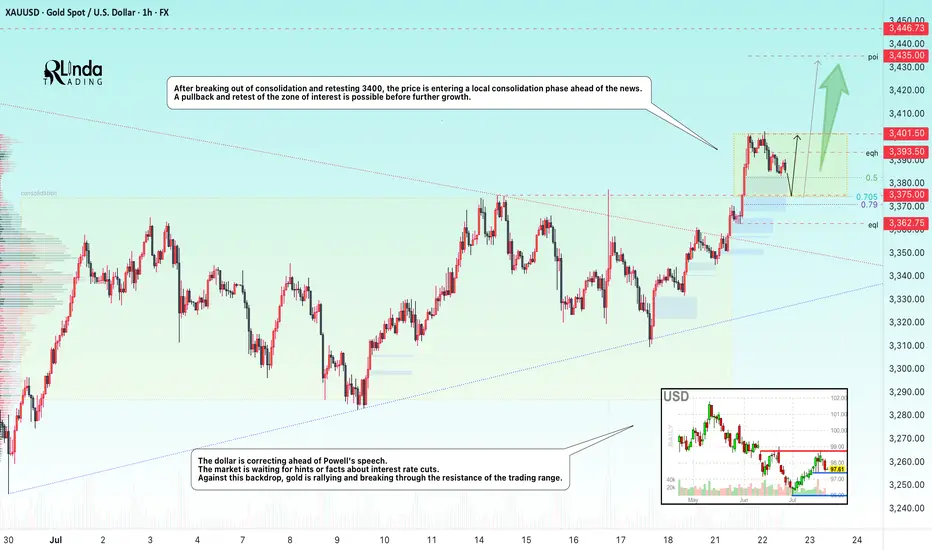
GOLD → Correction before continuing the rally to 3450FX:XAUUSD updates its local maximum to 3401.5 and enters a consolidation phase ahead of news. The dollar correction gives speculators a chance...
The price of gold is correcting from 3400. The reason is profit-taking ahead of Powell's speech at 12:30 GMT and waiting for clarity on US trade negotiations with the EU and Japan before August 1.
Gold remains sensitive to the progress of negotiations and the dynamics of the dollar, which is weakening amid political uncertainty, declining yields, and pressure on the Fed from Trump.
Technically, after exiting consolidation and retesting 3400, the price is entering a local consolidation phase.
Focus on key levels: 3401, 3382, 3375. A false breakdown of support could trigger a recovery phase.
Resistance levels: 3402, 3393
Support levels: 3382, 3375, 3362.75
The distribution phase has been halted by resistance, and the price has moved into a countertrend correction due to uncertainty. Markets are waiting for positive signals from the Fed. Local and global trends are bullish, which may support the price overall...
Best regards, R. Linda!
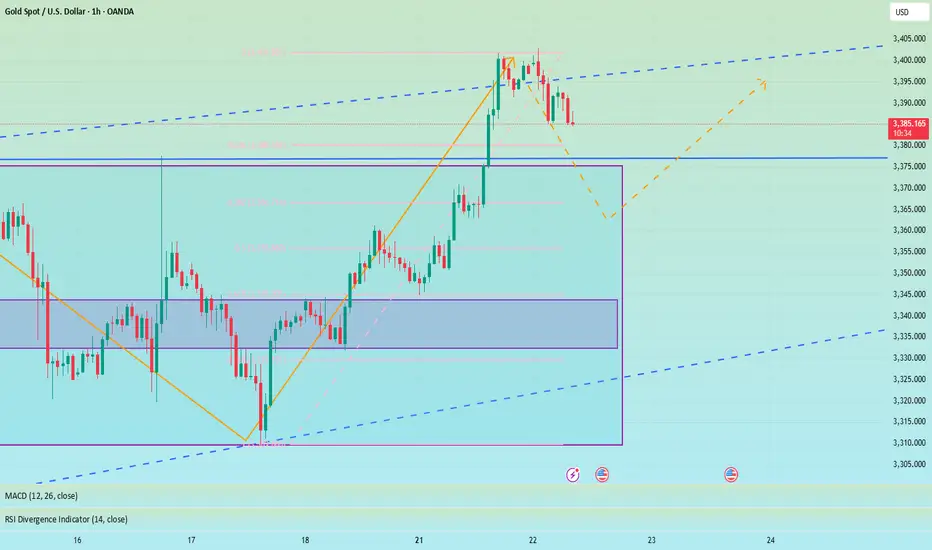
Bulls are still the main theme, 3400 is not the high point📰 News information:
1. Fed Chairman Powell delivers a welcome speech at a regulatory conference
2. The tariff deadline is approaching
📈 Technical Analysis:
Today's opening high reached around 3402, and did not effectively break through the upper resistance of 3405-3415. As I said yesterday, a decline and return to the moving average is an inevitable result. The tariff issue is still there, with the deadline on August 1, and the daily MACD indicator still shows a golden cross. The general direction of short-term bullishness has not changed, but from a technical point of view, gold still has room to fall to correct the overbought part.
Below the day, we first focus on the top and bottom conversion position of 3377-3375. As time goes by, the 4H middle track will probably resonate with the 50% position of the Fibonacci line at 3355, which is also a good long position I expect. Therefore, if the price falls back to 3380-3375 for the first time during the day, you can consider going long. If the price continues to fall, pay attention to the second opportunity to go long at 3355, with the target at 3390-3410.
🎯 Trading Points:
BUY 3380-3375
TP 3390-3410
BUY 3360-3350
TP 3370-3380
In addition to investment, life also includes poetry, distant places, and Allen. Facing the market is actually facing yourself, correcting your shortcomings, facing your mistakes, and exercising strict self-discipline. I share free trading strategies and analysis ideas every day for reference by brothers. I hope my analysis can help you.
TVC:GOLD PEPPERSTONE:XAUUSD FOREXCOM:XAUUSD FX:XAUUSD OANDA:XAUUSD FXOPEN:XAUUSD
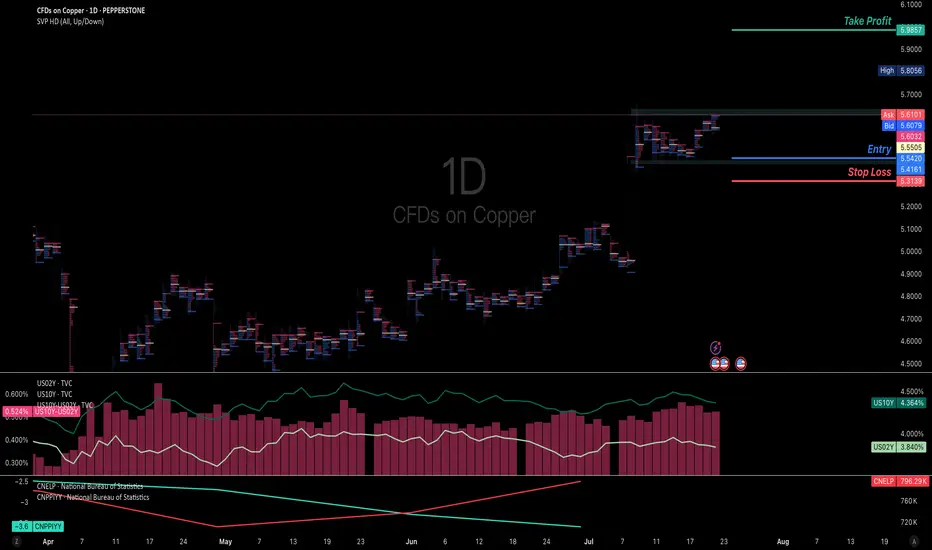
Long the copper for a potential breaking upWith the expectation of PPI bouncing back from the deep valley because China is launching a 1.3 Trillion infrastructure plan to build the largest hydro dam in the Yarlung Tsangpo Grand Canyon on the Qinghai-Tibet Plateau, the long term global demand of industrial copper is more bullish than last time.
In the aspect of currency, the bullish steepener yield curve of US T-bill is giving a continuous momentum to industrial commodities.
Imma entry in the bottom of the current consolidation and add position as the breaking in the next weeks
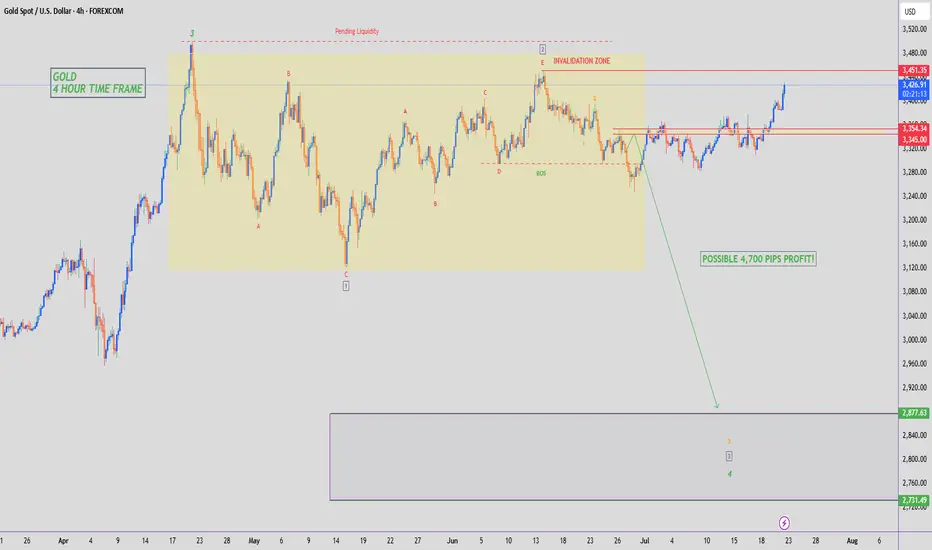
GOLD - SHORT TO $2,800 (UPDATE)Price has pushed up as expected back into the $3,400 zone, where we had a lot of pending liquidity that needed to be wiped out. Now that liquidity is collected I am patiently waiting for some form of 'distribution price action' to play out, before I consider selling. Until then I'm sitting on the sideline.
If Gold takes out Wave 2 high ($3,451) then bearish structure is invalidated & we can start looking at buy trades.
GOLD ROUTE MAP UPDATEHey Everyone,
Another great day on the charts today with our analysis playing out perfectly like we analysed.
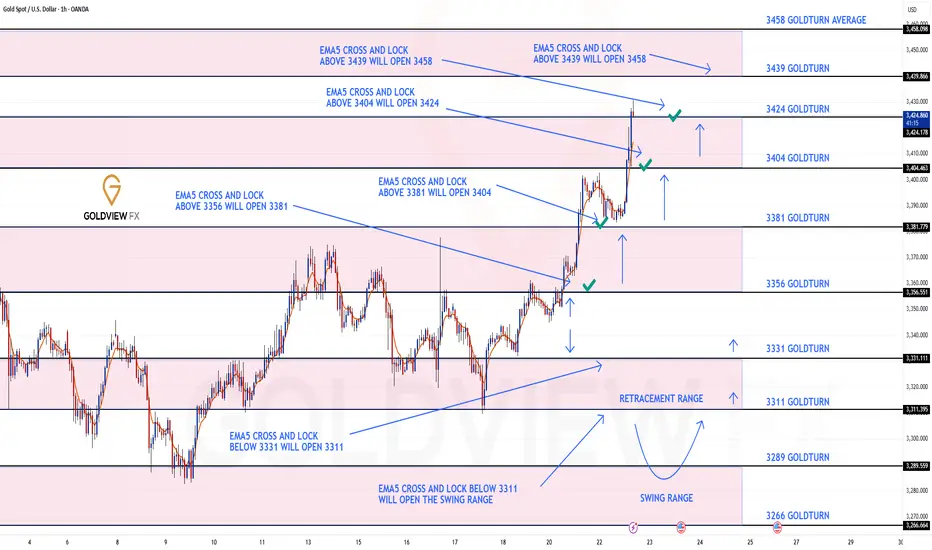
As a follow up from yesterday, after completing 3356, we noted that EMA5 cross and lock opening 3404, which was hit perfectly today as analysed. With strong momentum, we also cleared the 3424 Bullish Target.
We will now look for an EMA5 lock above 3424 to open the next bullish level at 3439. Alternatively, a rejection here may see lower Goldtruns tested for support and bounce.
We will keep the above in mind when taking buys from dips. Our updated levels and weighted levels will allow us to track the movement down and then catch bounces up.
We will continue to buy dips using our support levels, taking 20 to 40 pips. As stated before, each of our level structures gives 20 to 40 pip bounces, which is enough for a nice entry and exit. If you backtest the levels we’ve shared every week for the past 24 months, you’ll see how effectively they were used to trade with or against short/mid-term swings and trends.
The swing ranges give bigger bounces than our weighted levels, that’s the difference between the two.
BULLISH TARGET
3356 - DONE
EMA5 CROSS AND LOCK ABOVE 3356 WILL OPEN THE FOLLOWING BULLISH TARGETS
3381 - DONE
EMA5 CROSS AND LOCK ABOVE 3381 WILL OPEN THE FOLLOWING BULLISH TARGET
3404 - DONE
EMA5 CROSS AND LOCK ABOVE 3404 WILL OPEN THE FOLLOWING BULLISH TARGET
3424 - DONE
EMA5 CROSS AND LOCK ABOVE 3424 WILL OPEN THE FOLLOWING BULLISH TARGET
3458
BEARISH TARGETS
3331
EMA5 CROSS AND LOCK BELOW 3331 WILL OPEN THE FOLLOWING BEARISH TARGET
3311
EMA5 CROSS AND LOCK BELOW 3311 WILL OPEN THE SWING RANGE
3289
3266
As always, we will keep you all updated with regular updates throughout the week and how we manage the active ideas and setups. Thank you all for your likes, comments and follows, we really appreciate it!
Mr Gold
GoldViewFX
Don't chase the bullish trend,wait for the short position layout#XAUUSD
The tariff policy recently announced by the US government is undoubtedly the focus of the current gold market. Trump also tied the tariffs to the trial of former Brazilian President Jair Bolsonaro, adding to policy uncertainty. ⚖️
The implementation of the tariff policy may push up commodity prices, thereby exacerbating inflationary pressure, which is both an opportunity and a challenge for gold📊. On the one hand, rising inflation expectations may enhance the attractiveness of gold as an anti-inflation asset; on the other hand, the strengthening of the US dollar and US Treasury yields may offset this positive. 💡
At present, the lower support has moved up to the 3375-3365 area, where a top-bottom conversion position will be formed. The upper short-term resistance level is 3387-3393, the previous high. If the market touches this for the first time, you can try to see a double top fall.
🚀SELL 3385-3390
🚀TP 3365-3355
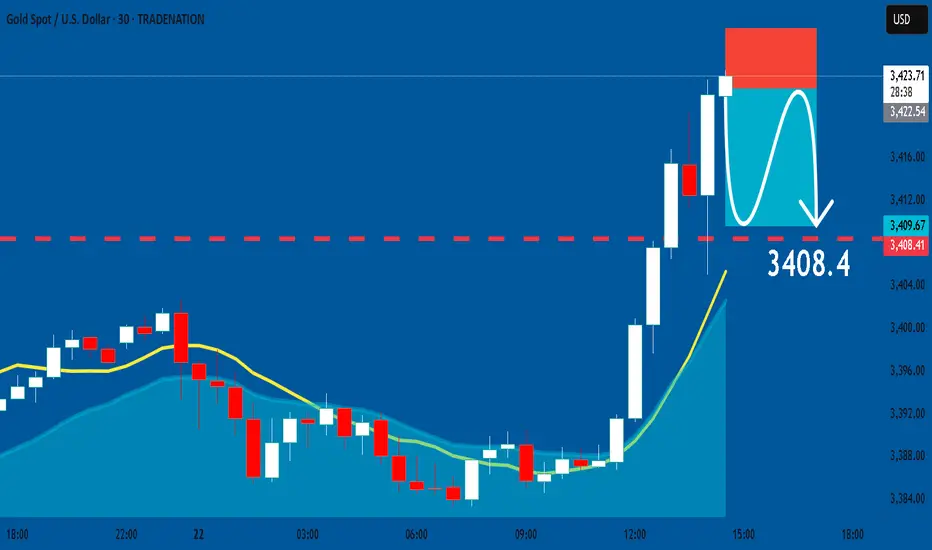
GOLD: Bearish Continuation & Short Trade
GOLD
- Classic bearish formation
- Our team expects fall
SUGGESTED TRADE:
Swing Trade
Sell GOLD
Entry Level -3422.5
Sl - 3428.1
Tp - 3408.4
Our Risk - 1%
Start protection of your profits from lower levels
Disclosure: I am part of Trade Nation's Influencer program and receive a monthly fee for using their TradingView charts in my analysis.
❤️ Please, support our work with like & comment! ❤️
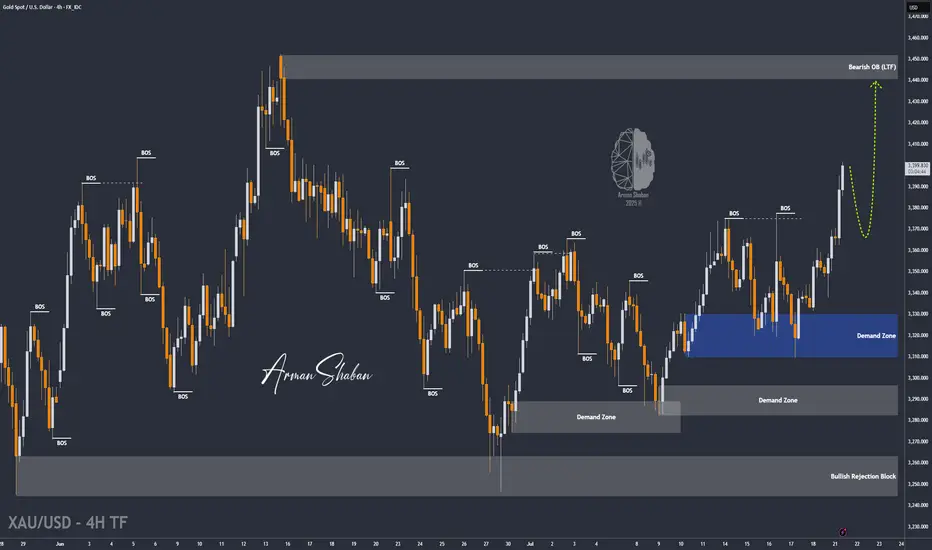
XAU/USD | Get Ready for Another Bullrun, $3500 is Coming!By analyzing the gold chart on the 4-hour timeframe, we can see that on Friday, the price finally closed at $3350. After the market opened today, we saw an initial correction down to $3339 (exactly as expected), followed by another strong bullish wave, pushing gold above $3400 just moments ago. If the price stabilizes below $3398 within the next 4 hours, I expect a potential rejection toward $3388 and $3377. However, if gold holds above $3400, the next target will be $3409. Key demand zones are $3365–$3375, and levels $3355, $3344, and $3336.
Please support me with your likes and comments to motivate me to share more analysis with you and share your opinion about the possible trend of this chart with me !
Best Regards , Arman Shaban
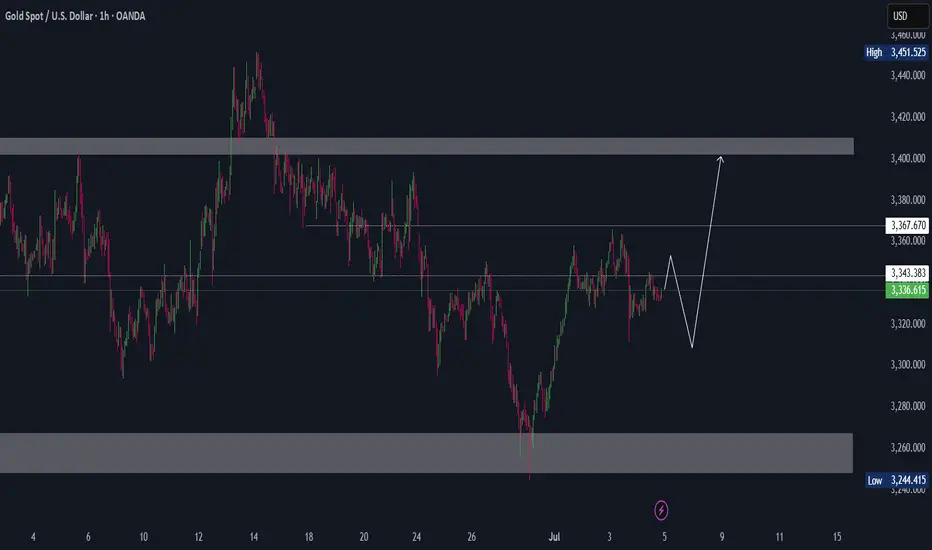
XAUUSD buy Idea!Xauusd has printed its low in the past week and currently looking for a high nearing 3400 region. 3400 could be a very important rejection or breakout zone.
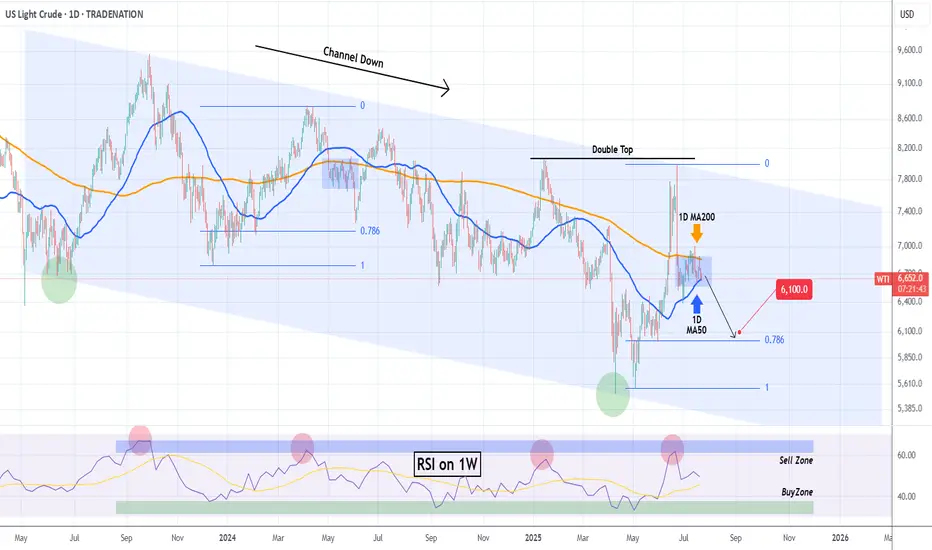
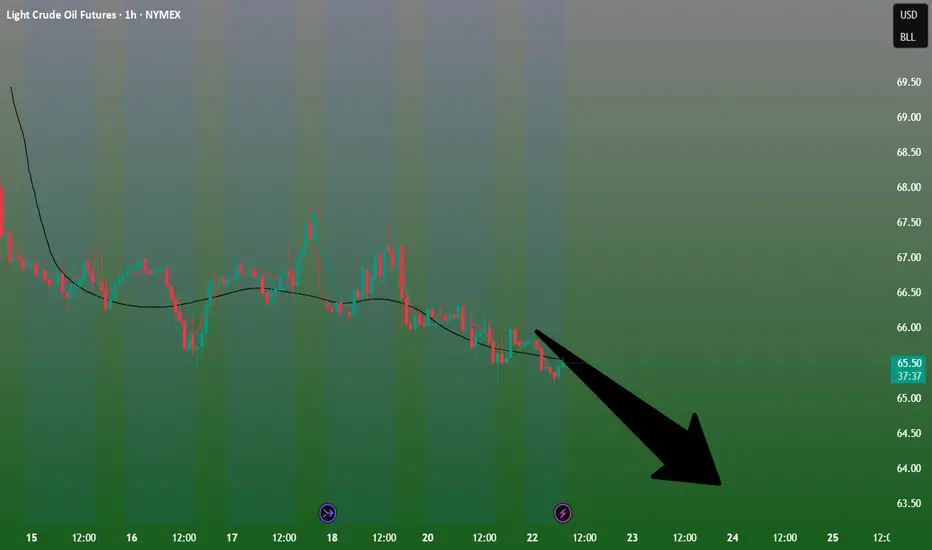
WTI OIL Extreme 1D MA50-200 squeeze to deliver break-out!WTI Oil (USOIL) has been consolidating for almost the past 30 days within the 1D MA50 (blue trend-line) and 1D MA200 (orange trend-line). The squeeze is now so tight that the trend will be revealed soon with a break-out.
Based on the 2-year Channel Down, that should be bearish, resembling the May 2024 consolidation that broke downwards and almost hit the 0.786 Fibonacci retracement level. Notice also the similar Sell Zone rejection on the 1W RSI.
As a result, we expect WTI to decline and target $61.00.
-------------------------------------------------------------------------------
** Please LIKE 👍, FOLLOW ✅, SHARE 🙌 and COMMENT ✍ if you enjoy this idea! Also share your ideas and charts in the comments section below! This is best way to keep it relevant, support us, keep the content here free and allow the idea to reach as many people as possible. **
-------------------------------------------------------------------------------
Disclosure: I am part of Trade Nation's Influencer program and receive a monthly fee for using their TradingView charts in my analysis.
💸💸💸💸💸💸
👇 👇 👇 👇 👇 👇
Gold 30Min Engaged ( Bullish & Bearish Reversal Entry Detected )————-
➕ Objective: Precision Volume Execution
Time Frame: 30-Minute Warfare
Entry Protocol: Only after volume-verified breakout
🩸 Accurate Bullish Reversal : 3380
🩸 Accurate Bearish Reversal : 3314.5
➗ Hanzo Protocol: Volume-Tiered Entry Authority
➕ Zone Activated: Dynamic market pressure detected.
The level isn’t just price — it’s a memory of where they moved size.
Volume is rising beneath the surface — not noise, but preparation.
🔥 Tactical Note:
We wait for the energy signature — when volume betrays intention.
The trap gets set. The weak follow. We execute.

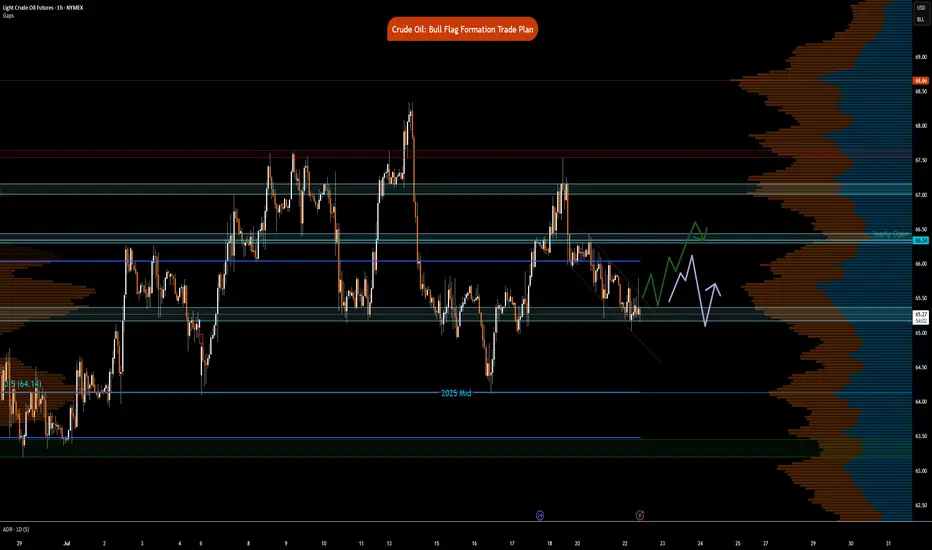
Crude Oil- Bull Flag formation Trade PlanNYMEX:CL1! NYMEX:MCL1!
Big Picture:
Let the price action and market auction be your guide
What has the market done?
The market has consolidated and pushed higher. There is an excess high at 67.87 from July 14th RTH. Market pushed lower, leaving behind excess with single prints above this showcasing strong area of resistance.
What is it trying to do?
The market is accepting prices in this range and building value. It has been in price discovery mode with a multi-distribution profile since June 24th.
How good of a job is it doing?
The market is currently forming a bull flag formation and attempting to push higher on the hourly time-frame.
What is more likely to happen from here?
Key Levels:
Neutral Zone 1: 67.16-67
Neutral Zone 2 : 66.45-66.30
Yearly Open: 66.34
Neutral zone 3 : 65.23-65.03
2025- Mid Range : 64.14
Scenario 1: False break, pull back and push higher
In this scenario, we expect prices to attempt to break bull flag formation, fail, however, neutral zone 3, acts as support for buyers to step back in to push prices towards yearly open and neutral zone 2.
Scenario 2: Break but fail to sustain push higher
In this scenario, we expect prices to break out of bull flag formation, however, fail around the 66 zone. Price reverts lower towards neutral zone 3 to further consolidate.
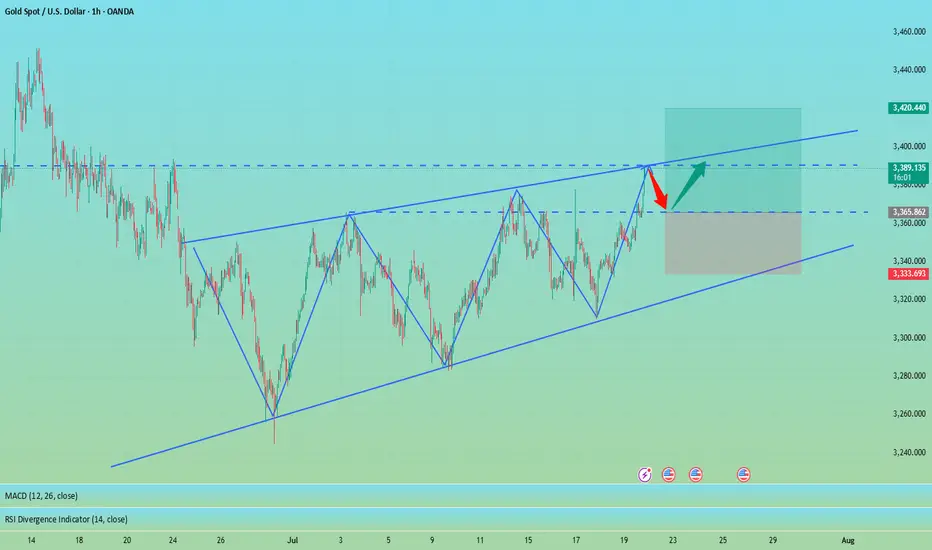
XAUUSD Technical Analysis – Triangle Breakout Ahead?Gold is currently consolidating in a symmetrical triangle pattern around $3,389. If it breaks above $3,402, we can expect a bullish continuation toward $3,420 and beyond. Key support lies at $3,367; a breakdown below this level would turn the trend bearish. The overall trend is still bullish, but a breakout is needed for confirmation.
📈 Potential Scenarios:
✅ Bullish Breakout Scenario:
- Break above $3,392–$3,402 zone.
- Targets: $3,420 > $3,450 > $3,480
- Supported by strong upward BOS (Break of Structure) and higher lows.
❌ Bearish Breakdown Scenario:
- Breakdown below $3,373–$3,367 zone.
- Targets: $3,355 > $3,345
- Would invalidate current bullish structure and form a lower low.
🔮 Trend Bias:
Bullish Bias remains intact as long as price stays above $3,367 and maintains higher lows. However, consolidation suggests waiting for breakout confirmation from the triangle before entering new trades.
🧭 Trend Outlook:
Gold is currently consolidating in a symmetrical triangle pattern, which typically precedes a breakout — either upward or downward. The price is holding above the key Fibonacci support levels and the overall market structure is bullish, suggesting an upward continuation is more likely if buyers maintain momentum.
Note
Please risk management in trading is a Key so use your money accordingly. If you like the idea then please like and boost. Thank you and Good Luck!

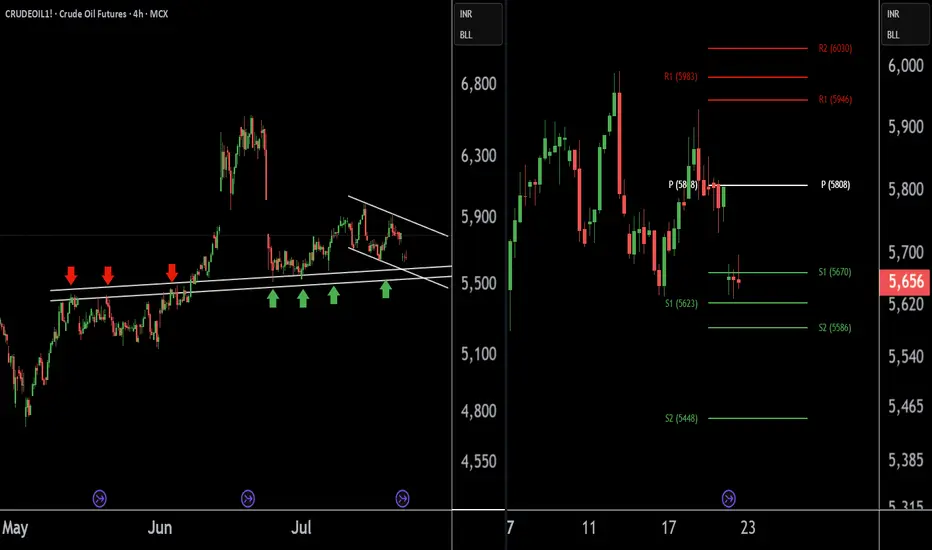
Crude Oil Buying Alert: Strategic Entry Point IdentifiedThere are two charts of Crude Oil on the 4-hour timeframe.
In the first chart, Crude Oil is sustaining near its lower point (LOP), with a support range of 5540-5580.
A-VWAP is also providing support to Crude Oil around the 5580 level.
The Pivot Point is also supporting Crude Oil around the 5580-5620 level.
If this level is sustain then we may see higher prices in Crude Oil.
Thank you !!
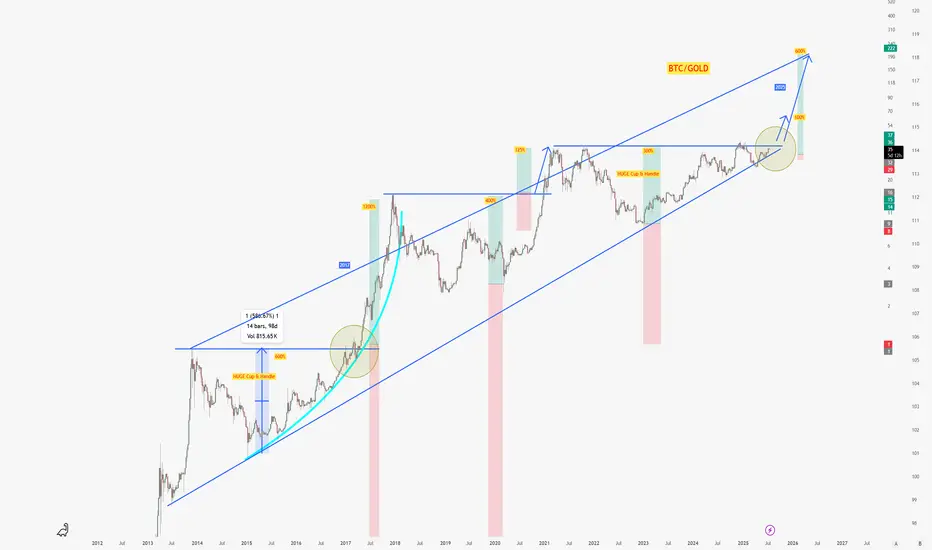
HUGE Cup & Handle On BTC/GOLDAre we in the same situation as in 2017? At that time, BTC followed with a 500% rally. Do you think history is repeating itself?
If we use the same percentages, we'll have a BTC/GOLD rally of 600%. This would mean that BTC could make 250%.
XAUUSD Trade Idea: Golden Cross Signals Bullish MomentumGold (#XAUUSD) is surging after breaking above the 61.8% Fibonacci level, confirming strong bullish momentum!
📊 Key Observations:
Price has bounced off the upper trendline, with an imbalance below, suggesting a possible small correction.
The MA50 has crossed above the MA200, forming a Golden Cross – a highly bullish signal!
🎯 Trade Strategy:
🔼 Consider buying ONLY if price consolidates above 3400 & the nearest fractal.
✅ Target: 3435 (next resistance zone)
⚠️ Watch for pullbacks – the Golden Cross supports upside, but a retest of support could offer a better entry.
GOLD: Strong Bullish Sentiment! Long!
My dear friends,
Today we will analyse GOLD together☺️
The in-trend continuation seems likely as the current long-term trend appears to be strong, and price is holding above a key level of 3,392.264 So a bullish continuation seems plausible, targeting the next high. We should enter on confirmation, and place a stop-loss beyond the recent swing level.
❤️Sending you lots of Love and Hugs❤️

Crude oil-----sell near 67.50, target 65.00-63.00Crude oil market analysis:
Crude oil has started a new contract. The new contract is still not moving much at present, and the contract spread is not much. The daily line has begun to decline. Today's idea is to sell at a rebound of 67.50. The suppression position is 67.50 and 69.00, and the support is around 64.00. If this position is broken, there will be a greater room for decline.
Fundamental analysis:
There is no major news in the recent fundamentals. The situation in the Middle East is still relatively stable. There is no new rest on tariffs, and the impact on the market is limited.
Operational suggestions:
Crude oil-----sell near 67.50, target 65.00-63.00
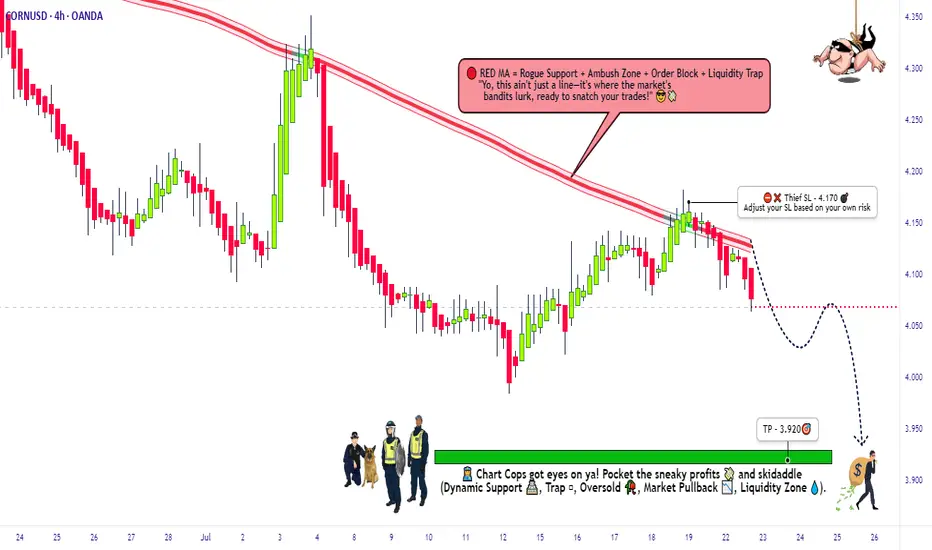
CORN Heist: Steal Short Profits Before Bulls React!🚨 CORN HEIST ALERT: Bearish Raid Ahead! 🚨 Swipe the Loot Before Cops Arrive! 🌽🔻
🌟 Attention, Market Bandits & Profit Pirates! 🌟
🔥 Thief Trading Intel Report 🔥
The 🌽 CORN CFD market is setting up for a bearish heist—time to short-swipe the loot before the bulls rally their defenses! Police barricade (resistance) is holding strong, but oversold conditions + consolidation hint at a trend reversal trap. High-risk, high-reward—just how we like it!
🎯 Heist Strategy (Swing/Day Trade)
Entry (Bearish Raid) 🏴☠️
"Vault’s unlocked! Swipe shorts at any price—OR set sell limits *near 15M/30M pullbacks for a cleaner steal!"*
Stop Loss (Escape Route) 🛑
Thief’s SL at nearest 4H swing high (4.170)—adjust based on your risk tolerance & lot size.
Pro Tip: Tighten SL if trading multiple orders!
Target (Profit Escape) 🎯
3.920 (or bail early if cops (bulls) show up!)
🌽 Market Snapshot: Why CORN is Ripe for a Raid
Neutral trend leaning bearish—consolidation breakout likely!
Key Drivers:
Macro pressure (USD strength, crop reports)
COT data hinting at big players positioning short
Seasonal trends favoring downside
Want full intel? 🔍 Check COT reports & intermarket analysis!
🚨 Trading Alerts (Avoid the Cops!)
News = Volatility Trap! 📰🚔
Avoid new trades during high-impact news.
Trailing stops to lock profits on running heists!
💥 Boost This Heist! 💥
"Like & boost this idea to fuel our next raid! More steals = more profits for the gang! 🏴☠️💰
Stay tuned—another heist drops soon! 🚀🤝
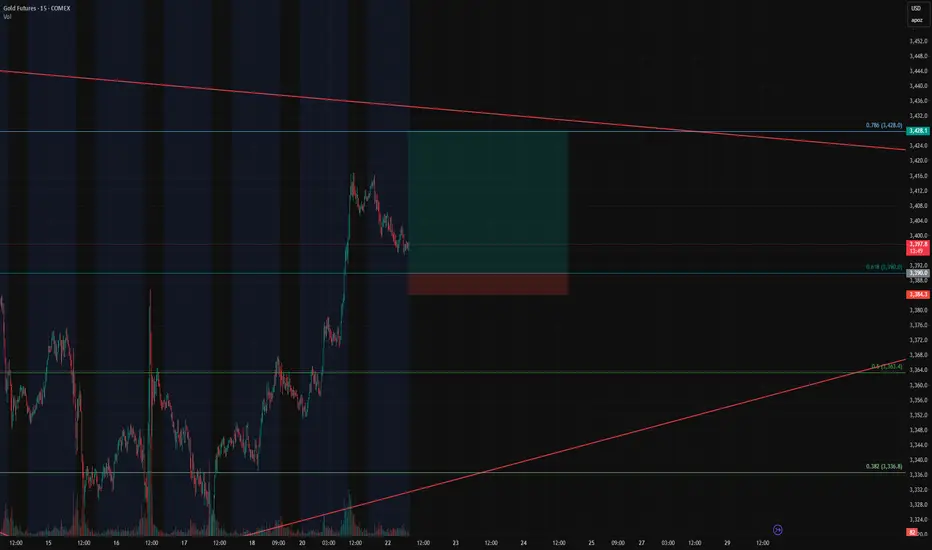
Gold Futures Long Setup – Breakout Continuation off the 0.618 FiGold Futures Long Setup – Breakout Continuation off the 0.618 Fib
Instrument: Gold Futures – COMEX ( COMEX:GC1! )
Timeframe: 15-Minute
Trade Type: Long – Breakout Continuation
Entry Zone: 3390 (0.618 Fibonacci retracement)
Take Profit: 3428 (0.786 Fib)
Stop Loss: 3384
Risk/Reward Ratio: 6.68
Setup: Bullish Flag on Retest
🔍 Trade Thesis
This trade is part of an ongoing breakout continuation strategy we've been trading, and now we're eyeing a pullback entry as price returns to a key retracement level.
Price nearly exploded through the 0.618 Fibonacci level (3390) during the prior breakout.
Now it's pulling back in a textbook bullish flag formation, suggesting healthy consolidation before the next leg.
The 0.618 retracement is aligning with previous intraday structure and trendline support — making this an ideal level to scale in.
This is a high R:R continuation play, with targets set at the 0.786 Fib level (3428) — right before macro resistance kicks in.
🎯 Entry & Exit Strategy
Entry: As price touches 3390 or forms bullish confirmation at the level.
Stop Loss: 3384 – tight and below key fib/flag structure.
Target: 3428 – based on 0.786 Fib extension and breakout continuation projection.
📊 Why This Works
Breakout behavior: Price respected the breakout impulse and retraced cleanly into a bull flag.
Fib confluence: 0.618 pullbacks are a classic entry in trending markets.
R/R of 6.68: Excellent reward profile vs. limited risk.
LONG ON USOIL OIL has just completed a sweep of sell side liquidity, leaving behind lots of BUY side liquidity.
DXY is falling on top of economic news stating trump will possibly fire Jerome Powell.
All this with OPEC increase oil production.
I expect oil to make a $5-$10 move throughout the rest of the week.
That's 500-1000 pips!
