SILVER: Next Move Is Up! Long!
My dear friends,
Today we will analyse SILVER together☺️
The price is near a wide key level
and the pair is approaching a significant decision level of 38.823 Therefore, a strong bullish reaction here could determine the next move up.We will watch for a confirmation candle, and then target the next key level of 38.872.Recommend Stop-loss is beyond the current level.
❤️Sending you lots of Love and Hugs❤️
Commodities

Natural Gas Price Drops by 7%Natural Gas Price Drops by 7%
As the XNG/USD chart shows today, natural gas is trading around $3.333/MMBtu, although yesterday morning the price was approximately 7% higher.
According to Reuters, the decline in gas prices is driven by:
→ Record-high production levels. LSEG reported that average gas output in the Lower 48 rose to 107.2 billion cubic feet per day so far in July, surpassing the previous monthly record of 106.4 billion cubic feet per day set in June.
→ Favourable weather forecasts. Although the peak of summer heat is still anticipated, forecasts indicate that temperatures over the next two weeks may be lower than previously expected.
As a result, today’s XNG/USD chart appears bearish.
Technical Analysis of the XNG/USD Chart
The chart indicates that since mid-May, natural gas prices have been fluctuating within a descending channel (marked in red), with July’s peak (E) highlighting the upper boundary of the pattern.
A key resistance area is now represented by a bearish gap, formed between:
→ the former support level at $3.525;
→ the $3.470 level – which, as the arrow suggests, is already showing signs of acting as resistance.
Under these conditions, it is reasonable to assume that the price may continue forming a downward market structure A-B-C-D-E, consisting of lower highs and lows, potentially moving towards the channel’s median – which approximately corresponds to July’s low (around the $3.200 level).
This article represents the opinion of the Companies operating under the FXOpen brand only. It is not to be construed as an offer, solicitation, or recommendation with respect to products and services provided by the Companies operating under the FXOpen brand, nor is it to be considered financial advice.

Gold Consolidates Before Breakout – A Prime Buy-the-Dip Gold Consolidates Before Breakout – A Prime Buy-the-Dip Opportunity
On the 1H chart, XAUUSD continues to display a bullish market structure with a series of higher highs and higher lows. After a strong rally from the 3.618 Fibonacci extension zone at 3,340.71, price reached a local high at 3,398.36 and is now undergoing a sideways consolidation just below resistance.
Technical Breakdown:
Price Structure: Gold remains within a bullish trend. The current pullback appears healthy and corrective, forming a potential launchpad for the next leg higher.
Fibonacci Retracement: Price is hovering around the 0.618 (3,388.39) and 0.786 (3,390.49) retracement zones of the previous bullish leg. This area acts as a strong short-term support zone – if held, it may trigger a continuation move.
Key Support Levels:
Short-term: 3,382.42 (Fibonacci 1.0)
Medium-term: 3,340.71 (Fibonacci extension 3.618)
Long-term: 3,321.58 (major swing low)
Key Resistance Levels:
Immediate: 3,398.36 (recent local top)
If broken, potential targets lie around 3,420–3,430 based on projected trendline extensions.
EMA & RSI: Although not displayed here, price action suggests that gold is trading above both the EMA20 and EMA50 – a bullish sign. If RSI forms a mild bearish divergence in the overbought zone, a short-term dip to test Fibonacci support is likely before continuation.
Trading Strategy:
Scenario 1 – Buy the Dip (Primary Setup):
Wait for price to pull back toward 3,382 – 3,385 (Fibonacci 1.0).
Set buy limit entries, SL below 3,375, TP1 at 3,398, TP2 at 3,420.
Scenario 2 – Breakout Trade:
If price breaks and closes above 3,398 with strong volume, consider a breakout buy.
SL below 3,385, target 3,420–3,430.
Scenario 3 – Bearish Reversal (Low Probability):
If price decisively breaks below 3,380, gold may retest the 3,340–3,350 support zone.
Only consider short positions with confirmation from volume or reversal patterns.
Conclusion: The trend remains bullish. The current pullback offers a favorable opportunity to rejoin the uptrend. Watch the 3,382–3,385 area closely as it may serve as the next springboard higher.
If you found this strategy useful, be sure to follow for more trade setups and save this post for your watchlist.
What are your thoughts on today’s gold setup? Let’s discuss in the comments below.
Gold Sees Mild Increase as USD WeakensGold ended Friday's session with a slight increase, regaining the 3350 USD level and recovering over 100 pips by the end of the day.
The weakening of the US Dollar (USD) allowed XAU/USD to rise modestly. Concerns about US President Donald Trump's erratic trade policies and their potential impact on the global economy further supported the precious metal.
In the short term, the technical chart shows gold breaking out of the downward channel and starting an upward wave. The price is currently adjusting at 3350 USD, which coincides with the 0.618 Fibonacci retracement level and the EMA zone, suggesting the potential for further price increases from this level, with targets towards key resistance levels.
Key resistance levels: 3160, 3172, and 3378 USD.
Support zones: 3350, 3340, 3331 USD.
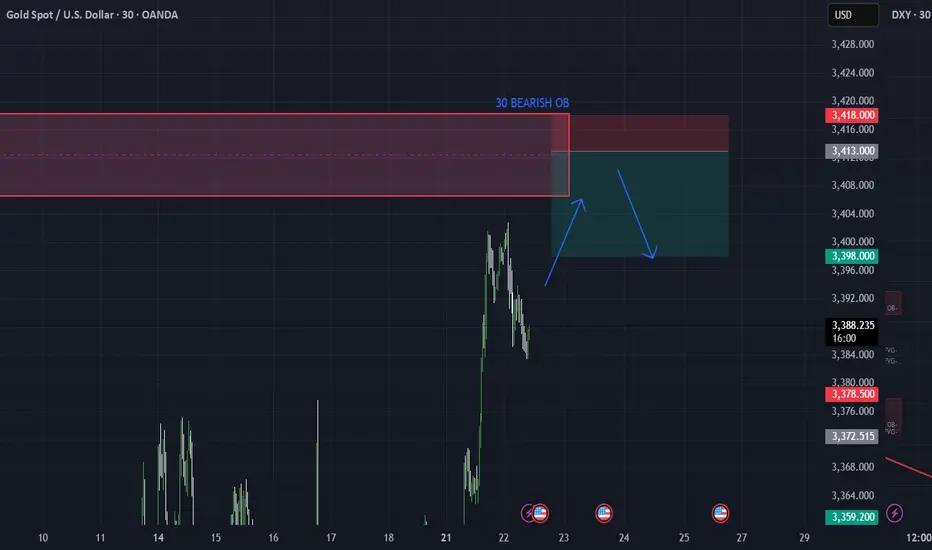
XAUUSD 30M – OB Sell Limit Setup for 3R Opportunity by PhoenixFXGold 30M Chart – Smart Money Sell Limit
We’re watching a clean Order Block (OB) on the 30-minute timeframe as price retraces into a key supply zone. This setup offers a high-probability reversal opportunity with a 3R risk-to-reward ratio. ✅
📍 ENTRY: 3413
🛑 SL: 3418 (above structure)
🎯 TP1: 3408 (1R)
🎯 TP2: 3403 (2R)
🎯 TP3: 3398 (3R)
The price action shows signs of exhaustion and premium pricing as it returns into a previous OB. We’re positioning with precision and tight risk.
📌 Strategy:
– 30M OB zone
– Clear BOS + retracement
– Set & forget execution
#XAUUSD #Gold #OrderBlock #SupplyZone #SmartMoney #PhoenixFX #RiskReward
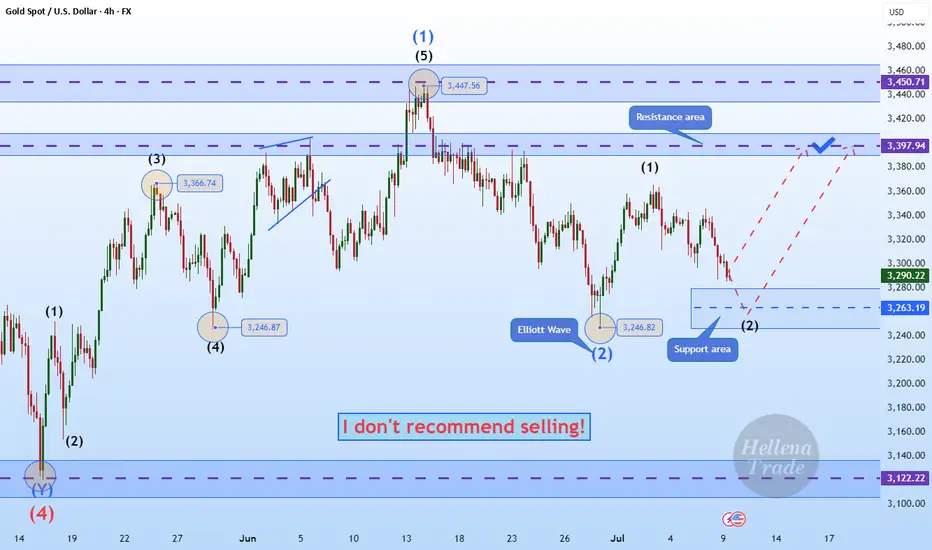
Hellena | GOLD (4H): LONG to resistance area of 3397 (Wave 3).Dear colleagues, my previous forecast remains valid, but I have decided to update it.
At the moment, I still think that wave “3” of the medium order continues its upward movement.
At the moment, I think that the small correction in wave “2” is ending and we will see a continuation of the trend. I see the resistance area of 3397.94 as the target. The main thing is to overcome the local level of the small wave “1” at 3366.37.
Manage your capital correctly and competently! Only enter trades based on reliable patterns!
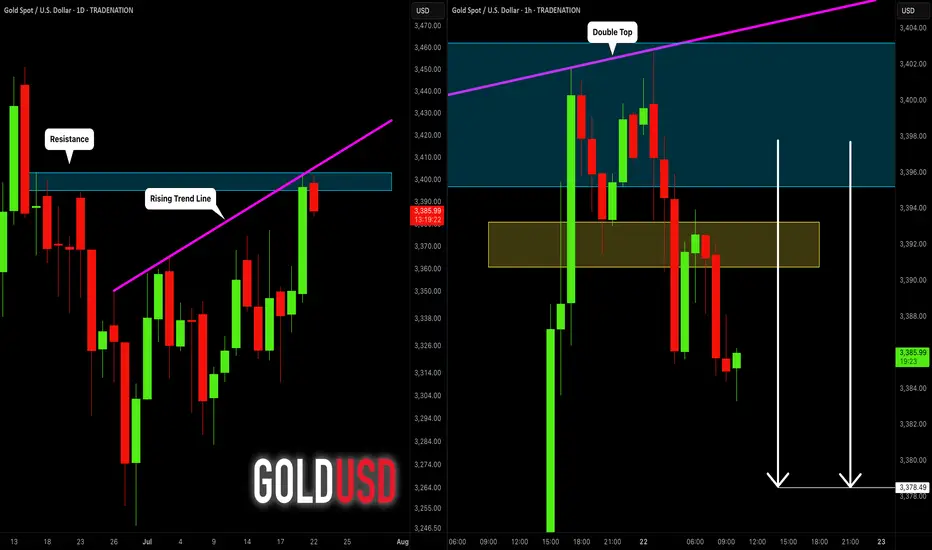
GOLD (XAUUSD): Bearish Move From Resistance Confirmed
Gold tested a significant confluence cluster on a daily time frame
that is based on a rising trend line and a horizontal resistance.
A double top formation on that on an hourly time frame indicates
a highly probable retracement from that.
Goal - 3378.5
❤️Please, support my work with like, thank you!❤️
I am part of Trade Nation's Influencer program and receive a monthly fee for using their TradingView charts in my analysis.
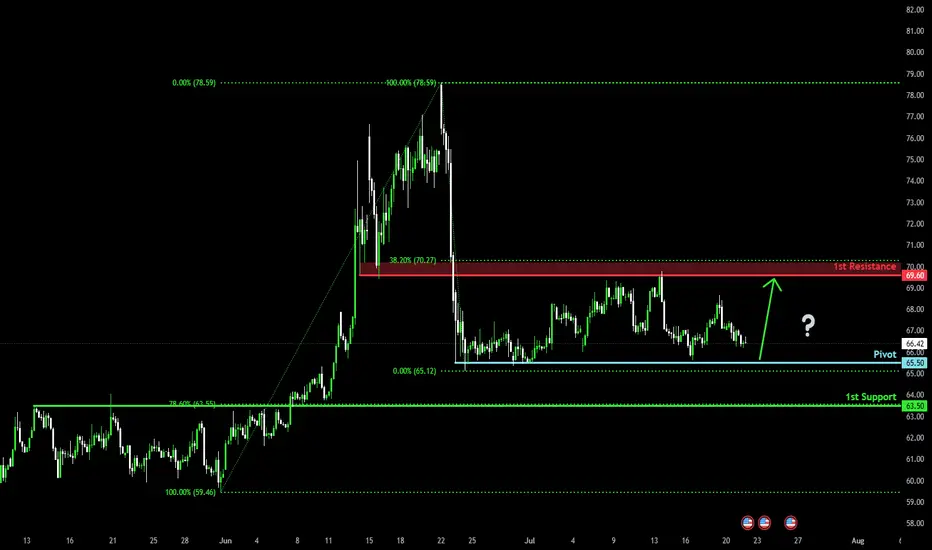
Bullish bounce?WTI Oil (XTI/USD) is falling towards the pivot and could bounce to the 1st resistance.
Pivot: 65.50
1st Support: 63.50
1st Resistance: 69.60
Risk Warning:
Trading Forex and CFDs carries a high level of risk to your capital and you should only trade with money you can afford to lose. Trading Forex and CFDs may not be suitable for all investors, so please ensure that you fully understand the risks involved and seek independent advice if necessary.
Disclaimer:
The above opinions given constitute general market commentary, and do not constitute the opinion or advice of IC Markets or any form of personal or investment advice.
Any opinions, news, research, analyses, prices, other information, or links to third-party sites contained on this website are provided on an "as-is" basis, are intended only to be informative, is not an advice nor a recommendation, nor research, or a record of our trading prices, or an offer of, or solicitation for a transaction in any financial instrument and thus should not be treated as such. The information provided does not involve any specific investment objectives, financial situation and needs of any specific person who may receive it. Please be aware, that past performance is not a reliable indicator of future performance and/or results. Past Performance or Forward-looking scenarios based upon the reasonable beliefs of the third-party provider are not a guarantee of future performance. Actual results may differ materially from those anticipated in forward-looking or past performance statements. IC Markets makes no representation or warranty and assumes no liability as to the accuracy or completeness of the information provided, nor any loss arising from any investment based on a recommendation, forecast or any information supplied by any third-party.
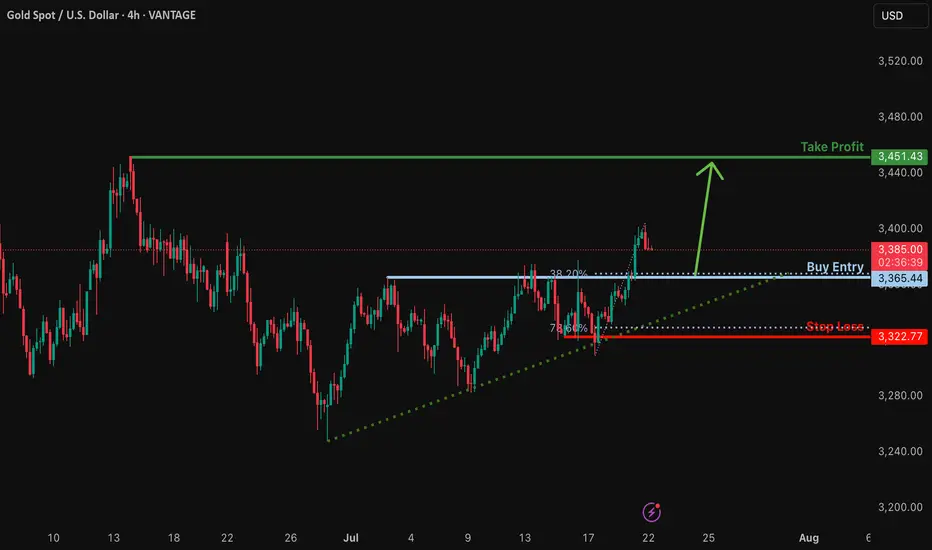
Bullish bounce off major support?The Gold (XAU/USD) is falling towards the support level which is a pullback support and could bounce from this level to our take profit.
Entry: 3,365.44
Why we like it:
There is a pullback support that lines up with the 38.2% Fibonacci retracement.
Stop loss: 3,322.77
Why we like it:
There is a pullback support that is slightly below the 78.6% Fibonacci retracement.
Take profit: 3,451.43
Why we like it:
There is a pullback resistance.
Enjoying your TradingView experience? Review us!
Please be advised that the information presented on TradingView is provided to Vantage (‘Vantage Global Limited’, ‘we’) by a third-party provider (‘Everest Fortune Group’). Please be reminded that you are solely responsible for the trading decisions on your account. There is a very high degree of risk involved in trading. Any information and/or content is intended entirely for research, educational and informational purposes only and does not constitute investment or consultation advice or investment strategy. The information is not tailored to the investment needs of any specific person and therefore does not involve a consideration of any of the investment objectives, financial situation or needs of any viewer that may receive it. Kindly also note that past performance is not a reliable indicator of future results. Actual results may differ materially from those anticipated in forward-looking or past performance statements. We assume no liability as to the accuracy or completeness of any of the information and/or content provided herein and the Company cannot be held responsible for any omission, mistake nor for any loss or damage including without limitation to any loss of profit which may arise from reliance on any information supplied by Everest Fortune Group.
Gold rallies to 4-week high as dollar and yields tumbleHello traders, what are your thoughts on gold today?
Gold prices are heating up again in the global market as the US dollar weakens and Treasury yields drop. At the time of writing, gold has surged by 50 dollars, reaching 3,390 USD per ounce — its highest level in four weeks.
The sharp decline in the US dollar is one of the main drivers behind gold’s impressive rally. The USD Index, which had risen significantly last week, lost momentum and fell sharply in overnight trading. Meanwhile, the yield on 10-year US Treasury bonds has dropped to around 4.3%, down from recent highs, increasing gold's appeal as a non-yielding asset.
Market sentiment is also being shaped by broader macroeconomic factors. Crude oil futures have dipped slightly, trading around 67 USD per barrel, reflecting investor caution amid global economic uncertainty. These combined forces have created a favorable environment for gold's strong upward movement.
If the dollar continues to weaken and bond yields remain low, gold could sustain its bullish trend. However, traders should remain alert to potential volatility driven by upcoming US Federal Reserve policy moves and key economic data releases, such as inflation reports and GDP growth figures, which may impact gold's trajectory.

Gold 22 July 2025 updateGood afternoon, update to last week's post of 21 July on gold, which worked yesterday, new zone to buy, the chart shows everything in detail, so today with the message "brevity is the sister of talent"
#GOLD
BUY LIMIT ZONE 3365-3370
🎯 TP1: 3385
🎯 TP2: 3400
🎯 TP3: 3412
🎯 TP3: 3428
⛔️ Stop loss: 3355
Regards, Totoshka™

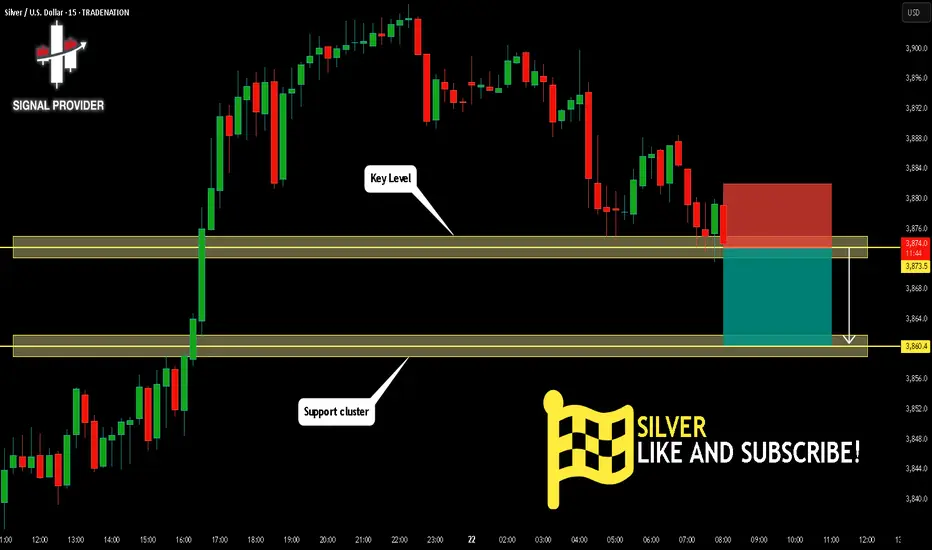
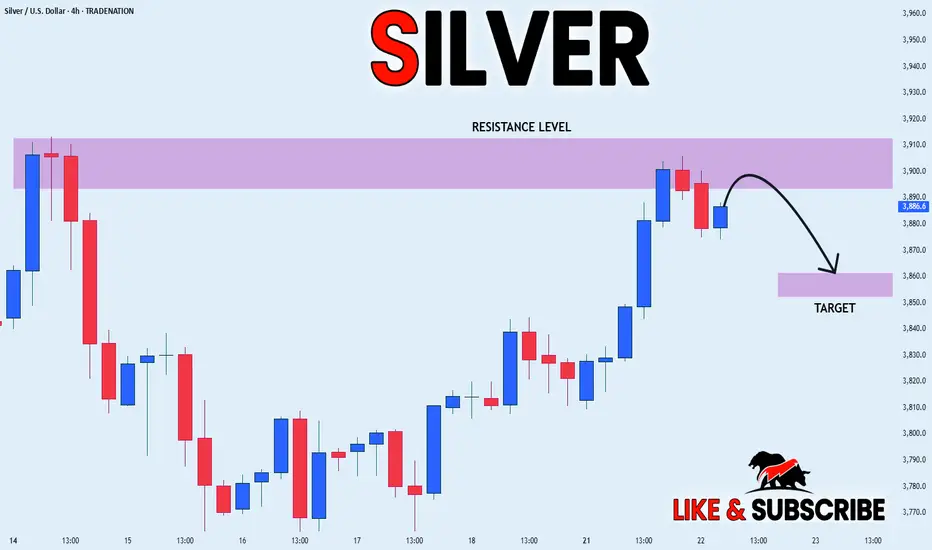
SILVER Is Going Down! Short!
Here is our detailed technical review for SILVER.
Time Frame: 15m
Current Trend: Bearish
Sentiment: Overbought (based on 7-period RSI)
Forecast: Bearish
The market is on a crucial zone of supply 3,873.5.
The above-mentioned technicals clearly indicate the dominance of sellers on the market. I recommend shorting the instrument, aiming at 3,860.4 level.
P.S
We determine oversold/overbought condition with RSI indicator.
When it drops below 30 - the market is considered to be oversold.
When it bounces above 70 - the market is considered to be overbought.
Disclosure: I am part of Trade Nation's Influencer program and receive a monthly fee for using their TradingView charts in my analysis.
Like and subscribe and comment my ideas if you enjoy them!
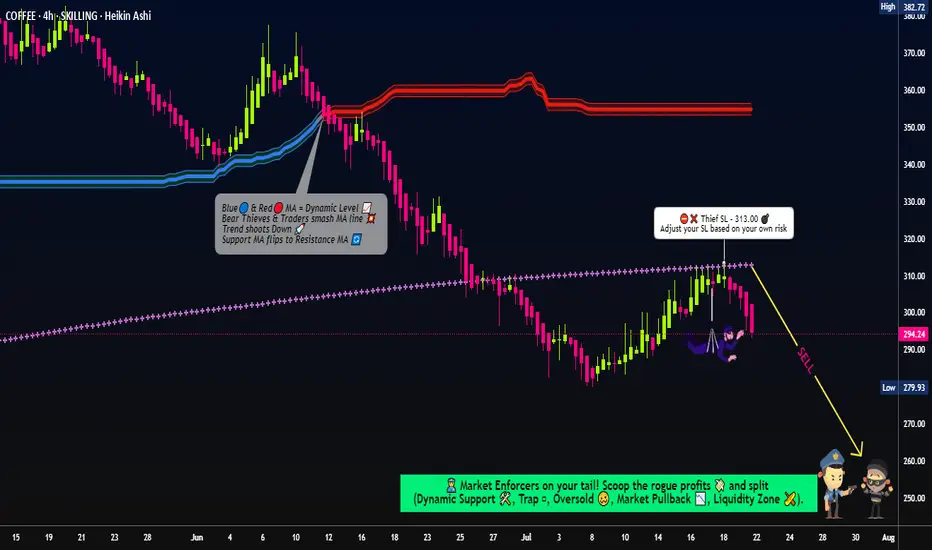
“COFFEE CFD Smash-and-Grab: Thieves’ Swing Trade Blueprint!"🚨☕ The Great "COFFEE" Market Heist 🚨💰
🌟Hi! Hola! Ola! Bonjour! Hallo! Marhaba!🌟
⚔️Dear Money Makers & Robbers, 🤑💸✈️
Get ready for the ultimate COFFEE Commodities CFD Market Heist! Based on our 🔥Thief Trading Style combining technical and fundamental analysis, here’s our master plan to snatch profits from the market vault.
💥 The Master Plan:
📉 Entry:
“The vault is wide open! Swipe the bearish loot at any price—our heist is on!”
💸 Use sell limit orders on the 15- or 30-minute timeframe, at the nearest swing high or low levels to lock in the perfect robbery spot. Thief (I"AM) using multiple limit orders (DCA / layering strategy style method of entries).
🛑 Stop Loss:
📌 Set your Thief SL at the nearest or swing high level of candle wick on the 4H timeframe (~313.00) to keep your loot safe.
📌 Adjust SL based on your trade risk, lot size, and multiple entry plan—don’t let the cops catch you!
🎯 Target:
Aim for 260.00 or escape before the target—take the loot and run!
👀 Scalpers’ Tip:
Only scalp on the Short Side! If you’ve got deep pockets, jump in big; otherwise, join swing traders to ride the heist. Use trailing SL to protect your loot.
💣 Market Vibes:
The “COFFEE” CFD market is trapped in bearish territory, fueled by:
🔎 Risky levels
🔎 Oversold zones
🔎 Consolidation
🔎 Trend reversal
🔎 Traps near levels where bullish robbers get strong.
📰🗞️ The Big Picture:
Check out the Fundamentals, Macro, COT Report, Quantitative Analysis, Sentimental Outlook, Intermarket Analysis, and Future Trend Targets to stay one step ahead! 👉👉👉
⚠️ Trading Alert:
News releases can rock the market vault!
🚨 Avoid new trades during big news
🚨 Use trailing SL to lock profits and guard your loot.
💥 Hit the Boost Button!
Supporting our Robbery Plan helps us all steal money with ease! 💰💵 Boost our robbery team’s strength, and trade with the Thief Trading Style to cash in every day. 💪🏆🤝🚀🎉
Stay tuned for our next heist plan—until then, keep those profits safe and stay sharp! 🤑🐱👤🤩
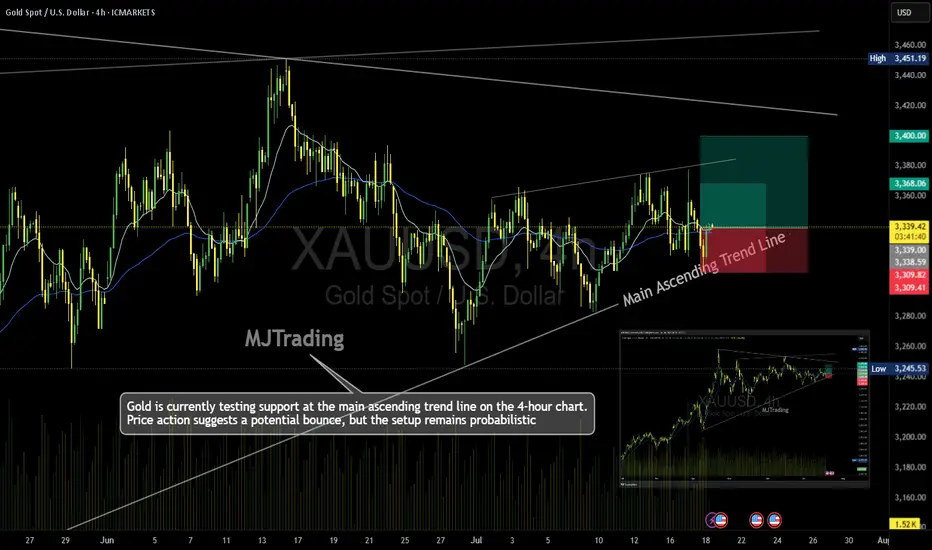
Gold (XAU/USD) – 4H Time Frame Trade Idea📈MJTrading:
Gold is currently testing support at the main ascending trend line on the 4-hour chart. Price action suggests a potential bounce, but the setup remains probabilistic—ideal for traders who operate on higher time frames and manage risk with discipline.
🔹 Trade Setup
Entry: 3340
Stop Loss: 3309
Take Profit 1: 3368
Take Profit 2: 3400
🔍 Technical Context
Price is respecting the long-standing trend line, hinting at bullish continuation.
Risk-reward ratio is favorable, especially for swing traders.
A break below the trend line invalidates the setup—hence the tight SL.
⚠️ Note: While the trend supports upside potential, failure to hold the trend line could trigger deeper retracement. Trade the probabilities, not the certainties.
In case it's not shown properly on your monitor because of different resolutions:
Psychology Always Maters:
#MJTrading #Gold #XAUUSD #Trend #Trendline #Forex #Chart #ChartAnalysis #Buy #Long
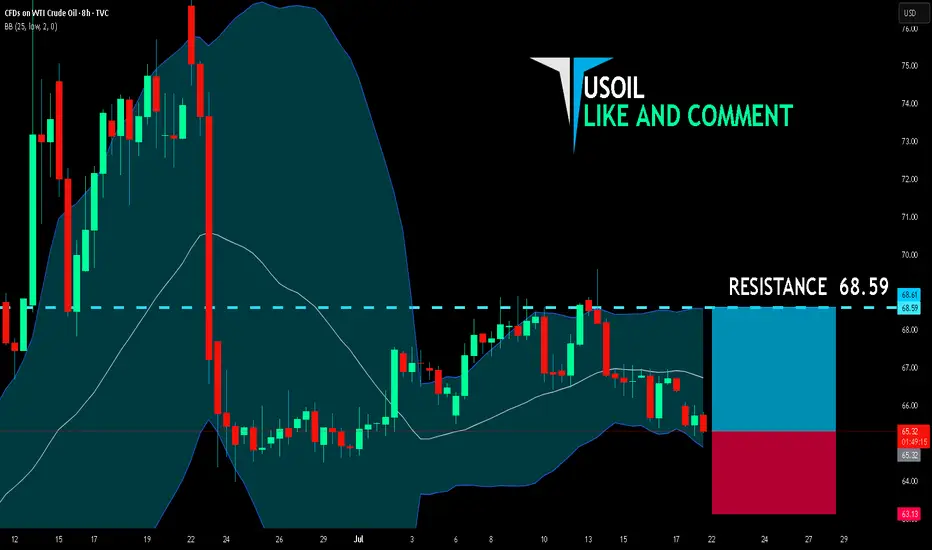
USOIL BULLS ARE STRONG HERE|LONG
USOIL SIGNAL
Trade Direction: long
Entry Level: 65.32
Target Level: 68.59
Stop Loss: 63.13
RISK PROFILE
Risk level: medium
Suggested risk: 1%
Timeframe: 8h
Disclosure: I am part of Trade Nation's Influencer program and receive a monthly fee for using their TradingView charts in my analysis.
✅LIKE AND COMMENT MY IDEAS✅
SILVER LOCAL SHORT|
✅SILVER has retested a key resistance level of 39.10$
And as the pair is already making a bearish pullback
A move down to retest the demand level below at 38.61$ is likely
SHORT🔥
✅Like and subscribe to never miss a new idea!✅
Disclosure: I am part of Trade Nation's Influencer program and receive a monthly fee for using their TradingView charts in my analysis.
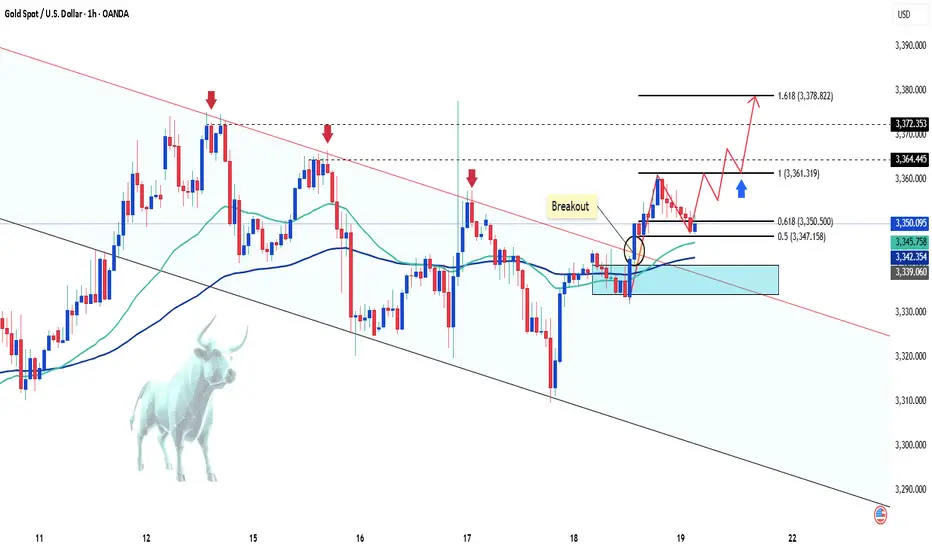
Gold Approaches 3,370 Resistance – Watch for Short-Term PullbackIn the July 21st trading session, gold (XAUUSD) on the H1 timeframe continues to push higher and is now testing a key resistance zone around 3,370 USD, which aligns with the 3.618 Fibonacci extension level. This zone is considered a high-probability area for profit-taking after a strong rally from the 3,308–3,310 USD support zone (aligned with the 0.5 and 0.618 Fibonacci retracement levels). The short-term bullish structure remains intact as long as price stays above the rising trendline from July 18th, with dynamic support currently sitting near 3,350 USD.
From a price action perspective, the latest candles are showing upper wicks near the 3,370 resistance, suggesting early signs of selling pressure. If combined with an overbought RSI condition (often seen in such extended moves), this increases the probability of a short-term retracement.
Key intraday levels to watch:
– Resistance: 3,370.43 (Fibonacci 3.618 extension)
– Dynamic Support: 3,350 (ascending trendline)
– Major Support: 3,310 – 3,308 (Fibonacci 0.618 – 0.5)
– Trend Reversal Level: 3,298.21 (recent swing low)
XAUUSD Trading Strategy for Today:
Primary Scenario – Short Setup near 3,370 if bearish confirmation appears:
Entry: 3,370 – 3,372
Stop Loss: 3,378
Take Profit: 3,350 → 3,330 → 3,310
Alternative Scenario – Buy the dip at trendline support if bullish price action confirms:
Entry: 3,350
Stop Loss: 3,340
Take Profit: 3,370 → 3,380+
In summary, gold is trading at a critical short-term resistance zone. A rejection from 3,370 could trigger a healthy correction toward support zones, while a clean breakout above it would signal strength and open the path toward 3,380–3,390. Traders should stay alert and wait for clear confirmation before entering positions.
Follow for daily gold strategies and save this post if you found it useful for your trading setup.

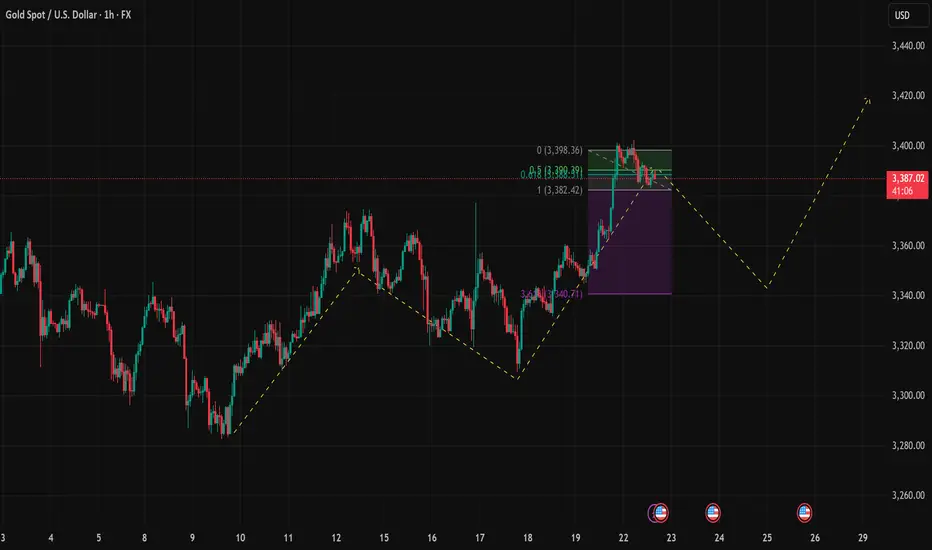
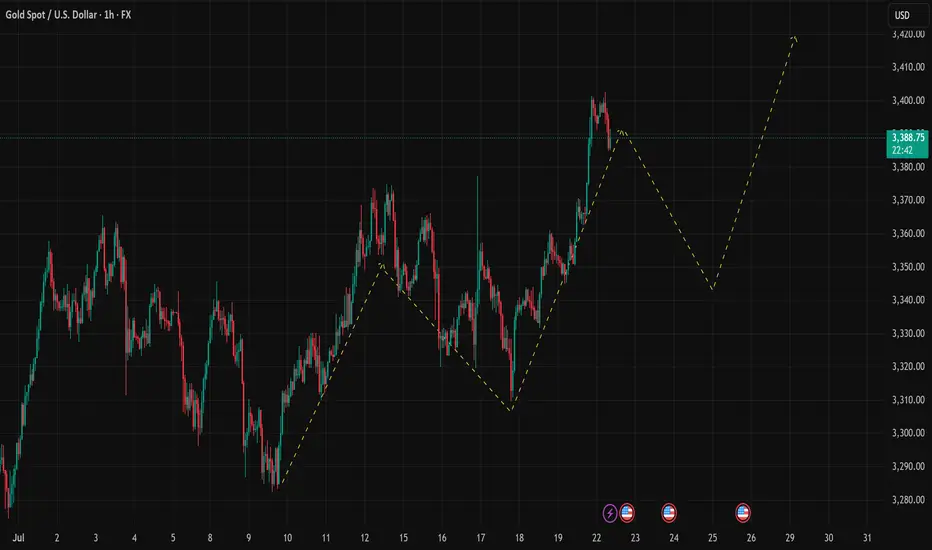
XAUUSD Continues Bullish Structure With Key Retracement OpportunTechnical Outlook – 22/07/2025
On the 1-hour chart, XAUUSD is maintaining a clear bullish market structure with a sequence of higher highs and higher lows. The projected price path drawn on the chart suggests a potential retracement before a continuation toward the 3,420 USD region. Let’s break down the key technical zones and strategies for today:
Key Levels to Watch
Immediate Resistance: 3,390 – 3,400 USD
This is the recent high. A breakout above this area could trigger momentum toward the projected 3,420 USD extension.
Support Zone: 3,345 – 3,350 USD
This zone aligns with the potential pullback as illustrated on the chart, offering a high-probability buy-the-dip opportunity. It coincides with previous structure resistance now turned support.
Trendline Support: The ascending yellow trendline has been respected multiple times and should act as dynamic support on any intraday retracements.
Indicators & Tools Used
EMA: Price is currently trading above the short-term EMA (not shown), suggesting intraday bullish bias remains intact.
RSI (Recommended Use): Look for RSI near 40–50 on the pullback for confluence at support.
Fibonacci Tool (suggested): If measuring from the swing low near 3,320 to the high of 3,390, the 0.618 Fib lies close to 3,345 – an ideal area to look for long entries.
Suggested Trading Strategies
🔹 Buy the Dip Strategy:
Wait for a corrective move into the 3,345–3,350 area. Confirm with bullish reversal candles or RSI support, then enter long targeting 3,400–3,420. Stop-loss ideally below 3,335 (structure break).
🔹 Breakout Continuation Strategy:
If price breaks cleanly above 3,390 with volume, a momentum trade toward 3,410–3,420 is viable. Use tight trailing stops to protect gains.
🔹 Avoid chasing highs – Patience at support zones or confirmation above resistance will offer better reward/risk setups.
Conclusion
Gold is respecting bullish market behavior on the 1H chart, and while a short-term correction is expected, the broader trend favors upside continuation. The 3,345–3,350 area will be critical for today's trading decisions.
Remember to follow for more updates and strategy insights. Save this post if you find it useful.
If you’d like, I can also add a version using RSI or Fib levels directly plotted. Let me know.
Falling towards pullback support?The Gold (XAU/USD) is falling towards the pivot which has been identified as a pullback support and could bounce to the 1st resistance.
Pivot: 3,365.52
1st Support: 3,322.94
1st Resistance: 3,434.64
Risk Warning:
Trading Forex and CFDs carries a high level of risk to your capital and you should only trade with money you can afford to lose. Trading Forex and CFDs may not be suitable for all investors, so please ensure that you fully understand the risks involved and seek independent advice if necessary.
Disclaimer:
The above opinions given constitute general market commentary, and do not constitute the opinion or advice of IC Markets or any form of personal or investment advice.
Any opinions, news, research, analyses, prices, other information, or links to third-party sites contained on this website are provided on an "as-is" basis, are intended only to be informative, is not an advice nor a recommendation, nor research, or a record of our trading prices, or an offer of, or solicitation for a transaction in any financial instrument and thus should not be treated as such. The information provided does not involve any specific investment objectives, financial situation and needs of any specific person who may receive it. Please be aware, that past performance is not a reliable indicator of future performance and/or results. Past Performance or Forward-looking scenarios based upon the reasonable beliefs of the third-party provider are not a guarantee of future performance. Actual results may differ materially from those anticipated in forward-looking or past performance statements. IC Markets makes no representation or warranty and assumes no liability as to the accuracy or completeness of the information provided, nor any loss arising from any investment based on a recommendation, forecast or any information supplied by any third-party.

Latest Gold Price Update TodayHello everyone, what do you think about the price of gold today?
As the new week begins, gold continues the upward trend started at the end of Friday’s session. As of now, the precious metal is trading around 3356 USD, with the uptrend still being supported.
From a carefully analyzed technical perspective, gold successfully broke out of the downward channel, taking advantage of the weakening USD. The price increase is convincing in the short term, especially after testing and confirming the previous breakout as a new support zone (around 3345 USD).
The upward target is expected to continue, with key levels to watch being 3372 USD and the H4 resistance at 3390 USD.
What do you think about the price of gold today? Feel free to share your thoughts in the comments!
Good luck!

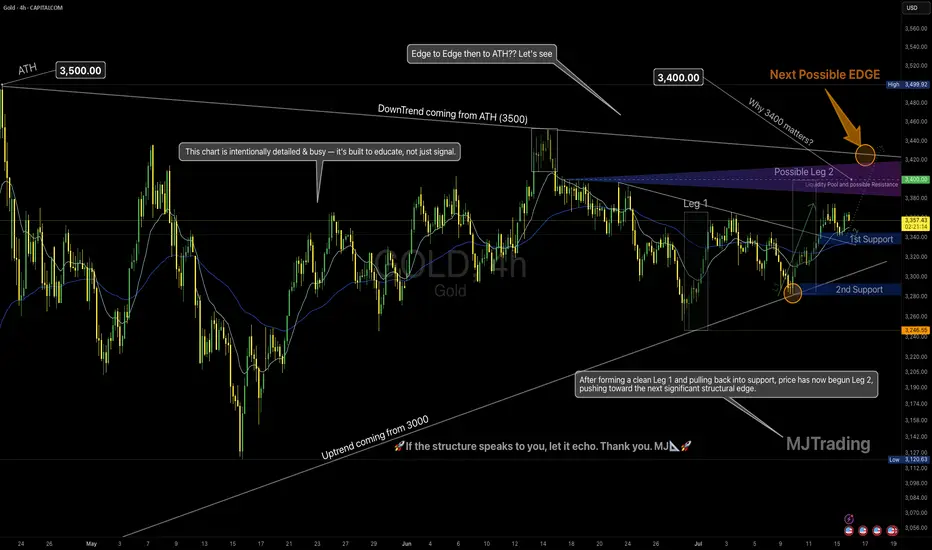
Leg 2 in Progress? | All Eyes on the Possible EDGE around 3400💡 GOLD 4H – MJTrading:
After forming a clean Leg 1 followed by a technical pullback into support, Gold has initiated Leg 2, pushing upward toward the next possible EDGE: 3400.
🟠 Why 3400 Matters
This zone is not just a round number:
It aligns with the long-term downtrend coming from the ATH (3500)
It’s the last reaction high before a deeper correction
There’s likely liquidity resting above — it’s where smart money may make decisions
This is where structure and psychology meet.
And end of 2 possible 2nd leg...
🔄 Possible Scenarios:
🟥 Scenario A – Rejection from the Edge (if could reach):
A reaction from this zone could lead to a pullback toward:
1st Support around 3340-3360
2nd Support near 3250 (also the uptrend line from 3000)
Use these zones to reassess momentum.
🟩 Scenario B – Breakout Above 3400:
A clean break above this structural edge opens the path for:
An “Edge to Edge” move back toward ATH (3500)
Possible higher timeframe trend shift — especially if retest holds
🧠 Our Strategy
We’re long-biased into the edge, not beyond it yet.
Let 3400 show its hand — we stay adaptive, not predictive.
🔍 This chart is intentionally detailed — it's built to educate, not just signal.
Focus on structure, sequence, and behavior — not just levels.
Lets Zoom in around the Breakout area...
And a Zoomout to Daily...
🧭 “If the structure speaks to you, let it echo.”
– MJTrading 🚀
📍#Gold #XAUUSD #TradingView #TechnicalAnalysis #ChartDesigner #MJTrading #MarketStructure #ForexIdeas #Edge
July 21 Special Update : Metals, SPY & More. What's Next.This special update is to highlight why I continue to believe traders should stay very cautious of this rally in the SPY/QQQ/BTCUSD.
Underlying economic data suggest that this is one big speculative rally following the April Tariff collapse.
And, the economic data I see from my custom indexes suggests the markets are moving into a very volatile and potentially dangerous topping pattern.
As I've stated many times in this video. I'm not saying the markets have topped and you should SELL EVERYTHING. I'm suggesting this market is extremely over-valued in terms of the underlying risk factors at play and the very clear data that suggests the markets are already in a recessionary price trend.
You may ask, "How can the markets continue to rally like this in a moderate recession?".
The answer is simple.
All bubbles end with a super-speculative phase. This phase is where everyone piles into a euphoric attempt to ride the rally higher.
It happened in the late 1990s. It has happened again through the 2000-2005+ housing bubble. Heck, it has occurred in the collectors market over the past few decades where people spent fortunes on the "hottest items" (think Beanie-Babies) only to find out they bought at the height of the bubble.
That is why I continue to urge traders to remain cautious and to withdraw profits from this speculative rally phase. Protect your investment capital immediately and consider the risks associated with the information I share in this video.
I'm not trying to scare anyone. I'm just trying to be realistic in terms of what I see in my data and why I believe now is the best time to MOVE TO SAFETY.
My data suggests that the markets are about to enter a fragile and potentially dangerous pullback phase. If you want to ride it out - go for it.
Otherwise, prepare for significant volatility over the next six months or more.
Get some.
#trading #research #investing #tradingalgos #tradingsignals #cycles #fibonacci #elliotwave #modelingsystems #stocks #bitcoin #btcusd #cryptos #spy #gold #nq #investing #trading #spytrading #spymarket #tradingmarket #stockmarket #silver

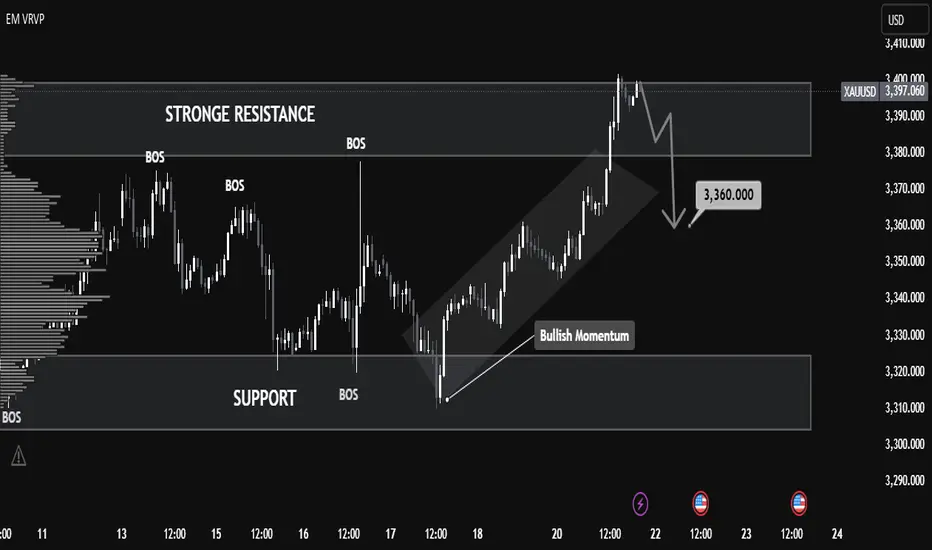
XAUUSD Analysis – Smart Money Perspective XAUUSD Analysis – Smart Money Perspective
🧠 Market Structure & BOS (Break of Structure):
The chart clearly shows multiple Break of Structure (BOS), confirming bullish intent.
After the final BOS around 3,370, price aggressively broke above resistance, forming a new high at 3,397.
This indicates bullish market momentum backed by strong demand.
🔎 Key Zones Identified:
🔼 Strong Resistance (3,390 – 3,400 Zone)
This level has been tested and now shows potential exhaustion, possibly trapping late buyers.
Price currently rejecting this zone with a bearish reaction.
🔽 Support Zone (3,300 – 3,320)
Prior consolidation and BOS originate from here.
Strong bullish OB and demand lie here—key area for future long setups.
📉 Expected Short-Term Move:
The projection arrow indicates a potential retracement toward 3,360, a previous BOS + potential FVG area.
This aligns with Smart Money's tendency to rebalance inefficiencies before continuation.
🔺 Volume Analysis (VRVP - Volume Profile):
Notice how high volume nodes align with the support and resistance zones.
Price is currently sitting in a low-volume gap, supporting the idea of a retracement to a more balanced area.
⚡ Momentum Shift Signal:
The steep angle of the last move up suggests possible liquidity grab above resistance.
Expectation: Price may dip to mitigate demand or OB before resuming the uptrend.
✅ Conclusion:
This chart illustrates a textbook SMC scenario:
Bullish BOS confirms structure shift.
Liquidity sweep above resistance may lead to a retracement.
3,360 is a key price point to watch for FVG fills or bullish continuation.