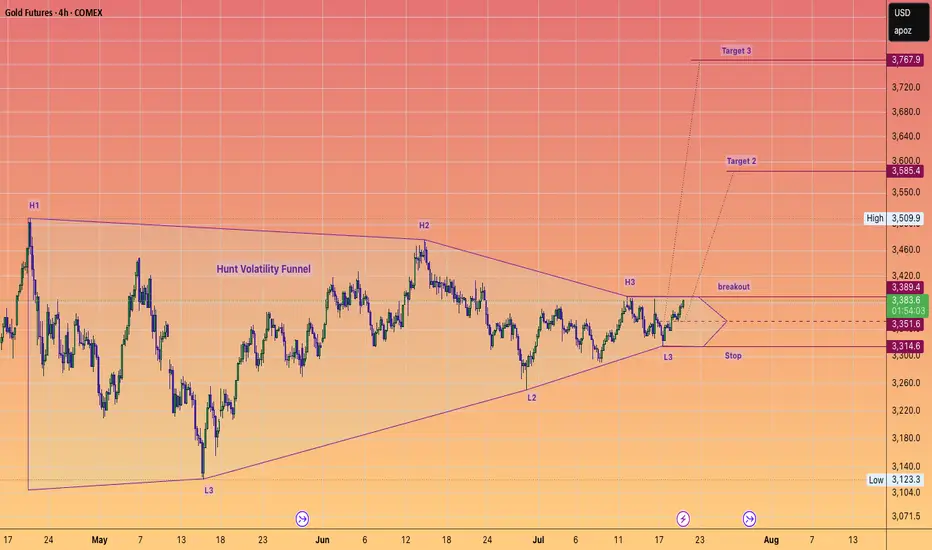
Trade Alert! GOLD to $3800 SOON.#HuntVolatilityFunnel setup which is about to trigger to the upside.
This setup should take gold to or very close to $4K IMHO
#GC
#GOLD
#SILVER
#METALS
Commodities
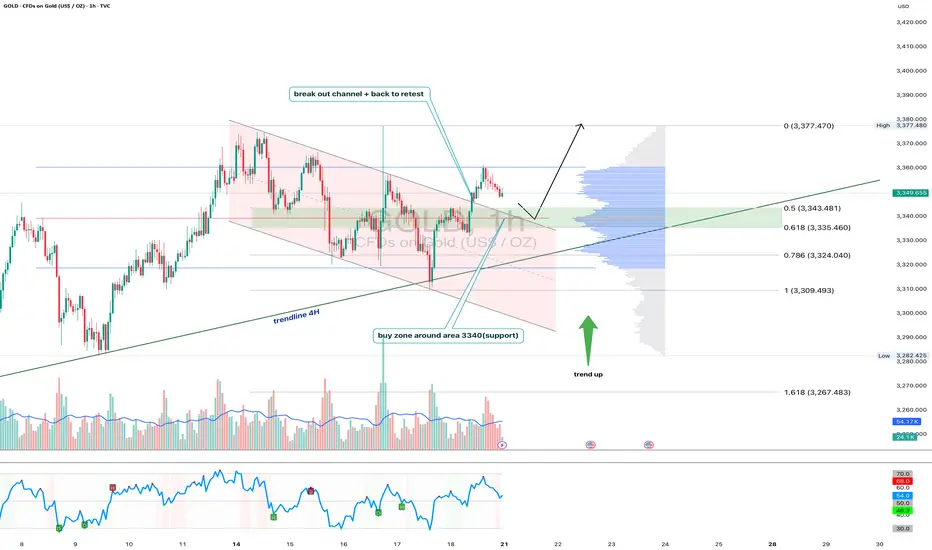
Gold 1H - Retest of channel & support zone at 3340After breaking out of the falling channel, gold is currently retesting its upper boundary — now acting as support. The 3340 zone is particularly important as it aligns with the 0.618 Fibonacci level and high volume node on the visible range volume profile. The price action suggests a potential bullish rejection from this area. With both the 50 and 200 EMA below price on the 1H, the short-term trend remains bullish. The 4H trendline further supports this setup. RSI is cooling off near the neutral zone, leaving room for another leg higher toward the 3377 resistance zone. If 3340 fails, 3324 (0.786 Fibo) becomes the next line of defense. Until then, the structure remains bullish following the successful breakout and retest of the channel.
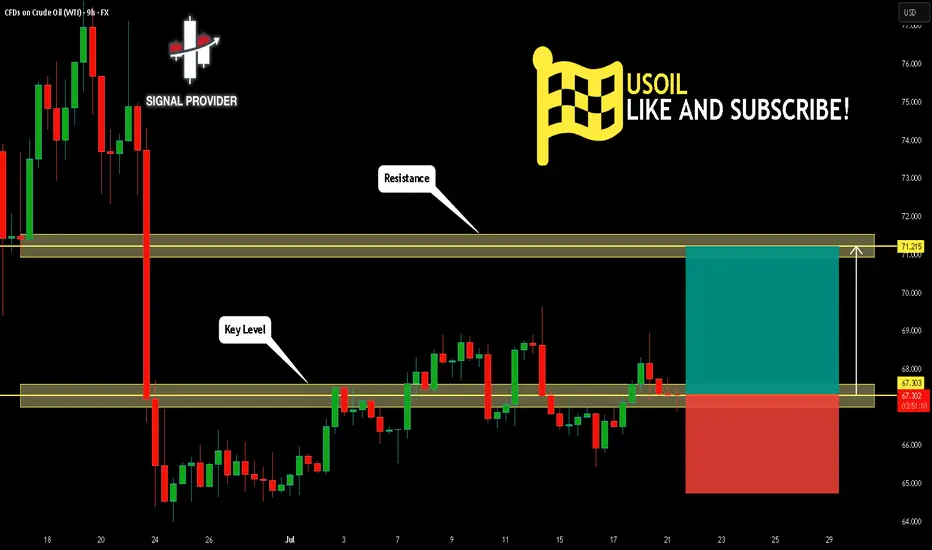
USOIL Will Go Higher! Buy!
Take a look at our analysis for USOIL.
Time Frame: 9h
Current Trend: Bullish
Sentiment: Oversold (based on 7-period RSI)
Forecast: Bullish
The market is approaching a key horizontal level 67.303.
Considering the today's price action, probabilities will be high to see a movement to 71.215.
P.S
We determine oversold/overbought condition with RSI indicator.
When it drops below 30 - the market is considered to be oversold.
When it bounces above 70 - the market is considered to be overbought.
Disclosure: I am part of Trade Nation's Influencer program and receive a monthly fee for using their TradingView charts in my analysis.
Like and subscribe and comment my ideas if you enjoy them!
Silver Bullish continuation breakout supported at 3686The Silver remains in a bullish trend, with recent price action showing signs of a continuation breakout within the broader uptrend.
Support Zone: 3686 – a key level from previous consolidation. Price is currently testing or approaching this level.
A bullish rebound from 3686 would confirm ongoing upside momentum, with potential targets at:
3814 – initial resistance
3865 – psychological and structural level
3920 – extended resistance on the longer-term chart
Bearish Scenario:
A confirmed break and daily close below 3686 would weaken the bullish outlook and suggest deeper downside risk toward:
3645 – minor support
3590 – stronger support and potential demand zone
Outlook:
Bullish bias remains intact while the Silver holds above 3686. A sustained break below this level could shift momentum to the downside in the short term.
This communication is for informational purposes only and should not be viewed as any form of recommendation as to a particular course of action or as investment advice. It is not intended as an offer or solicitation for the purchase or sale of any financial instrument or as an official confirmation of any transaction. Opinions, estimates and assumptions expressed herein are made as of the date of this communication and are subject to change without notice. This communication has been prepared based upon information, including market prices, data and other information, believed to be reliable; however, Trade Nation does not warrant its completeness or accuracy. All market prices and market data contained in or attached to this communication are indicative and subject to change without notice.

Gold bullish run continuation supported at 3308The Gold remains in a bullish trend, with recent price action showing signs of a continuation breakout within the broader uptrend.
Support Zone: 3308 – a key level from previous consolidation. Price is currently testing or approaching this level.
A bullish rebound from 3308 would confirm ongoing upside momentum, with potential targets at:
3387 – initial resistance
3400 – psychological and structural level
3435 – extended resistance on the longer-term chart
Bearish Scenario:
A confirmed break and daily close below 3308 would weaken the bullish outlook and suggest deeper downside risk toward:
3290 – minor support
3268 – stronger support and potential demand zone
Outlook:
Bullish bias remains intact while the Gold holds above 3308. A sustained break below this level could shift momentum to the downside in the short term.
This communication is for informational purposes only and should not be viewed as any form of recommendation as to a particular course of action or as investment advice. It is not intended as an offer or solicitation for the purchase or sale of any financial instrument or as an official confirmation of any transaction. Opinions, estimates and assumptions expressed herein are made as of the date of this communication and are subject to change without notice. This communication has been prepared based upon information, including market prices, data and other information, believed to be reliable; however, Trade Nation does not warrant its completeness or accuracy. All market prices and market data contained in or attached to this communication are indicative and subject to change without notice.

Gold is rising steadily.Gold technical analysis
Daily chart resistance: 3400, support: 3320
Four-hour chart resistance: 3390, support: 3340
One-hour chart resistance: 3375, support: 3348.
After bottoming out last Thursday, gold began to fluctuate upward on Friday, and the 1-hour bottom structure reappeared, which indicates that a new bullish opportunity has appeared again! It is worth noting that after breaking through 3344 on Friday, it continued to rise to around 3360. Today, after retreating to 3444 in the Asian session, it rose again. 3344 has become the top and bottom conversion position, so we can buy on dips based on the support of 3344. The second is the support at 3331.
In terms of intraday operations, the support below is 3344 and 3331, and it may not fall to around 3344. It is probably waiting to buy in the 3350-55 area. Pay attention to the key resistance around 3377 above. After the 15-minute top pattern appears, sell near this area.
Sell: 3375near
Buy: 3355near
Gold Nears $3,350 as Tariff Risks PersistGold rose to around $3,350 per ounce on Monday, extending its gains for a second session amid concerns over Trump’s tariff strategy. Commerce Secretary Howard Lutnick said a deal with the EU is likely but confirmed the August 1 tariff deadline. He also suggested smaller countries could face at least a 10% tariff, with some rates reaching 40%. Strong US data last week reduced expectations for an immediate Fed rate cut, capping gold’s gains. Markets now await comments from Fed Chair Powell and Governor Bowman for policy signals.
Gold faces resistance at 3380, with additional barriers at 3400 and 3430. Support levels are positioned at 3330, followed by 3295 and extending down to 3250.

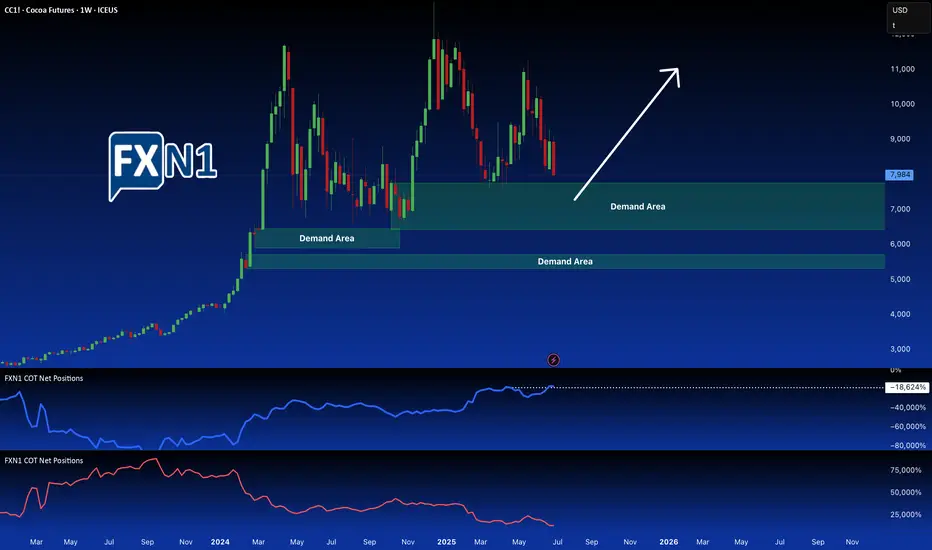
Cocoa Futures: CC1! Potential Pullback at Familiar Supply ZoneCocoa futures (CC1) are approaching a key demand zone previously tested in March 2025. This area, highlighted on the chart, presents a potential for a pullback, fueled by likely buy orders from commercial traders, as indicated by bullish sentiment evident in the latest Commitment of Traders (COT) report. We're watching for a reversal pattern within these highlighted zones, signaling a shift from the current upward trend. This anticipated pullback, driven by commercial market participation, could offer a compelling entry point for traders looking to capitalize on a potential reversal in the agricultural commodity.
✅ Please share your thoughts about CC1! in the comments section below and HIT LIKE if you appreciate my analysis. Don't forget to FOLLOW ME; you will help us a lot with this small contribution.
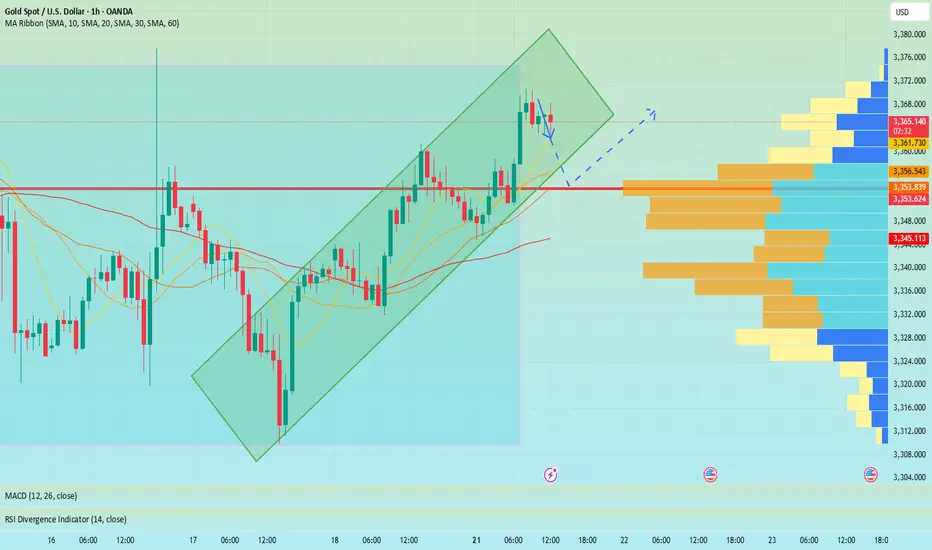
Gold is waiting for a pullback to break through 3400In the short term, gold is stuck in a sideways trend near 3365. It is not recommended to enter this point regardless of long or short positions. It is expected that there will be certain variables in the NY period. If gold retreats and falls in the short term as we expect, it may first touch around 3361. If it falls below 3361, it is expected to touch around 3353, which is also the point I gave this morning to see support.
Judging from the market, our focus on the upper side is still the 3375-3385 resistance area. If it can be effectively broken through, it is expected to hit the 3400-3420 mark. Although the daily MACD is oscillating near the zero axis, the 4H market shows that the oscillation is strong. Our trading strategy remains unchanged in the short term. The pullback in the NY period provides an opportunity, and we can consider going long. If there is new news during the day that requires adjustment, I will notify you immediately. Bros, please be patient and wait for trading opportunities.
OANDA:XAUUSD
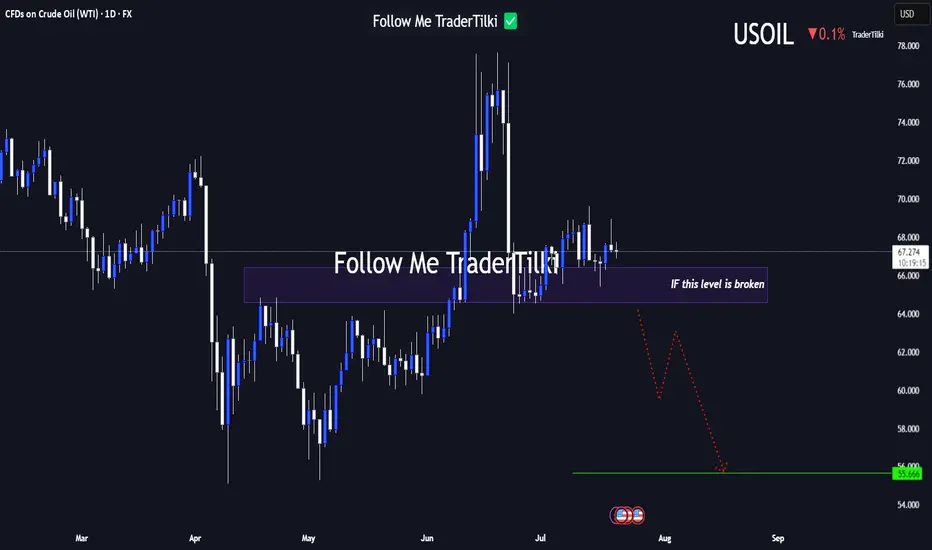
USOIL Under Technical Pressure: 1D Timeframe Breakdown Hey Guys,
The 66.584 level currently stands as the strongest support zone for USOIL. If this level breaks with a candle close, the next major target could drop to 55.666.
This setup is based on the 1-day timeframe. I highly recommend keeping a close watch on that key level.
Every like from you is my biggest motivation to keep sharing these insights. Thanks so much to everyone who’s showing support!
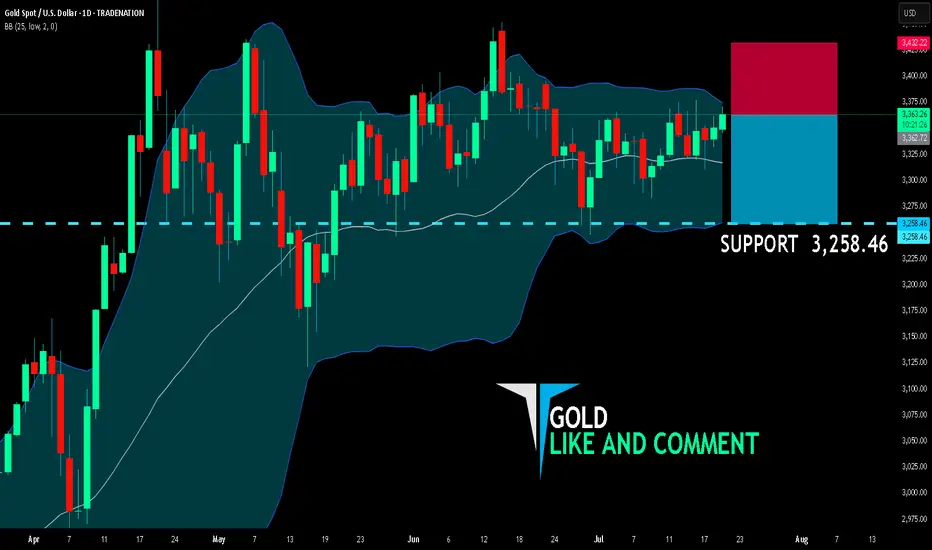
GOLD BEARS ARE GAINING STRENGTH|SHORT
GOLD SIGNAL
Trade Direction: short
Entry Level: 3,362.72
Target Level: 3,258.46
Stop Loss: 3,432.22
RISK PROFILE
Risk level: medium
Suggested risk: 1%
Timeframe: 1D
Disclosure: I am part of Trade Nation's Influencer program and receive a monthly fee for using their TradingView charts in my analysis.
✅LIKE AND COMMENT MY IDEAS✅
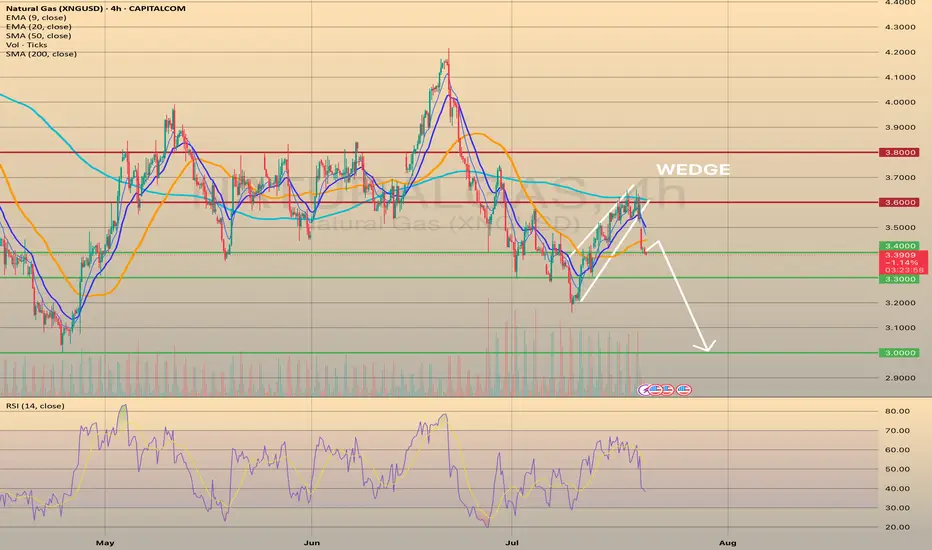
U.S. NATURAL GAS - BEARISH WEDGE WORKED OUT. WHAT'S NEXT?U.S. NATURAL GAS - BEARISH WEDGE WORKED OUT. WHAT'S NEXT?
Today, the market opened 2.66% below its closing price on Friday. The current price has already fallen on 4.8% since the closing on Friday, and it is now above the 3.400 support level. I expect further decline, however, with a possible rebound from the current level and pullback towards the SMA50, with a final target of 3.000.
GOLD Weekly Recap (Week 29) – MJTrading View📸 Viewing Tip:
🛠️ Some layout elements may shift depending on your screen size.
🔗 View the fixed high-resolution chart here:
Now that you have got the perfect layout let's dive in...
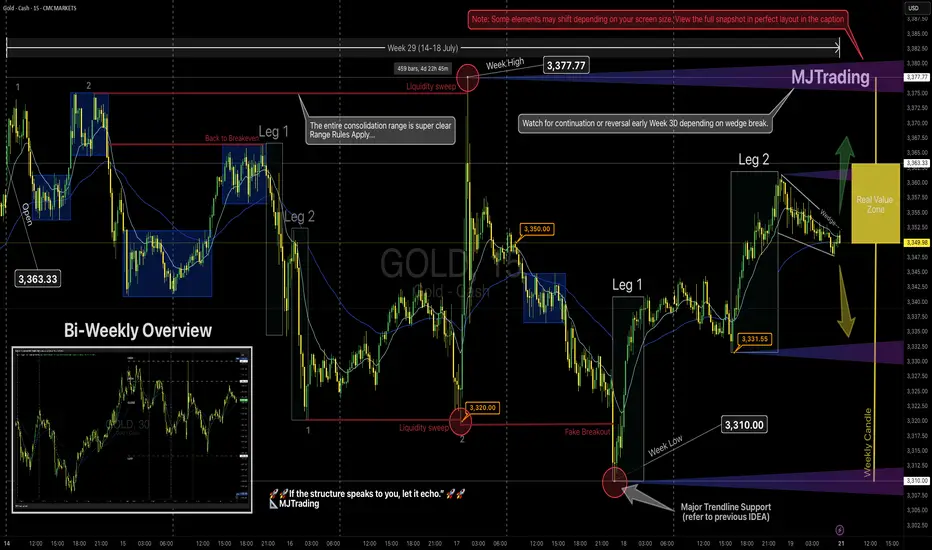
📈 GOLD Weekly Recap (Week 29) – MJTrading View
🕰 Timeframe: 15min chart with bi-weekly perspective
📅 Period Covered: July 14–18 (Week 29)
🎯 Visual Framework: Leg structure, range boundaries, liquidity sweeps, trendline holds, and Real Value Zone.
🔹 Weekly Summary
Open: 3,363.33
High: 3,377.77 (🔴 sweep: trapped buyers)
Low: 3,310.00 (🔴 sweep into key demand + touching the main ascending trendline )
Close: 3,349.98~3350 (lovely round level)
Structure: Entire week played inside a broad consolidation range, with sharp but failed breakouts on both extremes.
Range rules applied: traps, sweeps, compression — everything aligned for responsive trading.
📌 Key Observations
Early Week:
A double-top structure led to rejection from ~3,375 → slid into 3,350.
Price returned to breakeven but then flushed hard toward 3,320 via a clean 2-leg drop.
Midweek:
After forming a double bottom, price created a tiny liquidity sweep, then exploded to the weekly high.
The move above 3,377.77 was a textbook liquidity grab, immediately rejected.
This led to a slide toward the weekly low, tagging both the trendline and consolidation floor — forming a false breakout + reversal.
Late Week:
The low at 3,310 was swept cleanly (🔴), followed by a leg-based reversal:
Leg 1: Up to 3,331
Leg 2: Extended to ~3,360 before fading back inside the range.
Compression:
Price closed inside the Real Value Zone (weekly candle body) — just under the open, forming a tight wedge, hinting at breakout conditions for Week 30.
🟨 Weekly Candle Body
Open → Close of weekly candle reflects Real Value Zone .
Highs and lows were swept, but real commitment stayed within the body.
🧭 Key Levels to Watch – Week 30
Level Role
3,377.77 Weekly High / Liquidity Sweep (🔴 rejection)
3,363.33 Weekly Open (break & hold = bullish bias) / Previous Weekly High
3,350.00 Micro resistance / Mid-structure cap / Round Level
3,331-3 Leg 2 low & first reaction zone / Round Level
3,320.00 Breakdown support / Flush origin
3,310.00 Weekly Low / Major Demand (🔴 sweep)
3,400.00 Next possible main target
3,282.00 Previous Weekly Low
Dynamics: Both Uptrend and Downtrend Lines...
🧠 MJTrading Notes
Bias remains neutral inside the range.
A break & acceptance above 3,363 could trigger a re-test of the sweep zone (3,377+).
A breakdown below 3,331 puts 3,320 → 3,310 back on the map then 3,282.
Don’t force direction — let expansion confirm itself.
🧭 “If the structure speaks to you, let it echo.”
– MJTrading 🚀
#MJTrading #ChartDesigner #GOLD #LiquiditySweep #PriceAction #StructureTrading #Weekly #Chart #Consolidation #2legs
🧠 Psychology always matters:
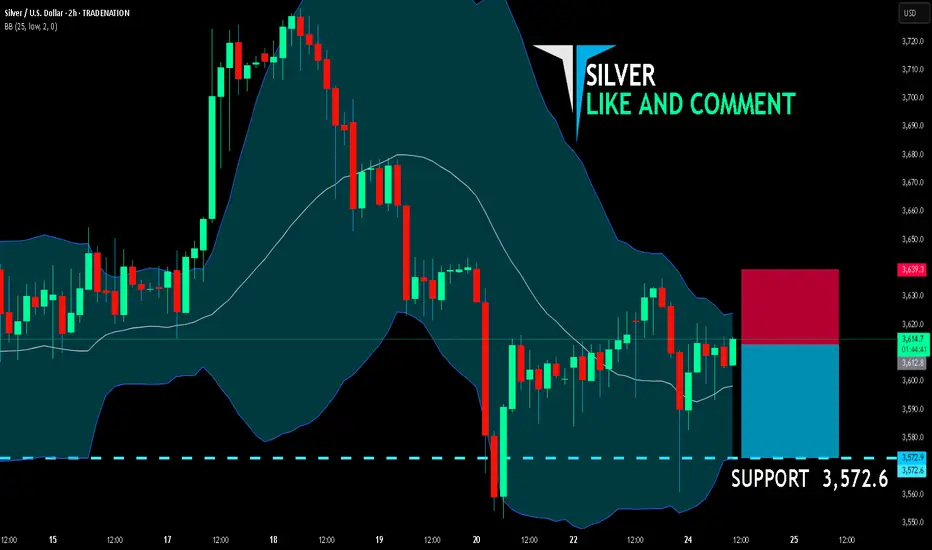
SILVER SELLERS WILL DOMINATE THE MARKET|SHORT
SILVER SIGNAL
Trade Direction: short
Entry Level: 3,612.8
Target Level: 3,572.6
Stop Loss: 3,639.3
RISK PROFILE
Risk level: medium
Suggested risk: 1%
Timeframe: 2h
Disclosure: I am part of Trade Nation's Influencer program and receive a monthly fee for using their TradingView charts in my analysis.
✅LIKE AND COMMENT MY IDEAS✅
XAUUSD ANALYSIS – JULY 18XAUUSD ANALYSIS – JULY 18: STRATEGY BASED ON FIBONACCI, TRENDLINE & STRUCTURE
1. XAUUSD Technical Overview (4H Chart)
Gold (XAUUSD) is currently trading around 3,343 USD, showing signs of a slight rebound from key support. On the 4H timeframe, the price structure is forming higher lows, maintaining above a short-term rising trendline – a technically bullish signal.
2. Key Support & Resistance Zones
Immediate Supports:
3,338 USD: aligning with the 0.618 Fibonacci retracement – a zone tested multiple times.
3,333 – 3,335 USD: strong support, overlapping with EMA and rising trendline.
3,327 USD: previous swing low – last defense for the bullish structure.
Immediate Resistances:
3,345 – 3,346 USD: frequently rejected zone in recent sessions.
3,350 USD: psychological and technical resistance.
3,358 USD: recent swing high – breakout confirmation level.
3. Price Action & Fibonacci Confluence
Price is currently hovering between Fibo 0.5 (3,343 USD) and Fibo 0.618 (3,338 USD) – a potential bounce zone if bullish momentum holds.
The pullback from 3,358 to 3,286 has respected standard Fibonacci retracement levels, confirming technical price behavior.
4. Trendline Analysis
The ascending trendline from the 3,275 USD low remains intact, providing solid dynamic support.
If the price continues to bounce from this trendline, it may form a bullish continuation pattern (flag/pennant).
5. Suggested Trading Strategies
Long
Entry: 3,338 – 3,340 USD
SL: 3,327 USD
TP: 3,345 – 3,350 – 3,358 USD
Note: Buying the dip near Fib & trendline
Short
Entry: Below 3,327 USD (breakdown)
SL: Above 3,340 USD
TP: 3,310 – 3,298 USD
Notes: Only if price breaks trendline & support
6. Supporting Technical Indicators
EMA20/EMA50 show slight upward momentum – early bullish bias.
RSI (14) hovers near 50 – neutral zone, awaiting breakout confirmation.
Conclusion:
Gold is consolidating around a critical support zone. The short-term bias leans bullish if the 3,338 – 3,333 USD region holds and price breaks above 3,346 – 3,350 USD.
This is a key moment to position early using Fibonacci and trendline confluence.
👉 Follow for more strategies in upcoming sessions. Save this if you find it useful!
Do you have a different view? Share your thoughts in the comments below!

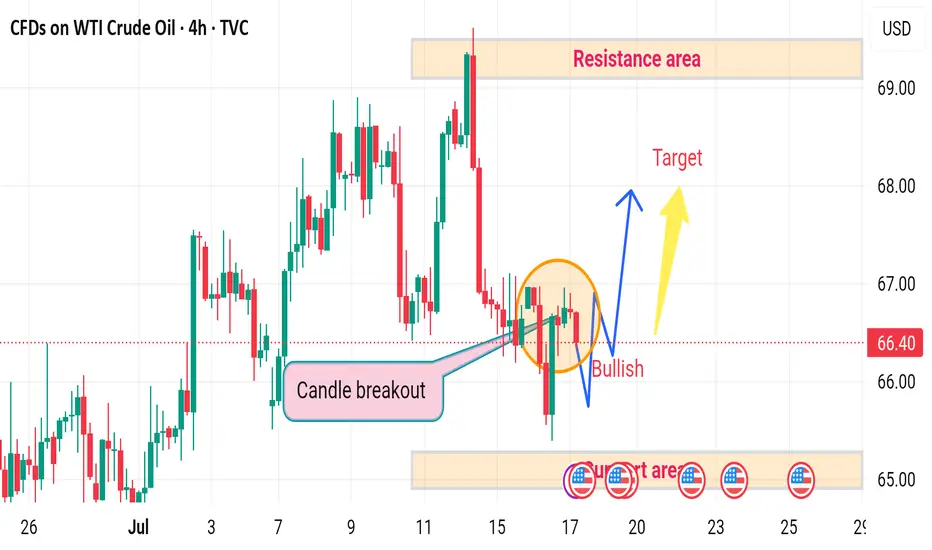
USOIL H4 bullish upward ⚠️ Disrupted Analysis – WTI Crude Oil (4H Chart)
🔻 Bearish Pressure Re-Entering
Despite a temporary candle breakout, the price failed to sustain above the breakout trendline.
The recent price action inside the orange circle shows lower highs and rejection wicks, indicating bullish weakness.
📉 Potential Breakdown Risk
If the price fails to hold above 66.00, there's a high probability of it breaking below the support area around 64.80–65.00, leading to:
Increased bearish momentum
Retesting lower demand zones, possibly around 63.50–64.00
❌ Resistance Area Still Valid
The Resistance area at 68.00–69.00 remains unchallenged.
The "Target" shown is optimistic under current momentum.
Without strong volume and bullish candles, that target remains unlikely in the near term.
🔁 Disruption Summary
The bullish breakout is likely a false breakout.
Market may be forming a bull trap.
Watch for a clean break below 65.00 for confirmation of a bearish reversal.
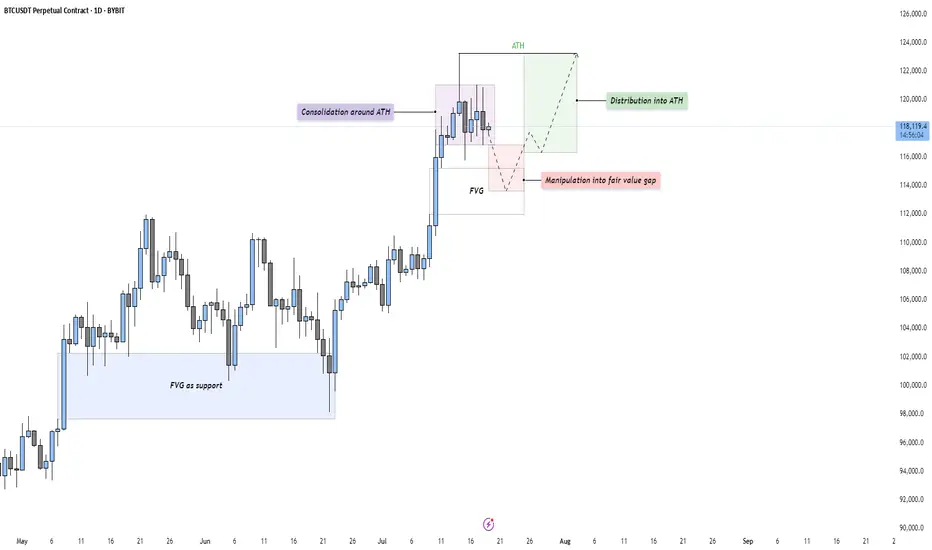
BTC - Consolidation, Manipulation & DistributionMarket Context
After a strong impulsive rally, Bitcoin is currently consolidating just beneath its All-Time High (ATH). This type of consolidation following an extended move higher often indicates indecision in the market — a pause that either leads to continuation or reversal. The current structure suggests that price is building energy for the next leg.
Consolidation and Liquidity Above ATH
The price action is tight and sideways around the ATH, which likely means liquidity is building above. Many stop-losses and breakout orders are sitting just overhead — classic conditions for a Buy Side Liquidity Sweep. This range may serve as a trap for early breakout traders, providing an opportunity for smart money to manipulate price lower before taking it higher.
Fair Value Gap Retest Scenario
Below the current range, we see a Daily Fair Value Gap that aligns with prior bullish imbalances. A move down into this Gap would represent a manipulation phase — shaking out weak longs before rebounding. The Gap also acts as a potential support level where buyers might be waiting. If price reaches into this zone and reacts strongly, it may offer a high-probability long setup.
Distribution or Reaccumulation?
While this could be interpreted as distribution beneath resistance, it’s equally valid to consider it a reaccumulation phase — a temporary markdown into demand before a fresh expansion. If the market dips into the Gap and quickly reclaims the range, it opens the door for a clean breakout above the ATH and continuation toward the 124,000–126,000 region.
Final Thoughts
Price rarely moves in a straight line. It pauses, retraces, and often tricks participants before making the real move. This type of consolidation presents opportunity — but also demands patience and clarity.
If you found this breakdown insightful, a like would be much appreciated! And I’d love to hear your thoughts in the comments — are we about to sweep down into demand, or is the rocket already on the launchpad?
Gold 30Min Engaged ( Bullish Reversal Entry Detected )————-
➕ Objective: Precision Volume Execution
Time Frame: 30-Minute Warfare
Entry Protocol: Only after volume-verified breakout
🩸 Bullish Reversal From : 3341.5 Zone
➗ Hanzo Protocol: Volume-Tiered Entry Authority
➕ Zone Activated: Dynamic market pressure detected.
The level isn’t just price — it’s a memory of where they moved size.
Volume is rising beneath the surface — not noise, but preparation.
🔥 Tactical Note:
We wait for the energy signature — when volume betrays intention.
The trap gets set. The weak follow. We execute.

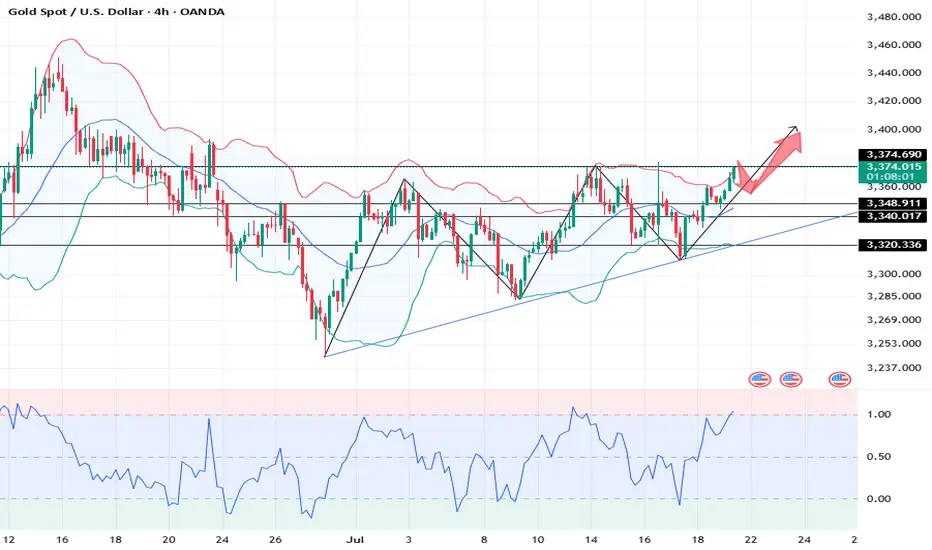
DeGRAM | GOLD above the resistance level📊 Technical Analysis
● Bulls defended the channel base at 3 333, snapping the intraday falling wedge and reclaiming the broken trend-line; successive higher-lows since 17 Jul signal fresh upside momentum.
● A clean H1 close over the former pivot 3 355 flips the wedge crest into support and activates the measured-move target at the upper horizontal barrier 3 366, with the March swing cap 3 389 next.
💡 Fundamental Analysis
● Softer US jobless-claims trend and Fed speakers’ hints that “policy is restrictive enough” cooled two-year real yields, while PBoC’s June data showed net gold purchases for a fourth month—both underpinning spot demand.
✨ Summary
Long 3 345-3 355; hold above 3 355 targets 3 366 → 3 389. Bias void on an H1 close beneath 3 333.
-------------------
Share your opinion in the comments and support the idea with a like. Thanks for your support!

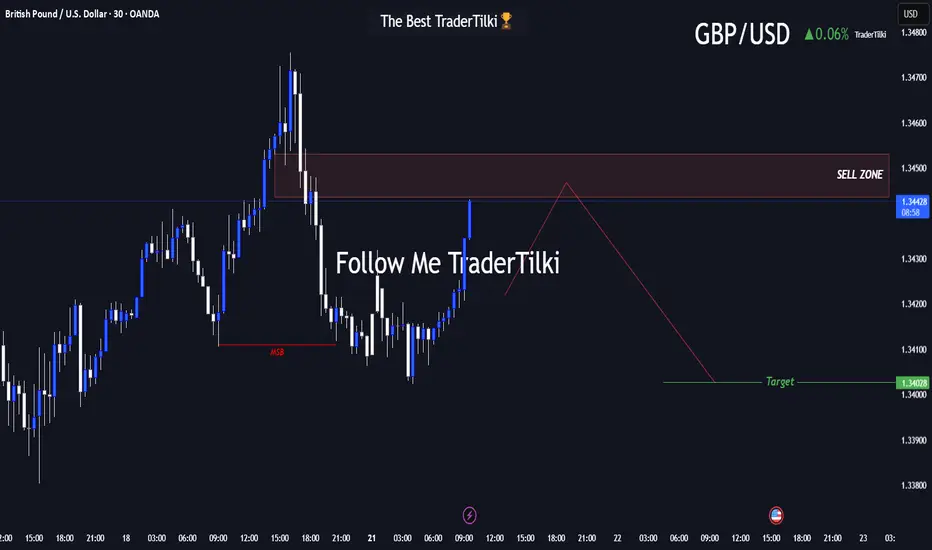
Major Levels Ahead: GBPUSD Trade Setup UnveiledHey friends, I’ve prepared a fresh GBPUSD analysis for you!
📍 Target level: 1.34028
🔻 SELL zone: Between 1.34532 and 1.34437
I expect the trade to reach its target during the London or New York session.
Every like and show of support fuels my motivation to share more analysis—thank you all for being part of this journey!
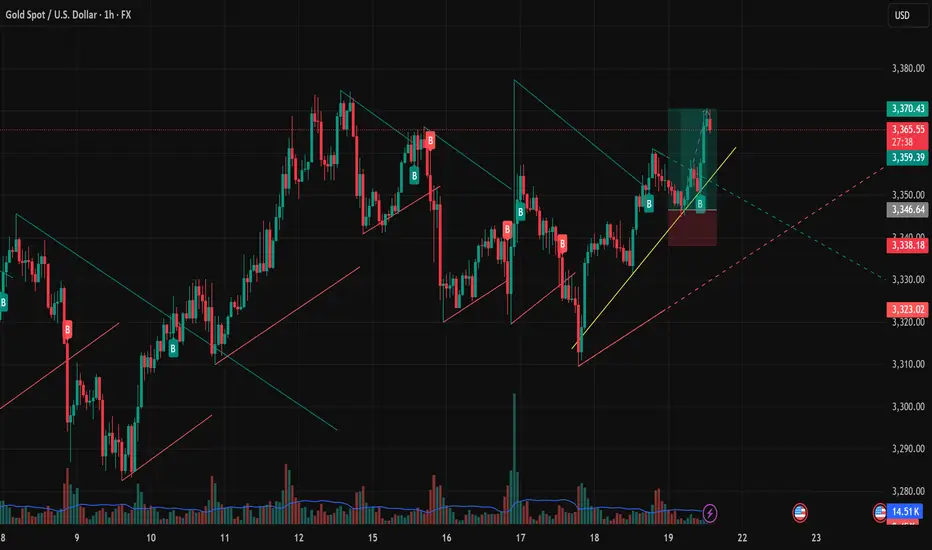
XAUUSD 21/07 - Will the Bullish Momentum Continue?In today’s session (July 21), the 1H chart of XAUUSD shows a confirmed breakout above the medium-term descending trendline. The bullish momentum originated from a strong rebound at the confluence zone of support, EMA, and ascending trendline — suggesting a high-probability continuation setup for the short term.
Technical Analysis Overview:
🔹 Price Action Structure:
Price broke out of a falling wedge / descending triangle with a strong bullish Marubozu candle, confirming the breakout move.
Breakout was supported by increased volume, indicating strong institutional buying near 3,346–3,350.
🔹 Trendlines and EMA Outlook:
Price is currently holding above the ascending yellow trendline.
Short-term EMAs (e.g., EMA20/50, not shown) are likely sloping upwards and sitting below price, confirming bullish market structure.
🔹 Key Support and Resistance Levels:
Immediate Resistance: 3,370 USD – recently tested previous swing high.
Major Resistance: 3,378 – 3,385 USD – Fibonacci projection and previous supply zone.
Short-term Support: 3,359 USD – minor pullback zone and EMA alignment.
Major Support: 3,346 USD – the breakout retest zone and price structure support.
Suggested Trading Strategies:
Scenario 1: Buy the Dip
Entry: Near 3,359 – 3,346 USD (on minor retracement)
Stop Loss: Below 3,338 USD (to invalidate the breakout zone)
Target 1: 3,370 USD
Target 2: 3,378 – 3,385 USD
Scenario 2: Breakout Continuation Buy
If price breaks above 3,370 with strong candle + volume:
Entry: Around 3,372 – 3,374 USD
Stop Loss: 3,359 USD
Target: 3,385 – 3,392 USD
Additional Indicators to Watch:
RSI (not shown): If approaching 70+, watch for bearish divergence or exhaustion signals.
Volume: Sustained or increasing volume will confirm strength of the uptrend.
Conclusion:
XAUUSD is showing strong bullish technical signals after breaking the descending trendline and successfully retesting the breakout level. As long as price holds above 3,346 – 3,350, the short-term bullish structure remains intact.
- Follow for more high-quality trading strategies and daily gold analysis. Save this idea if you find it useful for your trading setup!
What’s your view on this analysis? Let’s discuss more in the comments below!
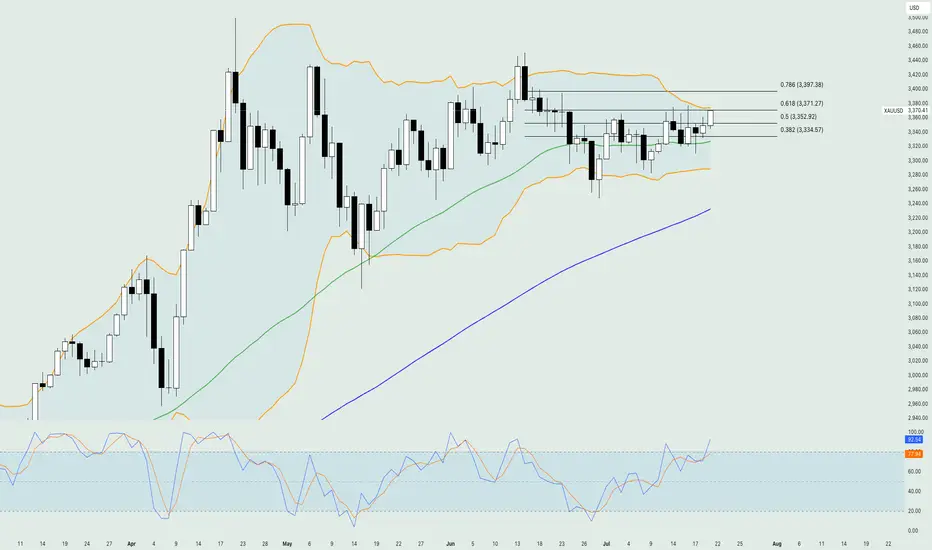
Gold - DAILY- 21.07.2025Gold held steady near $3,350 an ounce as markets opened Monday, with traders assessing mixed signals from Federal Reserve officials on the inflation impact of Trump’s tariff plans. Some Fed governors, like Waller and Bowman, signaled openness to rate cuts, while others remain cautious due to inflation risks. Trump continues pressuring the Fed to lower rates, with speculation about replacing Chair Jerome Powell. Meanwhile, EU officials are preparing for potential trade fallout as Trump’s Aug. 1 tariff deadline approaches. Gold is up over 25% this year, driven by geopolitical tensions and demand for safe-haven assets.
From a technical point of view, the price of gold found sufficient support on the 38.2% of the weekly Fibonacci retracement level and is currently testing the resistance on the 50% around $3,355. The moving averages are confirming the overall bullish trend in the market, while at the same time, the Stochastic oscillator is near the extreme overbought level, hinting at a potential bearish correction move in the upcoming sessions. The Bollinger bands are quite expanded, showing that volatility is there to support any short-term move to either side, while the level around $3,380 is the first major technical resistance area consisting of the upper band of the Bollinger bands and the 61.% of the weekly Fibonacci retracement level.
Disclaimer: The opinions in this article are personal to the writer and do not reflect those of Exness
Crude Oil -DAILY- 21.07.2025Oil prices were steady after their first weekly decline this month, as attention shifted to U.S. trade negotiations and the European Union’s push to tighten restrictions on Russian energy exports. The EU is preparing new sanctions, including a lower price cap on Russian crude, limits on fuel refined from Russian oil, banking restrictions, and bans targeting an Indian refinery and Chinese firms. Despite western sanctions, Russian oil continues flowing to China and India. Meanwhile, diesel margins in Europe remain strong, signaling tight supply.
On the technical side, the price of crude oil has failed to break below the major technical support area, which consists of the 50-day simple moving average and the 50% of the weekly Fibonacci retracement level. The Stochastic oscillator has been in the neutral level since last week hinting that there is potential for the price to move to either direction in the near short term. On the other hand, the Bollinger bands have contracted rather massively showing that volatility has dried up therefore, the recent sideways movement might extend in the upcoming sessions.
Disclaimer: The opinions in this article are personal to the writer and do not reflect those of Exness
