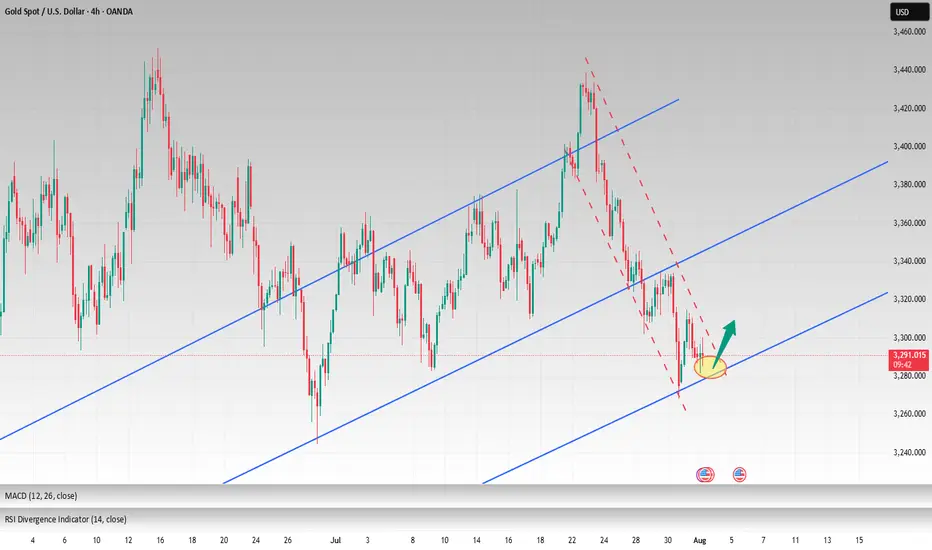
How to maintain stable operations before NFP dataYesterday, gold closed the month with a long upper shadow doji candlestick, indicating strong upward pressure, with monthly resistance at 3439-3451. Today marks the beginning of the month, and with the release of numerous data indicators such as NFP, unemployment benefits, and PMI, there is considerable uncertainty, so intraday trading should proceed with caution.
Judging from the daily chart, the current MACD indicator is dead cross with large volume, and the smart indicator is running oversold, indicating a low-level fluctuation trend during the day. At present, we need to pay attention to the SMA60 moving average and the daily middle track corresponding to 3327-3337 on the upper side, and pay attention to the intraday low around 3280 on the lower side. The lows of the previous two days at 3275-3268 cannot be ignored. There is a possibility that the low-level oscillation will touch the previous low again.
From the 4H chart, technical indicators are currently flat, with no significant short-term fluctuations expected. Low-level volatility is expected to persist within the day. Then just focus on the support near 3275 below and the middle track pressure near 3307 above. Looking at the hourly chart, gold is currently oscillating below the mid-range band, with resistance at 3295-3307 to watch in the short term.
Overall, the market is expected to remain volatile before the release of today's data. Based on Wednesday's ADP data, this round of data is also expected to be around $100,000. The contrast between ADP and NFP last time deserves our caution. The current market is basically optimistic about the short-selling situation, which is exactly what I am most worried about. If the gold price can stabilize above 3,300 before the NY data, the possibility of NFP data being bullish cannot be ruled out.
Intraday European trading suggestion: if the current gold price falls back to 3285-3280 and stabilizes, you can consider short-term long positions, with the target at 3295-3305. If the gold price tests the low of 3275-3268 again and does not break through, you can consider a second chance to go long. After making a profit of $10-20, you can consider exiting the market with profits. The market is volatile and unstable, so be sure to bring SL with you and pay close attention to the impact of the NFP data. Conservative investors can enter the market after the data is released.
Commodities
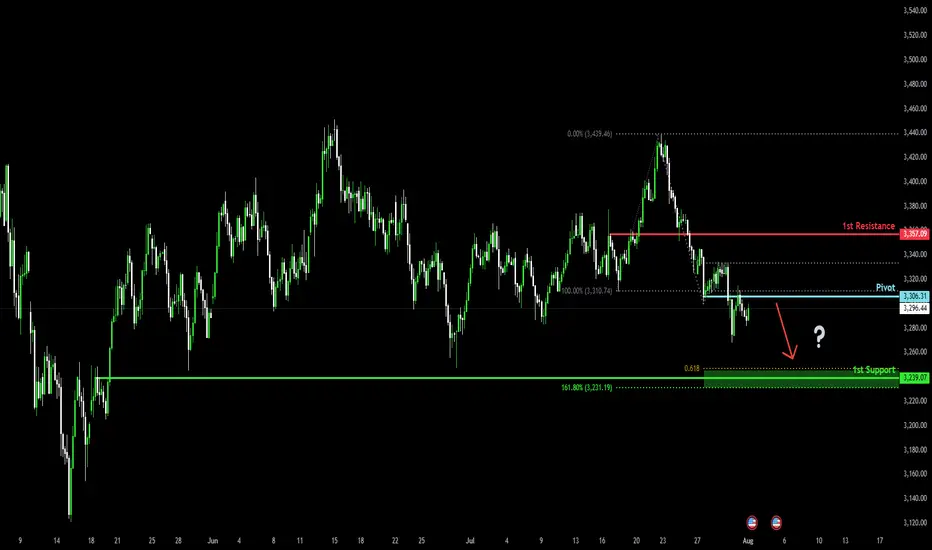
Potential bearish drop?The Gold (XAU/USD) has reacted off the pivot and could drop to the 1st support.
Pivot: 3,306.31
1st Support: 3,239.07
1st Resistance: 3,357.09
Risk Warning:
Trading Forex and CFDs carries a high level of risk to your capital and you should only trade with money you can afford to lose. Trading Forex and CFDs may not be suitable for all investors, so please ensure that you fully understand the risks involved and seek independent advice if necessary.
Disclaimer:
The above opinions given constitute general market commentary, and do not constitute the opinion or advice of IC Markets or any form of personal or investment advice.
Any opinions, news, research, analyses, prices, other information, or links to third-party sites contained on this website are provided on an "as-is" basis, are intended only to be informative, is not an advice nor a recommendation, nor research, or a record of our trading prices, or an offer of, or solicitation for a transaction in any financial instrument and thus should not be treated as such. The information provided does not involve any specific investment objectives, financial situation and needs of any specific person who may receive it. Please be aware, that past performance is not a reliable indicator of future performance and/or results. Past Performance or Forward-looking scenarios based upon the reasonable beliefs of the third-party provider are not a guarantee of future performance. Actual results may differ materially from those anticipated in forward-looking or past performance statements. IC Markets makes no representation or warranty and assumes no liability as to the accuracy or completeness of the information provided, nor any loss arising from any investment based on a recommendation, forecast or any information supplied by any third-party.
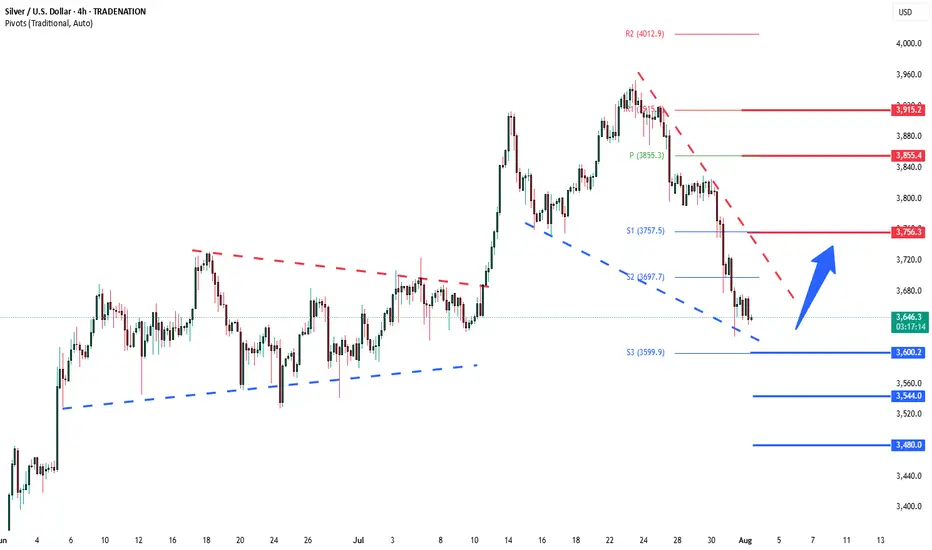
Silver coiling price action support at 3600The Silver remains in a bullish trend, with recent price action showing signs of a continuation breakout within the broader uptrend.
Support Zone: 3600 – a key level from the previous consolidation. Price is currently testing or approaching this level.
A bullish rebound from 3600 would confirm ongoing upside momentum, with potential targets at:
3756 – initial resistance
3855 – psychological and structural level
3915 – extended resistance on the longer-term chart
Bearish Scenario:
A confirmed break and daily close below 3600 would weaken the bullish outlook and suggest deeper downside risk toward:
3544 – minor support
3480 – stronger support and potential demand zone
Outlook:
Bullish bias remains intact while the Silver holds above 3600. A sustained break below this level could shift momentum to the downside in the short term.
This communication is for informational purposes only and should not be viewed as any form of recommendation as to a particular course of action or as investment advice. It is not intended as an offer or solicitation for the purchase or sale of any financial instrument or as an official confirmation of any transaction. Opinions, estimates and assumptions expressed herein are made as of the date of this communication and are subject to change without notice. This communication has been prepared based upon information, including market prices, data and other information, believed to be reliable; however, Trade Nation does not warrant its completeness or accuracy. All market prices and market data contained in or attached to this communication are indicative and subject to change without notice.
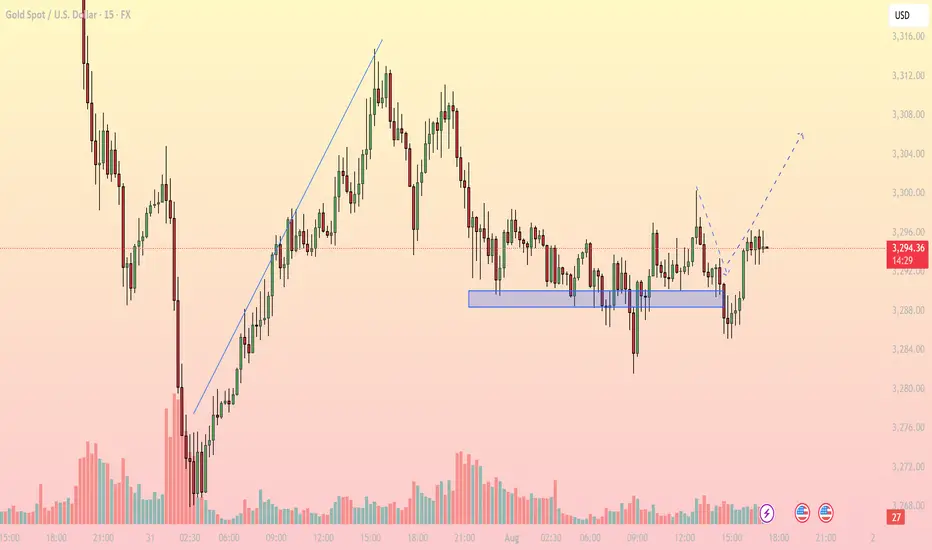
Bullish Rejection from Support, Upside in FocusMarket Overview: On the M15 timeframe, XAUUSD shows signs of a short-term bullish reversal after a prolonged sideways range around the key support zone of 3,286 – 3,289 USD. Price faked out below this support but quickly recovered, forming a V-shape reversal, suggesting strong buying interest has returned.
Key Levels to Watch:
Support Zones:
- 3,286 – 3,289: Strong intraday support, tested multiple times with sharp rejections
- 3,274: Next significant support if the above zone fails
Resistance Zones:
- 3,300 – 3,304: First resistance target aligned with the recent high
- 3,308 – 3,312: Higher resistance area where supply may emerge
Technical Indicators:
EMA: Price has reclaimed the short-term EMAs, indicating bullish momentum on lower timeframes
RSI: Rising above 50 but not yet overbought – there’s room for further upside
Volume: Increasing volume during the bounce confirms buying strength
Trading Strategy:
- Bullish Scenario (Preferred): Entry Zone: Watch for pullback toward 3,290 – 3,292
Stop Loss: Below 3,285
Take Profit 1: 3,300
Take Profit 2: 3,304
Extended Target: 3,308 – 3,312 (if bullish momentum continues beyond breakout zone)
- Bearish Scenario (Alternate): Only valid if price breaks and closes strongly below 3,286
Short Target: 3,274 – 3,270
Note: Counter-trend strategy – higher risk, requires strong confirmation
Conclusion: Gold is showing a bullish price structure on the 15-minute chart. As long as price holds above the 3,286 – 3,289 support zone, the path of least resistance appears to be upward, with 3,300 and 3,304 as the next logical targets. Monitor price action closely during the U.S. session for a potential long setup.
- Follow for more real-time gold trading strategies and save this idea if you find it helpful!
XAUUSD Intraday Technical Analysis – Bullish Breakout SetupGold (XAUUSD) is showing signs of bullish recovery after a sharp sell-off, with current price action around 3305.86 USD hinting at a potential breakout on the 1-hour timeframe.
- Technical Overview
Price structure: After a steep decline, gold formed a base near the 3284–3299 zone and is now climbing back, with a potential inverse head-and-shoulders formation taking shape.
EMA cluster: Price is approaching the confluence of the EMA 50, EMA 100, and EMA 200, currently acting as dynamic resistance around 3309–3323. A break above these levels may confirm bullish strength.
Fibonacci retracement: The bounce appears from the 0.874 extension, indicating the end of the previous bearish leg.
Volume analysis: Increasing bullish volume supports the idea of a potential breakout.
- Key Levels to Watch
Zone Type
Price Level (USD)
Remarks
Immediate Resistance: 3,309 – 3,323 - Major test zone; overlaps with EMA 50/100
Major Resistance : 3,337 – 3,340 - Previous high; if broken confirms bullish continuation
Support Zone: 3,299 – 3,302 - Intraday support turned demand zone
Critical Support: 3,284 – 3,285 - Recent swing low; invalidates bullish view if broken
- Intraday Strategy Suggestion
Scenario 1 – Bullish Breakout
Entry: Buy on breakout and retest of 3,309–3,323
SL: Below 3,299
TP1: 3,337
TP2: 3,355
- Confirmation by strong bullish candle closing above EMA cluster and above resistance zone.
Scenario 2 – Buy on Pullback
Entry: Buy limit at 3,300–3,302
SL: Below 3,284
TP1: 3,323
TP2: 3,337
- Look for RSI divergence or bullish engulfing candle at support for higher conviction.
- Final Note
The bulls are attempting to reclaim momentum after a major correction. If gold can sustain above the 3,309 resistance and hold the 3,300 base, a short-term bullish reversal could materialize.

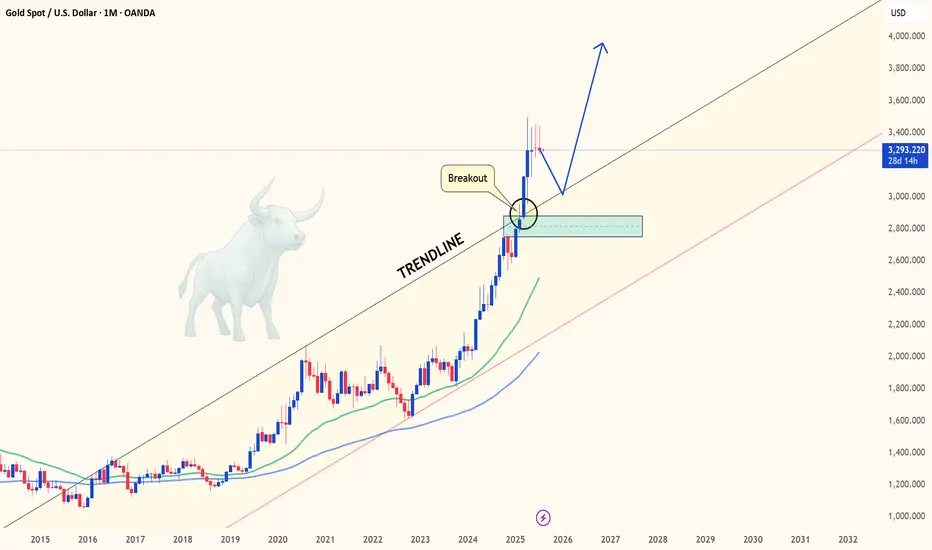
GOLD - Monthly breakout retest may confirm multi-year bull cycleHello everyone, what are your thoughts on the long-term outlook for XAUUSD?
Looking at the monthly chart (1M), we can clearly see that XAUUSD has broken out of the long-standing ascending channel that has held since 2015 — a major signal suggesting the start of a new bullish cycle. Price is now retesting the previously broken trendline, hinting at the possibility of a fresh upward leg to resume the longer-term bullish trend we've seen recently.
Personally, I'm targeting $3,600 in the medium term, and potentially $4,000 by 2026–2028 if institutional capital continues to rotate back into safe-haven assets like gold.
What about you — do you think BTC/USD will rise or fall in the coming years?
And what’s your target for it?
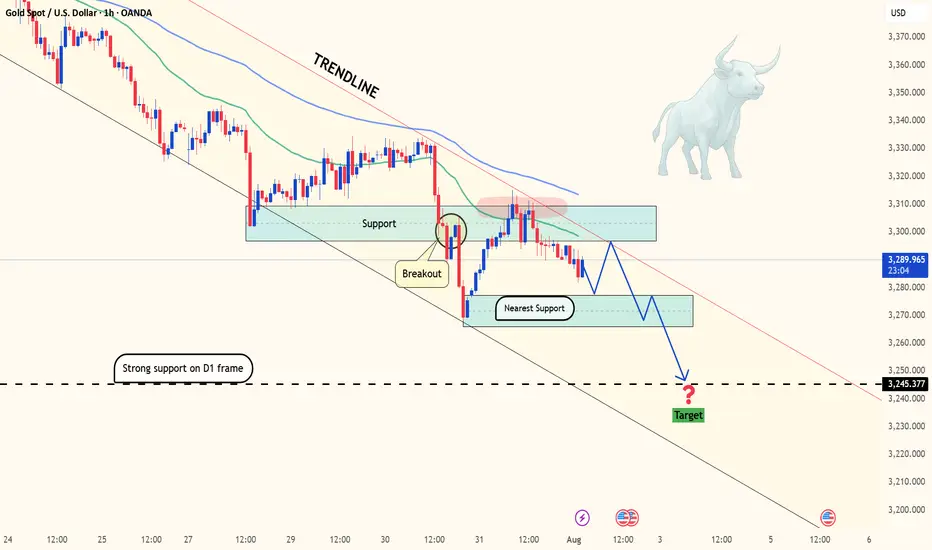
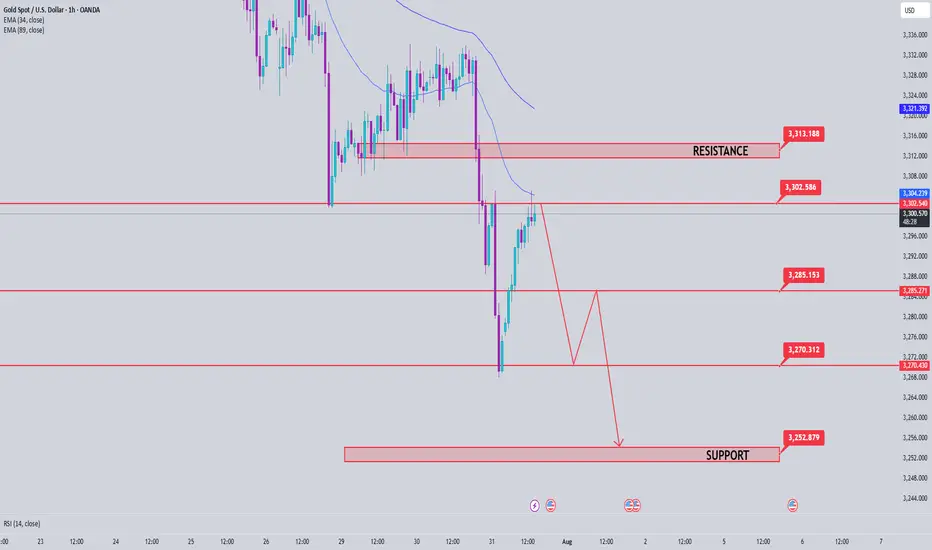
Gold on the edge: Will 3,270 break as Fed pressure builds?Hello traders, what’s your view on XAUUSD?
Yesterday, gold remained under pressure as a series of fresh U.S. economic data reinforced expectations that the Federal Reserve will keep interest rates higher for longer. As a result, U.S. Treasury yields surged, the dollar strengthened, and gold came under renewed selling pressure. Currently, XAUUSD is trading around 3,288 USD, down 0.04% on the day.
From a technical standpoint, gold is clearly trading within a well-defined downward-sloping channel, confirming the dominance of bearish momentum. Moreover, both the EMA34 and EMA89 are acting as dynamic resistance levels, repeatedly rejecting any short-term recovery attempts—highlighting the strength of the current downtrend.
If a pullback occurs before the next leg lower, the confluence of resistance and the EMA zone will be crucial to watch. It could offer ideal conditions for potential short setups in line with the trend.
Looking ahead, the next key support lies at 3,270 USD. A break below this level could open the door for a deeper move toward the 32XX area.
What do you think? Will gold continue to drop further?
Good luck and trade safe!
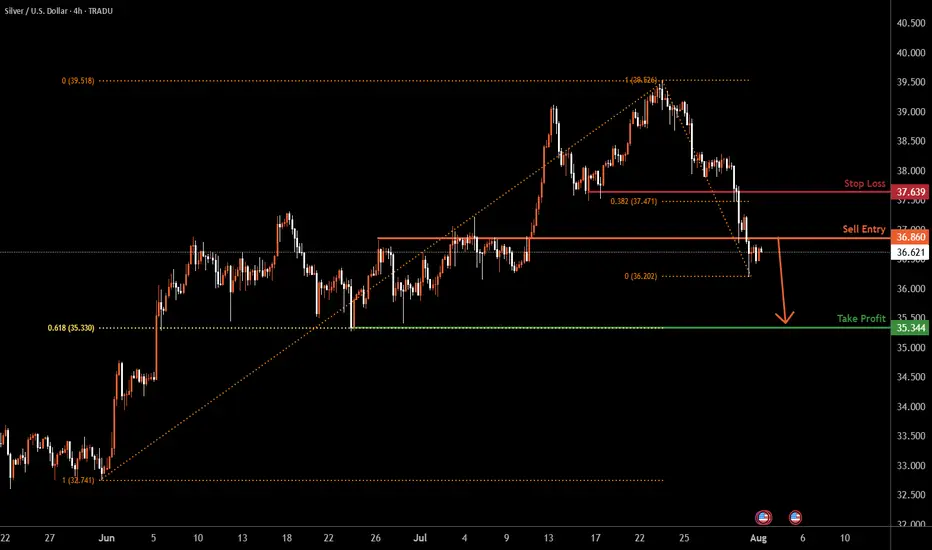
Silver H4 | Potential bearish dropBased on the H4 chart analysis, we could see the price reverse from the sell entry at 3.86, and could drop from this level to the downside.
Stop loss is at 37.63, which is a pullback resistance that is slightly above the 38.2% Fibonacci retracement.
Take profit is at 35.34, which is a swing low support that lines up with th e 61.8% Fibonacci retraecment.
High Risk Investment Warning
Trading Forex/CFDs on margin carries a high level of risk and may not be suitable for all investors. Leverage can work against you.
Stratos Markets Limited (tradu.com ):
CFDs are complex instruments and come with a high risk of losing money rapidly due to leverage. 65% of retail investor accounts lose money when trading CFDs with this provider. You should consider whether you understand how CFDs work and whether you can afford to take the high risk of losing your money.
Stratos Europe Ltd (tradu.com ):
CFDs are complex instruments and come with a high risk of losing money rapidly due to leverage. 66% of retail investor accounts lose money when trading CFDs with this provider. You should consider whether you understand how CFDs work and whether you can afford to take the high risk of losing your money.
Stratos Global LLC (tradu.com ):
Losses can exceed deposits.
Please be advised that the information presented on TradingView is provided to Tradu (‘Company’, ‘we’) by a third-party provider (‘TFA Global Pte Ltd’). Please be reminded that you are solely responsible for the trading decisions on your account. There is a very high degree of risk involved in trading. Any information and/or content is intended entirely for research, educational and informational purposes only and does not constitute investment or consultation advice or investment strategy. The information is not tailored to the investment needs of any specific person and therefore does not involve a consideration of any of the investment objectives, financial situation or needs of any viewer that may receive it. Kindly also note that past performance is not a reliable indicator of future results. Actual results may differ materially from those anticipated in forward-looking or past performance statements. We assume no liability as to the accuracy or completeness of any of the information and/or content provided herein and the Company cannot be held responsible for any omission, mistake nor for any loss or damage including without limitation to any loss of profit which may arise from reliance on any information supplied by TFA Global Pte Ltd.
The speaker(s) is neither an employee, agent nor representative of Tradu and is therefore acting independently. The opinions given are their own, constitute general market commentary, and do not constitute the opinion or advice of Tradu or any form of personal or investment advice. Tradu neither endorses nor guarantees offerings of third-party speakers, nor is Tradu responsible for the content, veracity or opinions of third-party speakers, presenters or participants.
Falling towards 50% Fibonacci support?WTI Oil (XTI/USD) is falling towards the pivot, which has been identified as a pullback support and could bounce to the 1st resistance.
Pivot: 68.21
1st Support: 65.56
1st Resistance: 72.91
Risk Warning:
Trading Forex and CFDs carries a high level of risk to your capital and you should only trade with money you can afford to lose. Trading Forex and CFDs may not be suitable for all investors, so please ensure that you fully understand the risks involved and seek independent advice if necessary.
Disclaimer:
The above opinions given constitute general market commentary, and do not constitute the opinion or advice of IC Markets or any form of personal or investment advice.
Any opinions, news, research, analyses, prices, other information, or links to third-party sites contained on this website are provided on an "as-is" basis, are intended only to be informative, is not an advice nor a recommendation, nor research, or a record of our trading prices, or an offer of, or solicitation for a transaction in any financial instrument and thus should not be treated as such. The information provided does not involve any specific investment objectives, financial situation and needs of any specific person who may receive it. Please be aware, that past performance is not a reliable indicator of future performance and/or results. Past Performance or Forward-looking scenarios based upon the reasonable beliefs of the third-party provider are not a guarantee of future performance. Actual results may differ materially from those anticipated in forward-looking or past performance statements. IC Markets makes no representation or warranty and assumes no liability as to the accuracy or completeness of the information provided, nor any loss arising from any investment based on a recommendation, forecast or any information supplied by any third-party.
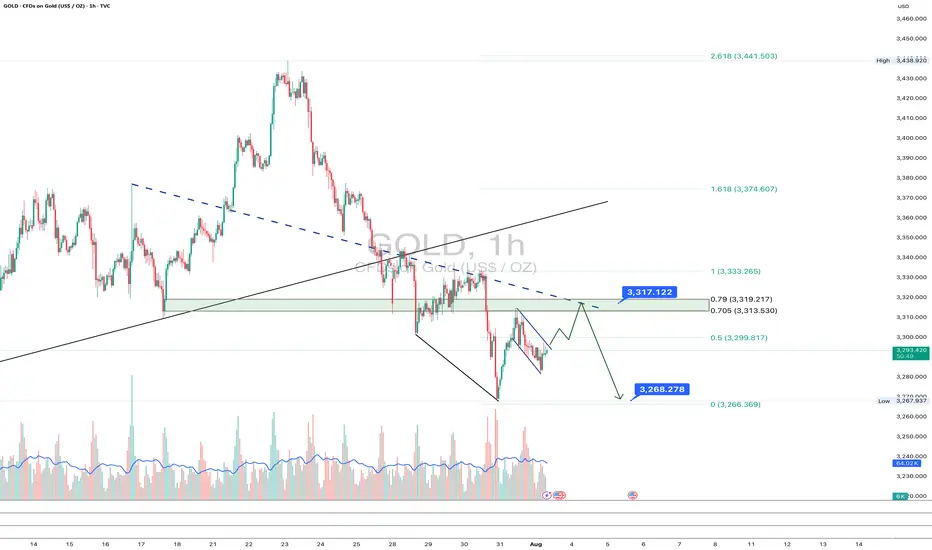
Gold: final pullback or bull trap?On the 1H chart, gold (GOLD) is forming a bullish flag after a sharp decline, which may just be a corrective move within a broader downtrend. The price is now approaching the key resistance zone around $3313–$3317 - this area holds the POC, broken trendline, and the 0.705–0.79 Fibonacci retracement from the last drop. This is the decision-making zone.
If bulls fail to push above it, we expect a move down toward $3268 - the next strong support and potential buy zone, also confirmed by Fibonacci and local demand. Stochastic divergence and slowing volume suggest a possible rebound from that level. However, if the price breaks and holds above $3317, this would indicate a local trend reversal, with targets at $3333 and $3374.
Watch the $3317 zone closely - bulls have yet to prove this is more than just a bounce.
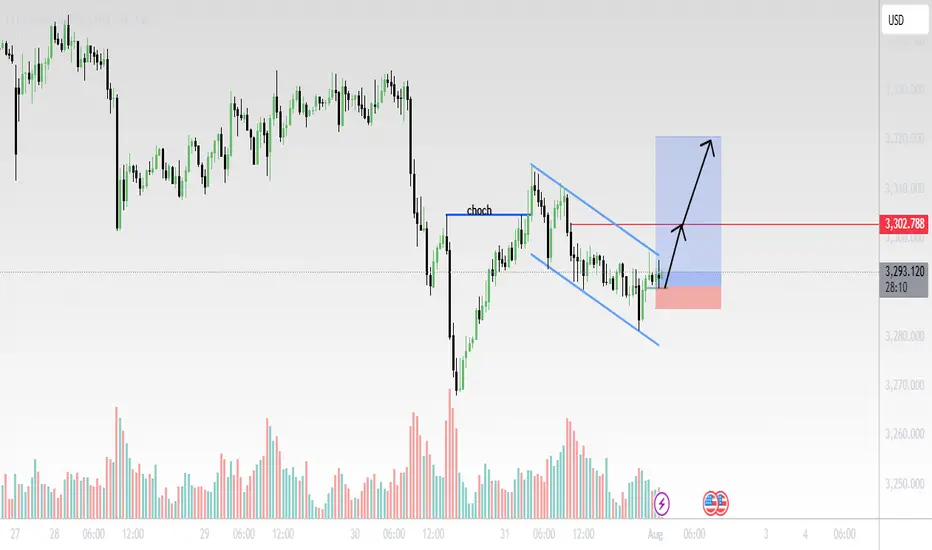
Gold (XAU/USD) 30-Min Chart Analysis – August 1, 2025Structure Summary:
CHoCH (Change of Character) confirmed after price broke the previous lower high, signaling a potential trend reversal.
Price has since formed a bullish falling wedge (blue trendlines), a classic continuation pattern after CHoCH.
Volume spikes during reversal attempts suggest accumulation.
Trade Setup:
Entry: Breakout above wedge resistance.
Stop Loss: Below recent swing low near 3280 area (red zone).
Target: Around 3315–3320 zone (blue box), aligned with previous demand-turned-supply area.
📌 Outlook:
Bullish breakout expected if momentum sustains.
Watch for confirmation candle with volume above the wedge.
Clean R:R setup with tight SL and wide TP potential.
📊 Technical Bias: Bullish
❗Risk Management: Adjust position size based on lot exposure and account size.
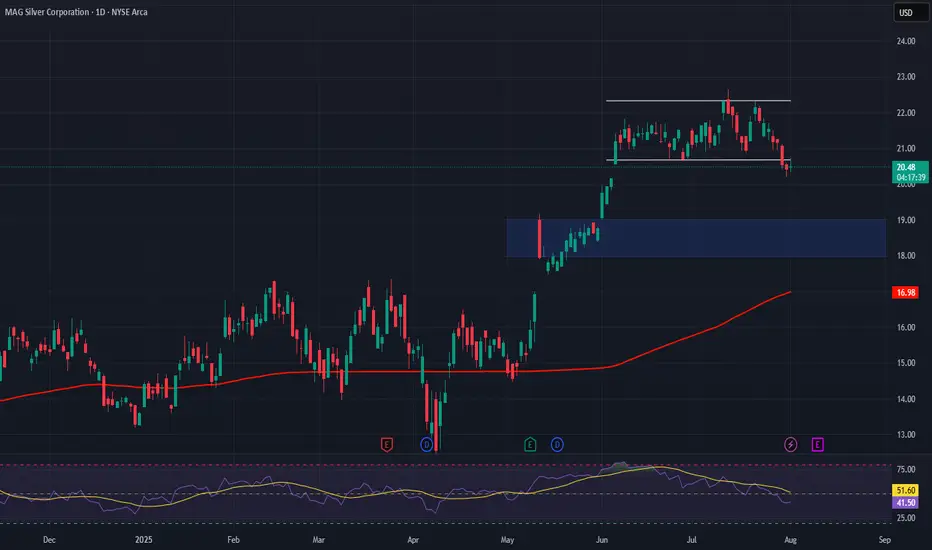
MAG Silver – A Pure-Play Winner in the Precious Metals RallyCompany Snapshot:
AMEX:MAG Silver is uniquely positioned as a high-beta play on silver and gold, with nearly all revenue tied to precious metals exposure—making it a standout in the current macro-driven metals bull run.
Key Catalysts:
High Leverage to Silver 🌐
With almost all income derived from silver and gold sales, MAG offers direct upside as investors flock to safe-haven assets amid inflation, rate uncertainty, and geopolitical risk.
Juanicipio Growth Engine ⛏️
Operated by top-tier partner Fresnillo, the Juanicipio project continues to scale efficiently, tapping into new high-grade zones that will further boost output and margins.
Financial Strength 💰
A debt-light balance sheet and healthy cash reserves give MAG financial flexibility, minimizing dilution risk and providing insulation during volatile market cycles.
Investment Outlook:
Bullish Entry Zone: Above $18.00–$19.00
Upside Target: $28.00–$29.00, driven by silver tailwinds, project scalability, and financial discipline.
🥇 MAG Silver stands out as a low-risk, high-reward name for investors seeking direct exposure to silver’s breakout.
#SilverStocks #Gold #MAGSilver #SafeHaven #PreciousMetals #Juanicipio #Fresnillo #CommodityRally #HardAssets #MiningStocks #InflationHedge #Geopolitics #MetalBulls
Gold price analysis July 31XAUUSD – Bearish pressure still prevails, watch for SELL in the direction of the trend
Yesterday's session witnessed a strong decline when the D1 candle closed with selling pressure up to 60 prices, forming a key candle that shapes the trend. When the market forms a main candle, the 25% and 50% candle body areas are often important price areas to continue trading in the direction of the main trend.
In the current context, the priority strategy will be to sell in the direction of the downtrend when the price rebounds to the resistance areas and there is a rejection signal.
🔹 Important resistance areas:
3301 – 3312 – 3333
🔸 Target support areas:
3285 – 3270 – 3250
🎯 Trading strategy:
Prioritize SELLing at the resistance area of 3301–3312 when there is a price reaction (rejection).
Target: 3250
BUY only considered when 3313 area is broken decisively.
Staying disciplined and sticking to the reaction price zone will be key in the context of the market moving in a clear trend.
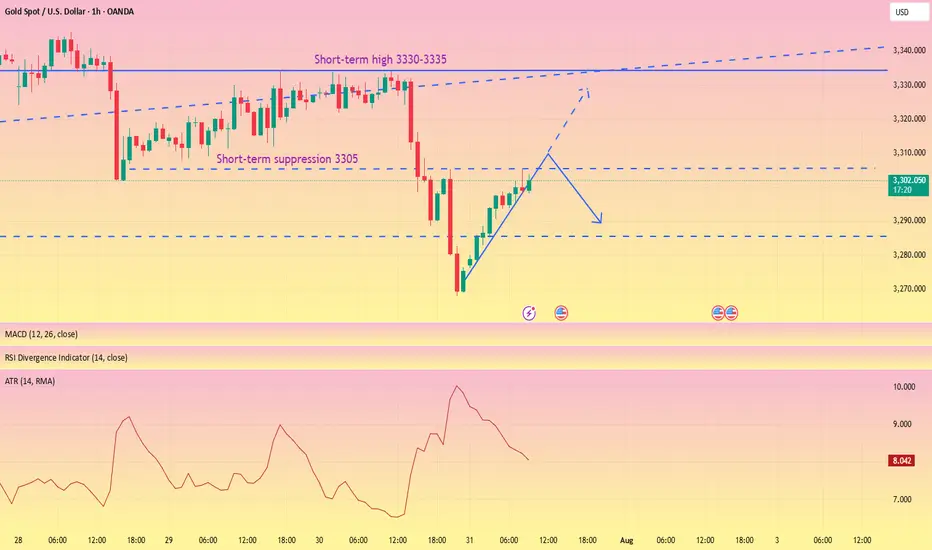
The rebound is weak, short orders intervene#XAUUSD
After two consecutive trading days of volatility, gold finally began to fall under pressure near 3335. After breaking through the 3300 mark, the price of gold accelerated its decline, reaching a low of around 3268, and yesterday's daily line closed with a large negative line. 📊
Today's rebound is more likely to be based on the buffering performance of the impact of news. The ATR data also shows that the bullish momentum is slowly weakening in the short term. 🐻After digesting the impact of yesterday's news through rebound during the day, it may fall again in the future.📉
📎The primary focus today is 3305 above, which was also the high point of yesterday's pullback correction. If the gold price rebounds to 3305-3320 and encounters resistance and pressure,📉 you can consider shorting and look towards 3290-3270.🎯
If the short-term gold rebound momentum is strong and breaks through the 3305-3320 resistance area, it will be necessary to stop loss in time. Gold may be expected to touch yesterday's high resistance of 3330-3335, which is the second point to consider shorting during the day.💡
🚀 SELL 3305-3320
🚀 TP 3290-3270
XAUUSD Gold Trading Strategy August 1, 2025
Yesterday's trading session, gold prices recovered to the 3315 area and then continued to decrease to the 3281 area. Currently, gold prices are fluctuating quite unpredictably due to the impact of tariff news and investor confidence.
Basic news: The Federal Reserve FED continues to maintain the federal funds benchmark interest rate in the range of 4.25% - 4.50%, in line with policy since 2025. Chairman Powell did not give any signal about the next interest rate cut on September 16 - 17.
Technical analysis: After falling sharply to the 3269 area, gold prices are showing signs of recovery. In the current downtrend channel, there has been a higher bottom than the bottom at H1. We can see that if the bullish pattern at H1 is confirmed, combined with the reversal candlestick appearing at H4, the possibility of gold bouncing back to reach the resistance area of 3330, even 3350 is completely possible. In the weekend trading session, we will wait at the support zones to trade.
Important price zones today: 3280 - 3285 and 3269 - 3274.
Today's trading trend: BUY.
Recommended orders:
Plan 1: BUY XAUUSD zone 3283 - 3285
SL 3280
TP 3288 - 3300 - 3310 - 3330.
Plan 2: BUY XAUSD zone 3269 - 3271
SL 3266
TP 3274 - 3284 - 3300 - 3320.
Wish you a safe, favorable and profitable trading day.🥰🥰🥰🥰🥰

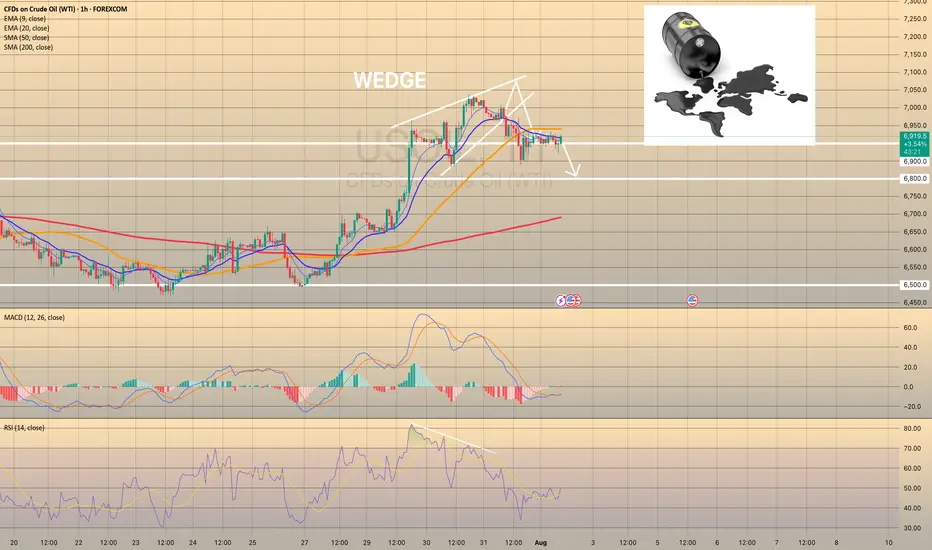
USOIL REACHED THE 6,900.00 SUPPORT LEVEL. WHAT'S NEXT?USOIL REACHED THE 6,900.00 SUPPORT LEVEL. WHAT'S NEXT?
As we told July 31, the price got reversed towards first support level of 6,900.00. Market participants are waiting for the OPEC+ meeting this week, expecting a significant output hike. Currently, the price sits slightly above the support level. Although, the asset trades above this level, considering the current weakness of the asset, further decline is expected. The 6,800.00 support level is the next target here.
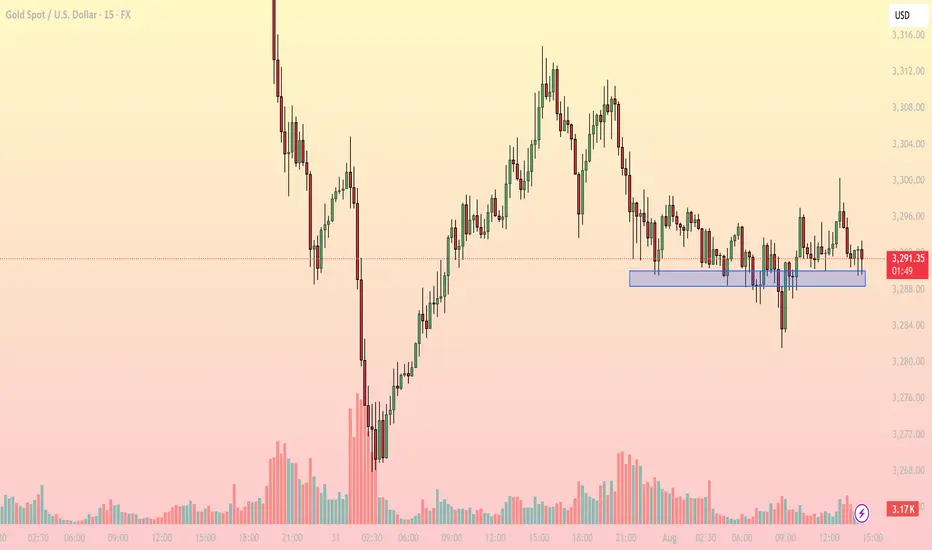
Gold consolidates near key support – What's next for?1. Market Overview
On the 15-minute chart, XAUUSD is trading around 3,290–3,292 USD, hovering just above a critical intraday support zone at 3,287–3,289 USD (highlighted in blue). This area has repeatedly provided a bounce in recent sessions, indicating persistent buying interest.
The current price action reflects sideways movement within a narrow range (3,287–3,296 USD), and notably, declining volatility, as shown by reduced candle range and trading volume.
2. Technical Breakdown
EMA: Price is moving around the EMA20 and EMA50, reflecting indecision and lack of directional momentum.
RSI (inferred): Likely hovering near the neutral 50–55 zone, confirming a balanced market.
Trendline: A descending series of lower highs from the 3,312 peak suggests bearish pressure, though buyers still defend key support.
Fibonacci: The 3,287 USD zone aligns with the 61.8% Fibonacci retracement level, reinforcing its strength as a bounce area.
3. Key Levels to Watch
3,287–3,289: Support - Repeated reactions here – key demand zone
3,296: Immediate resistance - Needs breakout to confirm bullish move
3,302: Next resistance - Breakout target – short-term top
3,275: Deeper support - Retest level if support breaks
4. Trading Strategy Scenarios
🔹 Scenario 1 – Long setup at support
Entry: 3,287–3,289 (wait for bullish reaction like pin bar or engulfing)
Stop Loss: Below 3,284
TP1: 3,296 | TP2: 3,302
🔹 Scenario 2 – Short setup on breakdown
Entry: Below 3,284 (after clear bearish candle close)
Stop Loss: 3,288
TP1: 3,275 | TP2: 3,268
5. Conclusion
Gold is in a tug-of-war at a sensitive support zone. Whether bulls defend or bears break below will set the tone for the rest of the session. Focus on price reaction around 3,287 to determine direction – avoid blind predictions.
Make sure to follow for more live strategies as the New York session unfolds – and save this post if you find it helpful!
What’s your view on this support zone? Let’s discuss below!
Natural Gas Bullish Reversal...Are the Lows in?U.S. natural gas inventories increased by 48 billion cubic feet last week to 3,123 Bcf, increasing the surplus over the five-year average.
Consensus / forecast was 37Billion Cubic feet.
Despite a much higher build than expected Nat gas saw positive price action.
This appears to simply be a dead cat bounce before we go lower.
A death cross on the daily chart has occurred. This signal often results in a small bounce before going lower.

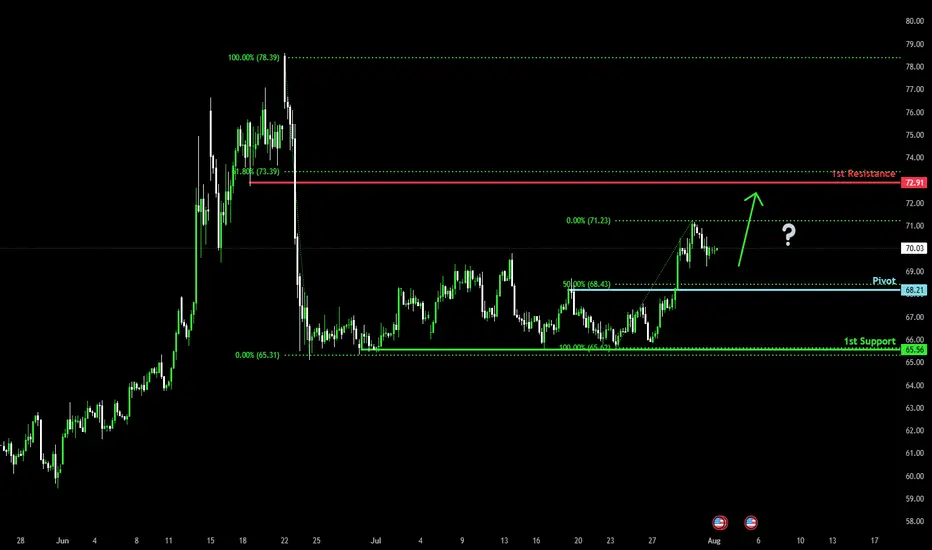
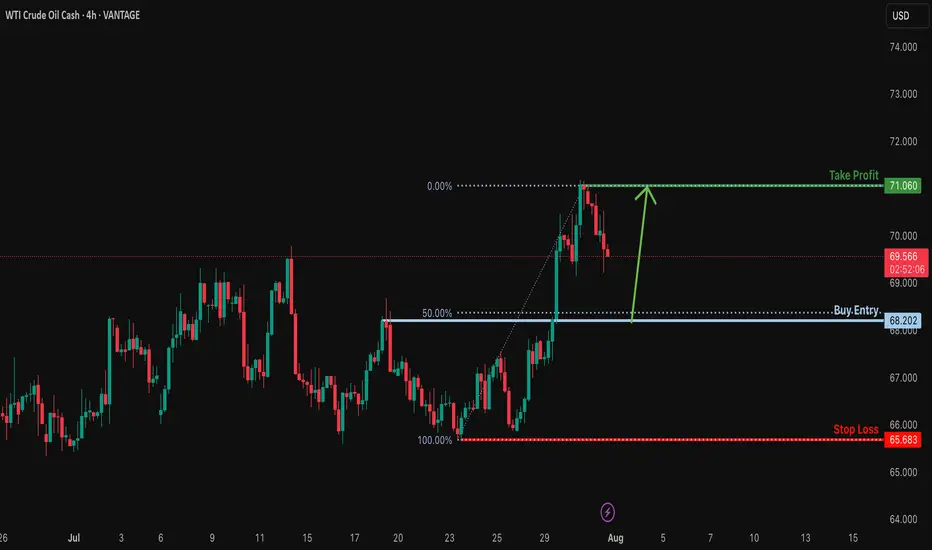
Bullish bounce off 50% Fibonacci support?USOUSD is falling towards the support levle which is a pullback support that aligns with the 50% Fibonacci retracement and could bounce from this level to our take profit.
Entry: 68.20
Why we like it:
There is a pullback support that lines up with the 50% Fibonacci retracement.
Stop loss: 65.68
Why we like it:
There is a multi swing low support.
Take profit: 71.06
Why we like it:
There is a swing high resistance.
Enjoying your TradingView experience? Review us!
Please be advised that the information presented on TradingView is provided to Vantage (‘Vantage Global Limited’, ‘we’) by a third-party provider (‘Everest Fortune Group’). Please be reminded that you are solely responsible for the trading decisions on your account. There is a very high degree of risk involved in trading. Any information and/or content is intended entirely for research, educational and informational purposes only and does not constitute investment or consultation advice or investment strategy. The information is not tailored to the investment needs of any specific person and therefore does not involve a consideration of any of the investment objectives, financial situation or needs of any viewer that may receive it. Kindly also note that past performance is not a reliable indicator of future results. Actual results may differ materially from those anticipated in forward-looking or past performance statements. We assume no liability as to the accuracy or completeness of any of the information and/or content provided herein and the Company cannot be held responsible for any omission, mistake nor for any loss or damage including without limitation to any loss of profit which may arise from reliance on any information supplied by Everest Fortune Group.
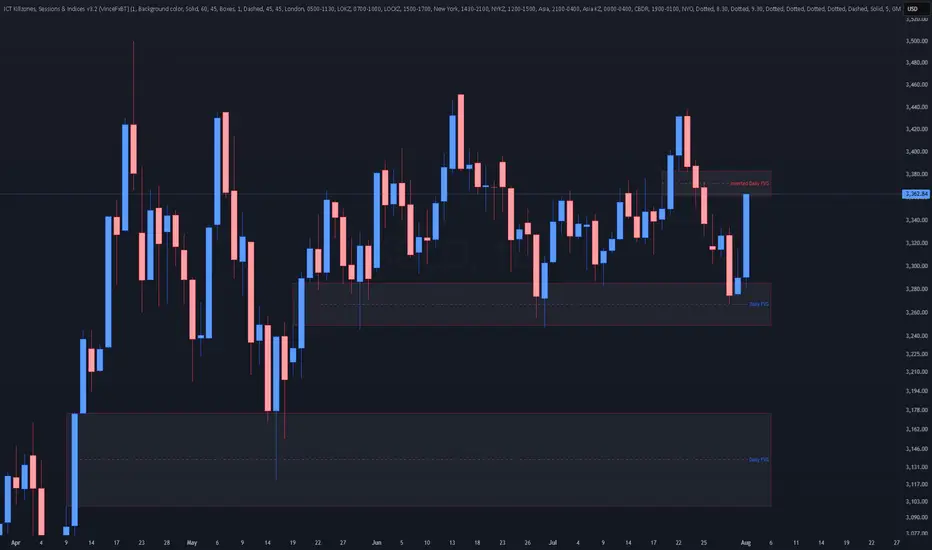
XAUUSD - Daily | More Consolidation??Gold is back in the upper range of this consolidation zone. You can see the high of the range is 3430, and the low is 3240 roughly.
Bulls:
Gold is pulling back into an Inverted FVG. If the price is bullish, then we should clear the gap with ease. Gold has just eliminated 4 days' worth of choppy bearish price action. Look for gold to give clear signs to enter a buy.
**A new daily candle should appear, creating a new FVG showing buyers are winning
Bears:
So with that said... If Gold fails to remain bullish after Friday's (Aug 1st) 700-pip jump, then the iFVG may have the price react bearishly. Watch for gold to give a clear sign of rejection before entering a sell
**Price may drop to cover Friday's gap. Doesn't mean it's bearish
SILVER: The Market Is Looking Down! Short!
My dear friends,
Today we will analyse SILVER together☺️
The market is at an inflection zone and price has now reached an area around 37.036 where previous reversals or breakouts have occurred.And a price reaction that we are seeing on multiple timeframes here could signal the next move down so we can enter on confirmation, and target the next key level of 36.788..Stop-loss is recommended beyond the inflection zone.
❤️Sending you lots of Love and Hugs❤️

GOLD: Bulls Are Winning! Long!
My dear friends,
Today we will analyse GOLD together☺️
The recent price action suggests a shift in mid-term momentum. A break above the current local range around 3,363.50 will confirm the new direction upwards with the target being the next key level of 3,383.45 and a reconvened placement of a stop-loss beyond the range.
❤️Sending you lots of Love and Hugs❤️
USOIL Technical Analysis! BUY!
My dear followers,
I analysed this chart on USOIL and concluded the following:
The market is trading on 67.25 pivot level.
Bias - Bullish
Technical Indicators: Both Super Trend & Pivot HL indicate a highly probable Bullish continuation.
Target - 68.74
About Used Indicators:
A super-trend indicator is plotted on either above or below the closing price to signal a buy or sell. The indicator changes color, based on whether or not you should be buying. If the super-trend indicator moves below the closing price, the indicator turns green, and it signals an entry point or points to buy.
Disclosure: I am part of Trade Nation's Influencer program and receive a monthly fee for using their TradingView charts in my analysis.
———————————
WISH YOU ALL LUCK
