Gold 30Min Engaged ( Bullish Reversal Entry Detected )Time Frame: 30-Minute Warfare
Entry Protocol: Only after volume-verified breakout
🩸Bullish Reversal 3329 Zone
➗ Hanzo Protocol: Volume-Tiered Entry Authority
➕ Zone Activated: Dynamic market pressure detected.
The level isn’t just price — it’s a memory of where they moved size.
Volume is rising beneath the surface — not noise, but preparation.
🔥 Tactical Note:
We wait for the energy signature — when volume betrays intention.
The trap gets set. The weak follow. We execute.
☄️Gold 30Min Engaged ( Bearish Reversal Entry Detected )
Commodities

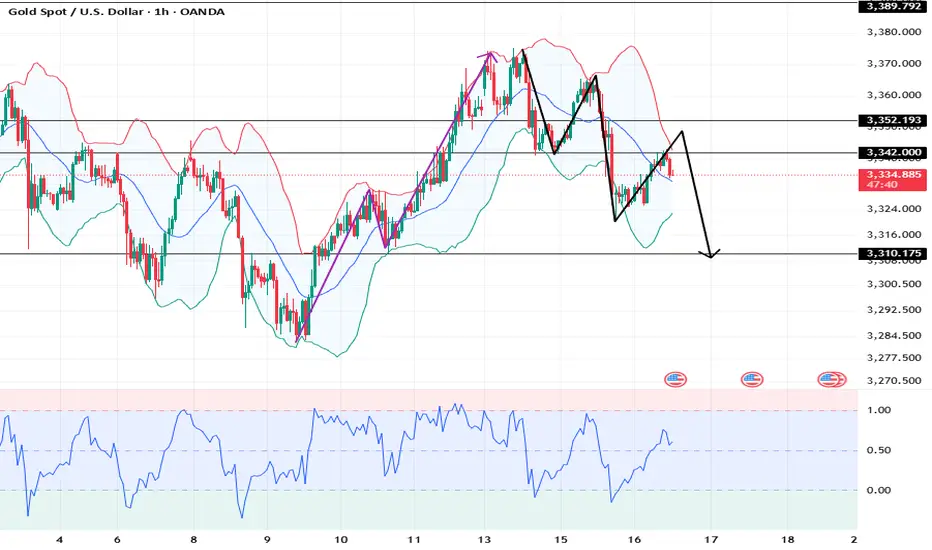
XAUUSD: Market analysis and strategy for July 16.Gold technical analysis
Daily chart resistance level 3382, support level 3300
Four-hour chart resistance level 3365, support level 3320
One-hour chart resistance level 3342, support level 3325.
Yesterday, the lowest price fell to 3320, then fluctuated upward, and rebounded to 3343. As the price fell below 3341 yesterday and accelerated downward, a transition from support to resistance was formed here. Focus on the high point of the NY market rebound yesterday, 3352. Whether it can break through here will determine whether the market continues to rise or is blocked and then falls back like yesterday.
It is worth noting that the trend of the past two days is that Asia is rising and rebounding, and the NY market is falling. Today may be a cycle of yesterday and the day before yesterday. At present, gold is fluctuating and rebounding at 3320. If the NY market cannot break through 3352, it will continue to fall. For the time being, it can be sold high and bought low in this range. After falling below 3320, the next short-term target is 3310~3300.
BUY: 3324 SL: 3320
SELL: 3320 SL: 3325
SELL: 3352 SL: 3357
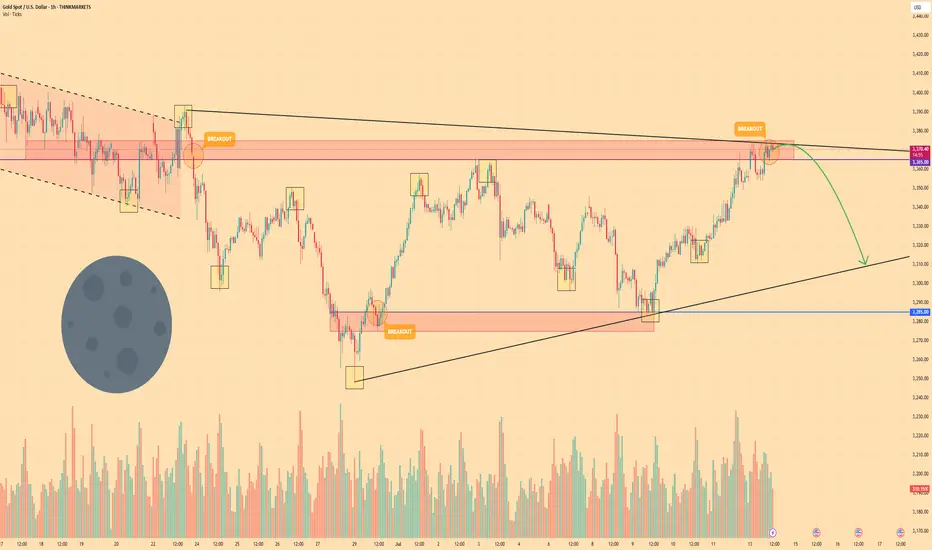
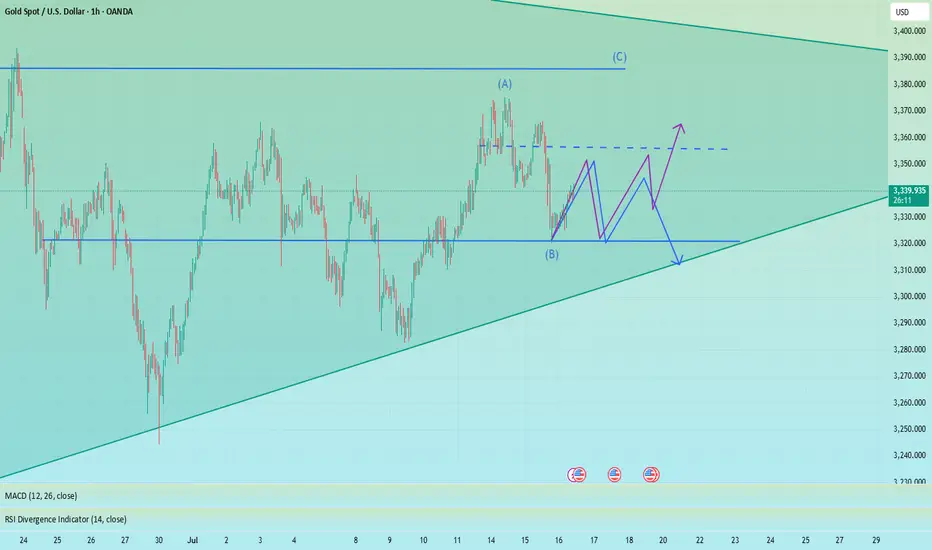
GOLD - Price can start to decline and break support levelHi guys, this is my overview for EURUSD, feel free to check it and write your feedback in comments👊
Gold initially traded inside a steady falling channel, carving lower highs at $3390 and lower lows around $3285 as bears held sway.
A brief fake breakout at $3365 briefly flipped sentiment, but sellers quickly reasserted control and pushed price back toward the channel floor.
Buyers then absorbed selling at the $3285 support area, sparking a rebound into a rising wedge pattern marked by converging trendlines.
Within this wedge, three minor breakouts failed to trigger sustained rallies, underscoring persistent resistance near the upper boundary.
I anticipate Gold to roll over from the wedge’s ceiling and break below $3365, targeting the wedge’s lower support line at $3310
If this post is useful to you, you can support me with like/boost and advice in comments❤️
Disclaimer: As part of ThinkMarkets’ Influencer Program, I am sponsored to share and publish their charts in my analysis.
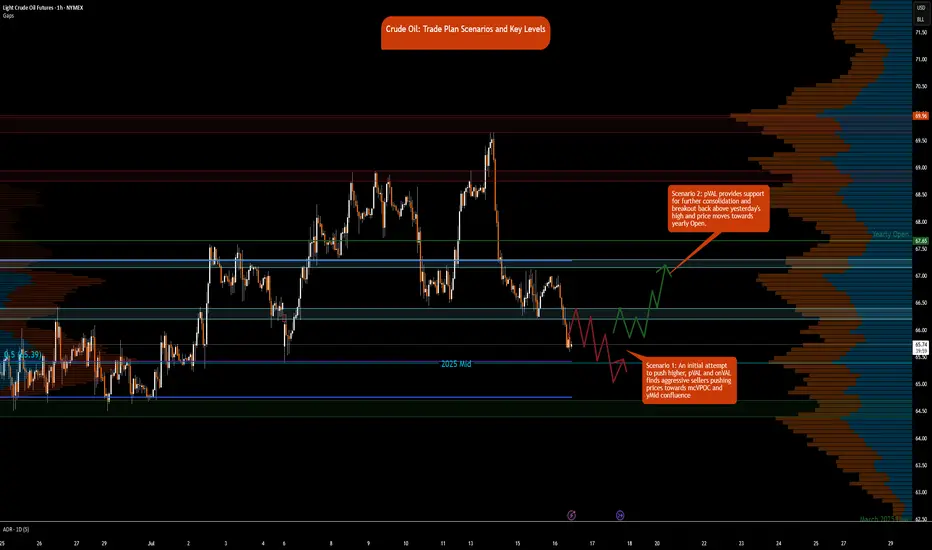
Crude Oil Trade Plan Scenarios and Key Levels
NYMEX:CL1!
It’s Wednesday today, and the DOE release is scheduled for 9:30 a.m. CT. This may provide fuel—pun intended—to push prices out of the two-day consolidation. Also, note that the August contract expires on July 22, 2025. Rollover to the September contract is expected on Thursday/Friday. You can see the pace of the roll here at CME’s pace of roll tool . The chart shows that rollover is about 70% complete, and CLU25 has higher open interest. Note, the front-month August contract is still trading at higher volume.
What has the market done?
Crude oil is in a multi-distribution profile since the peak witnessed during the Iran-Israel conflict. Crude oil formed a strong base above the 64s and traversed towards the 69s. Prices were rejected at these highs and have since reverted back towards the monthly Volume Point of Control, monthlyVPOC.
What is it trying to do?
The market is in active price discovery mode and has formed multi-distributions since June 23. The market has been consolidating after prices at highs were rejected.
How good of a job is it doing?
The market is active and is also providing setups against key levels. Patience to take trades from these higher time frame levels is what is required to trade crude oil currently. Otherwise, there is a lot of volatility and chop that can throw traders off their plan.
Key Levels:
• Yearly Open: 67.65
• Neutral zone: 67.15–67.30
• 2-Day VAL (Value Area Low): 66.40
• Neutral zone: 66.40–66.20
• 2025 Mid-Range: 65.39
• Key Support: 64.40–64.70
What is more likely to happen from here?
Scenario 1: An initial attempt to push higher, pVAL and onVAL finds aggressive sellers pushing prices towards mcVPOC and yMid confluence
Scenario 2: pVAL provides support for further consolidation and break back above yesterday's high and price moves towards yearly Open.
Glossary:
pVAL: Prior Value Area Low
onVAL: Overnight Value Area Low
yMid: 2025 Mid-Range
mcVPOC: Micro Composite Volume Point of Control
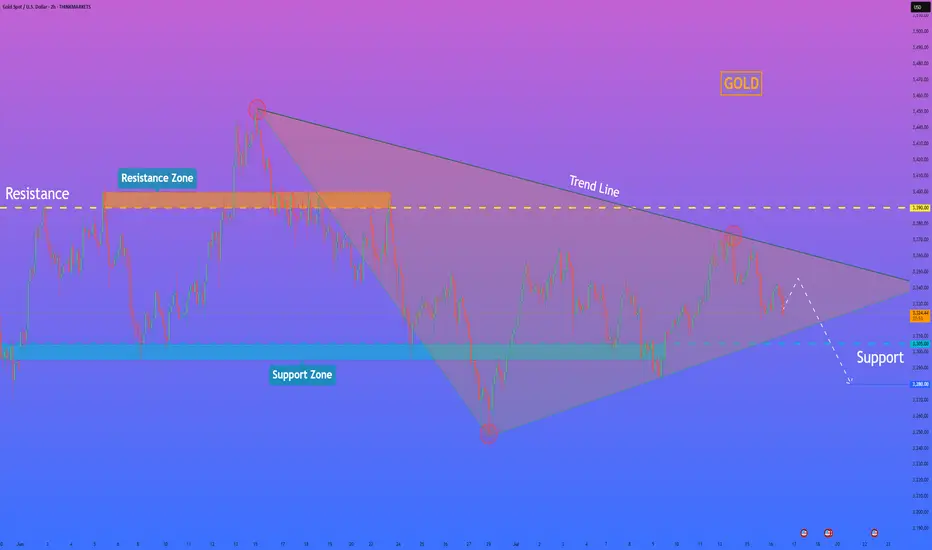
HelenP I. Gold will continue to decline and break support levelHi folks today I'm prepared for you Gold analytics. After a prolonged period of consolidation, we can observe how price has formed a symmetrical pennant pattern. Price respected both the descending and ascending trend lines, bouncing several times from each side. Recently, gold tested the upper boundary of the pennant near the 3390 resistance level but failed to break through, confirming the strength of the resistance zone between 3390 and 3400 points. Following this rejection, the price started to decline and is now approaching the support level around 3305. If this support doesn’t hold, the price may drop further and break out of the pennant downward. In that case, the nearest significant target lies at 3280 points — near the lower trend line and previous reaction zones. Given the current structure, repeated rejection from resistance, and narrowing volatility inside the pattern, I expect XAUUSD to exit from the pennant and move down, breaking the support zone. That’s why I remain short-term bearish and set my goal at 3280 points. If you like my analytics you may support me with your like/comment.❤️
Disclaimer: As part of ThinkMarkets’ Influencer Program, I am sponsored to share and publish their charts in my analysis.
CL BULLISHHello,
I just noticed that oil has a good chance of rising, with a slight short-term uptrend, and I hope this helps you with your trading.
See you soon.

GOLD FULL UPDATE – July 15, 2025 | Post-CPI TrapPost-CPI Flip Zone Battle
Hello dear traders 💛
Today has been one of those heavy CPI days — full of volatility, sweeps, and doubt. But if we read it structurally and stop chasing candles, everything makes sense. Let’s break it all down step by step, clearly and human-like.
Current Price: 3330
Bias: Short-term bearish, reactive bounce underway
Focus Zone: 3319–3320 liquidity sweep + key decision structure unfolding
🔹 Macro Context:
CPI came in slightly hot year-over-year (2.7% vs 2.6%) while monthly stayed in-line at 0.3%. That gave the dollar a short-lived boost, and gold reacted exactly how institutions love to play it — sweeping liquidity under 3320, then pausing. Not falling, not flying. Just... thinking.
That reaction matters. Why? Because it shows us indecision. It tells us that gold isn’t ready to break down fully yet, and every aggressive move today was part of a calculated shakeout.
🔹 Daily Structure:
Gold is still stuck below the premium supply zone of 3356–3380. Every attempt to rally there for the past few weeks has failed — including today.
The discount demand area between 3280–3240 is still intact and untouched. So what does this mean?
We are in a macro-range, and price is simply rotating between key structural edges.
🔹 H4 View:
The rejection from CPI at 3355–3365 created a micro CHoCH, signaling the bullish leg is now broken.
After the 3345 fail, price dropped to 3320 — but it hasn’t tapped the full H4 demand at 3310–3300.
H4 EMAs are tilting down, showing pressure. This isn’t a breakout. It’s a correction inside a larger range.
🔸 Key H4 Supply Zones:
3345–3355: liquidity reaction during CPI
3365–3375: untested OB + remaining buy-side liquidity
🔸 Key H4 Demand Zones:
3310–3300: mitigation zone from the CHoCH
3282–3270: deep discount and bullish continuation zone if current fails
Structure-wise: We are in a correction, not a clean uptrend. That’s why every bullish attempt fails unless confirmed.
🔹 H1 Real Structure
This is where things got tricky today.
Price formed a bullish BOS back on July 14, when we first pushed into 3370. That was the start of the bullish leg.
But today, we revisited the origin of that BOS, right near 3320. This is a sensitive zone.
If it holds → it’s still a retracement.
If it breaks → we lose the bullish structure and shift full bearish.
So far, price touched 3320, bounced weakly, but has not printed a bullish BOS again.
🔸 H1 Zones of Interest:
Supply above:
3340–3345: micro reaction zone
3355–3365: CPI origin rejection
3370–3375: final inducement
Demand below:
3310–3300: current flip test
3282–3270: if this breaks, bias flips bearish
Right now, we are between zones. Price is undecided. RSI is oversold, yes — but that alone is never a reason to buy. We need structure. We need BOS.
🔻 So… What’s the Truth Right Now?
✅ If 3310–3300 holds and price builds BOS on M15 → a clean long opportunity develops
❌ If 3310 breaks, and we lose 3300, structure fully shifts and opens downside to 3280–3270
On the upside:
Only look for rejections from 3355–3365 and 3370–3375
Anything inside 3325–3340 is noise. No structure, no clean RR.
Final Thoughts:
Today’s move was not random. It was a classic CPI trap: induce longs early, trap shorts late, and leave everyone confused in the middle.
But we don’t trade confusion — we wait for structure to align with the zone.
If M15 or H1 prints a BOS from demand, that’s your green light.
If price collapses under 3300, flip your bias. The chart already told you it wants lower.
No predictions. Just real reaction.
—
📣 If you like clear and simple plans, please like, comment, and follow.
Stay focused. Structure always wins.
📢 Disclosure: This analysis was created using TradingView charts through my Trade Nation broker integration. As part of Trade Nation’s partner program, I may receive compensation for educational content shared using their tools.
— With clarity,
GoldFxMinds

Pay attention to 3320, if it falls below, go long at 3310-3300The short order has been completed and profit has been realized. Now the 1H technical indicators show that there is still room for decline in the short term. Focus on the 3320 support. If it falls below 3320, the gold price is expected to reach the 3310-3300 area, which is also an ideal trading area for intraday long positions. There is nothing much to say. Follow the wolves and you will get meat. Currently, the brothers who follow me to trade have all made good gains.
OANDA:XAUUSD
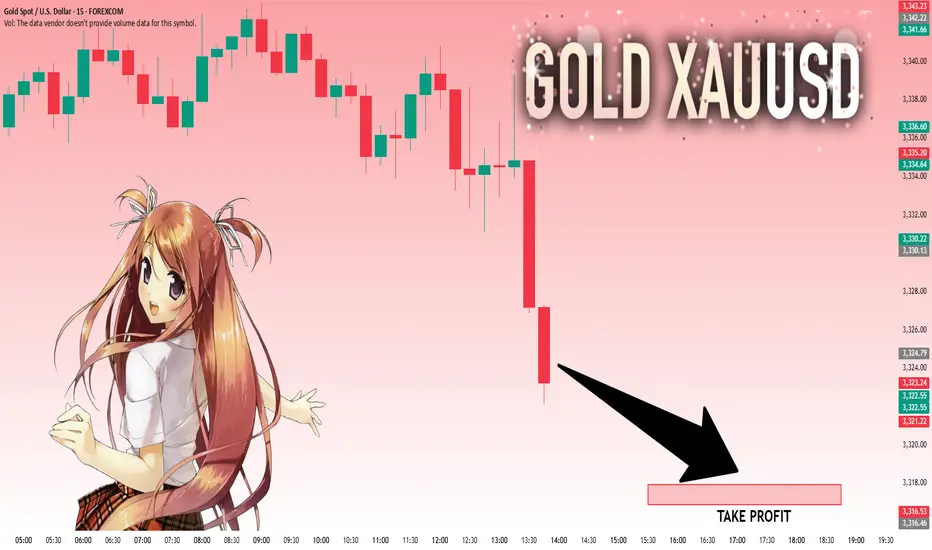
GOLD: Absolute Price Collapse Ahead! Short!
My dear friends,
Today we will analyse GOLD together☺️
The price is near a wide key level
and the pair is approaching a significant decision level of 3.324.79 Therefore, a strong bearish reaction here could determine the next move down.We will watch for a confirmation candle, and then target the next key level of 3,317.96..Recommend Stop-loss is beyond the current level.
❤️Sending you lots of Love and Hugs❤️
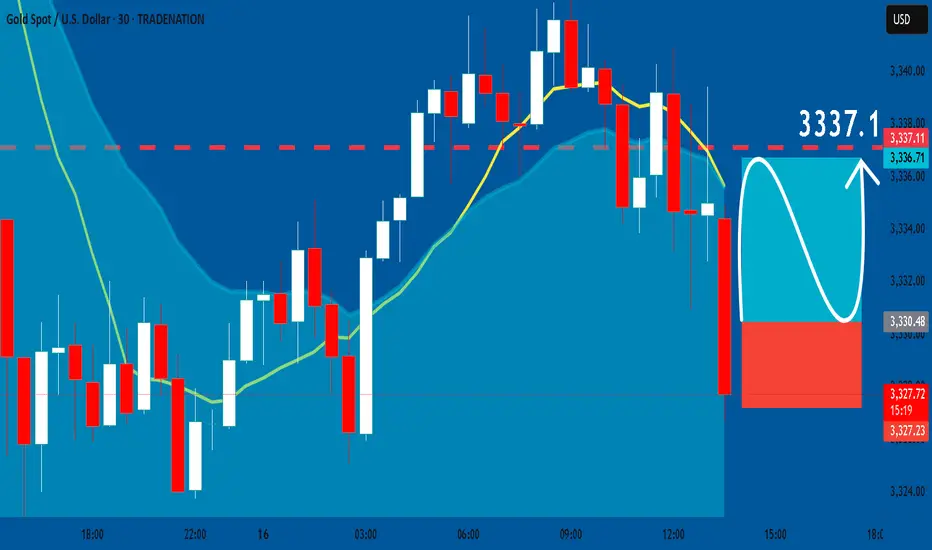
GOLD: Long Trading Opportunity
GOLD
- Classic bullish formation
- Our team expects growth
SUGGESTED TRADE:
Swing Trade
Buy GOLD
Entry Level - 3330.3
Sl - 3327.23
Tp - 3337.1
Our Risk - 1%
Start protection of your profits from lower levels
Disclosure: I am part of Trade Nation's Influencer program and receive a monthly fee for using their TradingView charts in my analysis.
❤️ Please, support our work with like & comment! ❤️
The rebound is not a reversal, continue to shortGold showed a trend of rising and falling back and closing low on Tuesday. The highest intraday rise was 3366, and the lowest fell to 3320. The daily line recorded a medium-sized Yin line with a long upper shadow. The K-line was negative, and the closing line broke the resonance support of the middle track and the short-term moving average, suggesting that the bullish momentum has slowed down and the bears are ready to move. Today, we need to pay attention to the further downward performance of gold. From the 4H level, the price stood firm at the four-hour resistance position last Thursday, and then rebounded upward in the short term. Yesterday, the price fell below the daily support level. Currently, the short-term market is bearish, and attention is paid to the resistance in the 3340-3345 range above. In the one-hour period, the price is in short-term shock adjustment. On the whole, it will be treated as a shock decline before breaking yesterday's low, and the lower side pays attention to the 3225-3320 area support. In the short term, you can consider shorting at 3340-3350 in the European session, and look towards 3330-3320
OANDA:XAUUSD
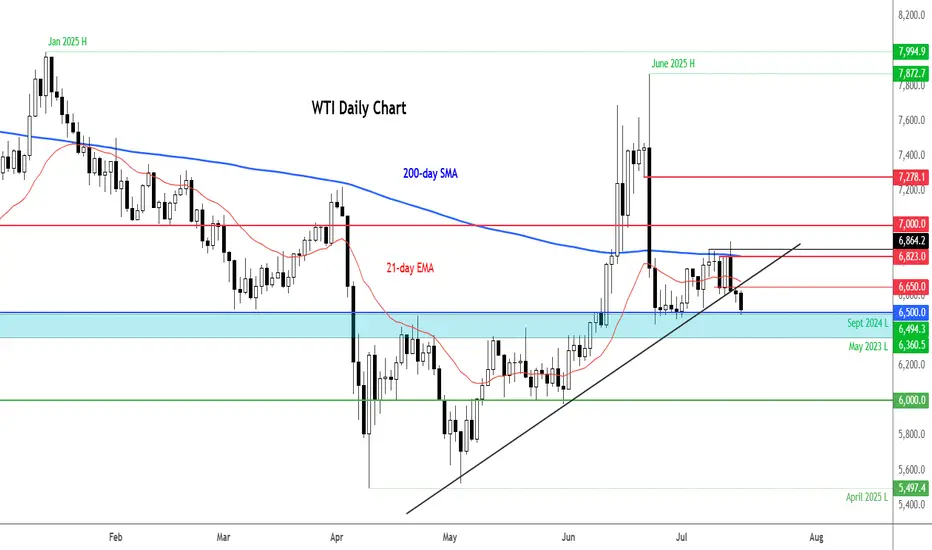
Crude oil extends fallsThe crude oil market has entered a fragile and uncertain phase, with prices retreating from recent highs. While WTI crude is still holding above the critical $65 mark on a closing basis, it was below this handle at the time of writing. So, the overall tone remains cautious, with a bearish tilt expected to persist in the near term.
Technical Outlook: WTI Breaks Key Support
The WTI crude chart shows a breakdown of a short-term bullish trend line, and lower lows. The price failed to reclaim the 200-day moving average and found strong resistance since. Currently, it is testing support around $65.00. A daily close below this level could trigger further bearish momentum, with the next support zones seen at $64, and then the next round handles below that. $60 per barrel could be reached if the macro backdrop doesn't improve.
Geopolitical Factors: Trump’s Tariff Threats Dismissed
Donald Trump’s threats of 100% tariffs on countries buying Russian oil sparked initial concern but were ultimately shrugged off by the market. Traders interpreted the 50-day delay in enforcement and Trump’s historical pattern of backing off such threats as signs that immediate supply disruptions were unlikely.
OPEC+ Strategy: Supply Returning to the Market
OPEC+ has announced a larger-than-expected production increase of 548,000 bpd for August, with another 550,000 bpd potentially coming in September. This roll-back of earlier voluntary cuts aims to recapture market share, especially as U.S. shale production slows. However, the added supply may cap price gains, particularly as demand is expected to ease after the peak U.S. driving season.
By Fawad Razaqzada, Market Analyst with FOREX.com
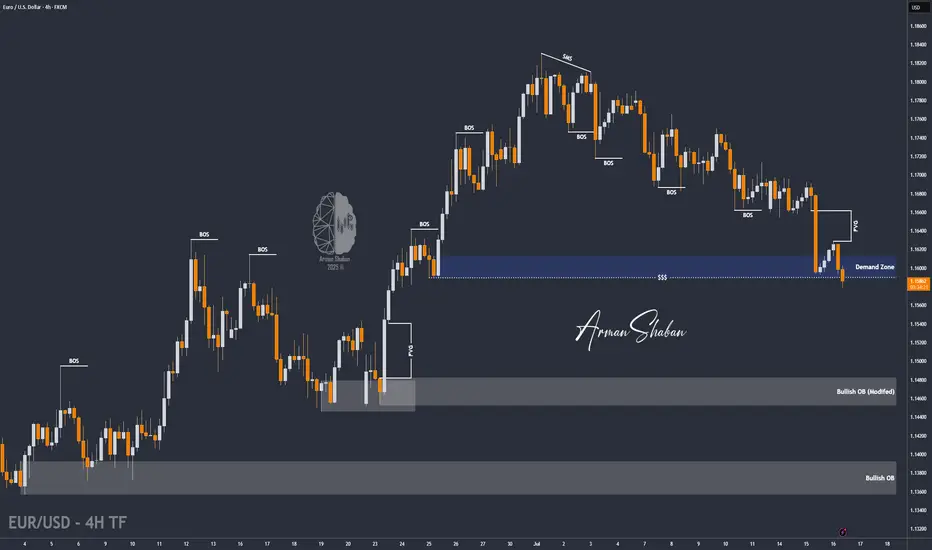
EUR/USD : Another Fall Ahead ? (READ THE CAPTION)By analyzing the EURUSD chart on the 4-hour timeframe, we can see that the price is currently breaking through the 1.16–1.158 zone. If it manages to hold below 1.159, we can expect further downside movement. The next targets for EURUSD are 1.15580, 1.154, and 1.148.
Please support me with your likes and comments to motivate me to share more analysis with you and share your opinion about the possible trend of this chart with me !
Best Regards , Arman Shaban
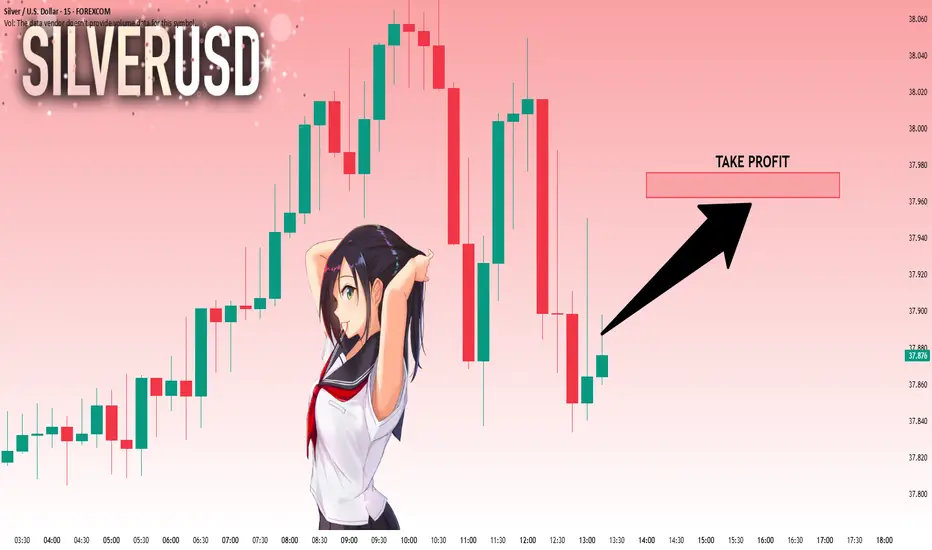
SILVER: Strong Bullish Sentiment! Long!
My dear friends,
Today we will analyse SILVER together☺️
The market is at an inflection zone and price has now reached an area around 37.873 where previous reversals or breakouts have occurred.And a price reaction that we are seeing on multiple timeframes here could signal the next move down so we can enter on confirmation, and target the next key level of 37.962..Stop-loss is recommended beyond the inflection zone.
❤️Sending you lots of Love and Hugs❤️
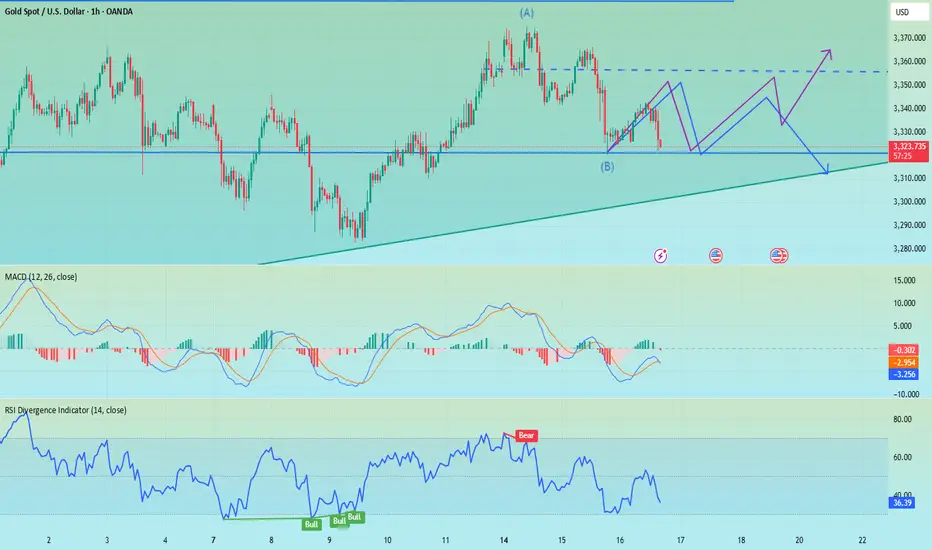
Gold Bullish Momentum
📈 XAU/USD Gold Technical Analysis – Smart Money Concept Perspective
🕒 Timeframe: 1H | Date: July 16, 2025
Overview:
This analysis follows a Smart Money Concept (SMC) framework, focusing on market structure shifts, liquidity zones, and potential high-probability setups. Gold (XAU/USD) is showing signs of a possible bullish reversal after forming a clear accumulation zone near a significant low.
Key Highlights:
🔹 BOS (Break of Structure):
A bullish break of structure confirms a shift in momentum, indicating that the prior bearish trend might be weakening.
🔹 LL (Lower Low) and LH (Lower High):
The market previously formed a Lower Low, followed by a Lower High, maintaining bearish structure until the recent BOS occurred.
🔹 Accumulation Phase:
Price is consolidating in a defined accumulation range, suggesting smart money might be absorbing liquidity before a move higher. This zone may serve as the springboard for the next bullish leg.
🔹 Inducement:
An inducement zone lies just below the trendline support and accumulation range. It’s designed to trap early sellers before a bullish continuation.
🔹 POI (Point of Interest):
A key supply or mitigation zone lies around the $3,355.75 level. We expect price to move into this POI before reacting.
🔹 Target:
If price successfully clears the POI and confirms strength, the projected target is in the $3,375–$3,380 zone based on confluence from upper channel resistance and previous structure.
🔄 Forecast Path:
Short-Term Pullback: Price may dip slightly to mitigate the inducement zone near trendline support.
Bullish Breakout: Strong impulse toward POI.
Reaction from POI: Potential minor retracement before a continuation toward the target.
🧠 Market Psychology Insight:
This setup reflects smart money accumulation and manipulation at its core — inducing retail traders into short positions before a potential bullish move. Watch for confirmations like bullish engulfing candles or break of lower highs on smaller timeframes.
📌 Conclusion:
Gold is poised for a possible bullish move after showing accumulation and breaking bearish structure. The $3,328–$3,335 range is key for entries, with the $3,355 POI and $3,375+ as targets. Manage risk and wait for confirmation before entering trades.
💬 Let me know your thoughts or drop your own chart ideas below!
📊 #XAUUSD #Gold #SmartMoney #TradingView #Forex #TechnicalAnalysis #SMC #PriceAction

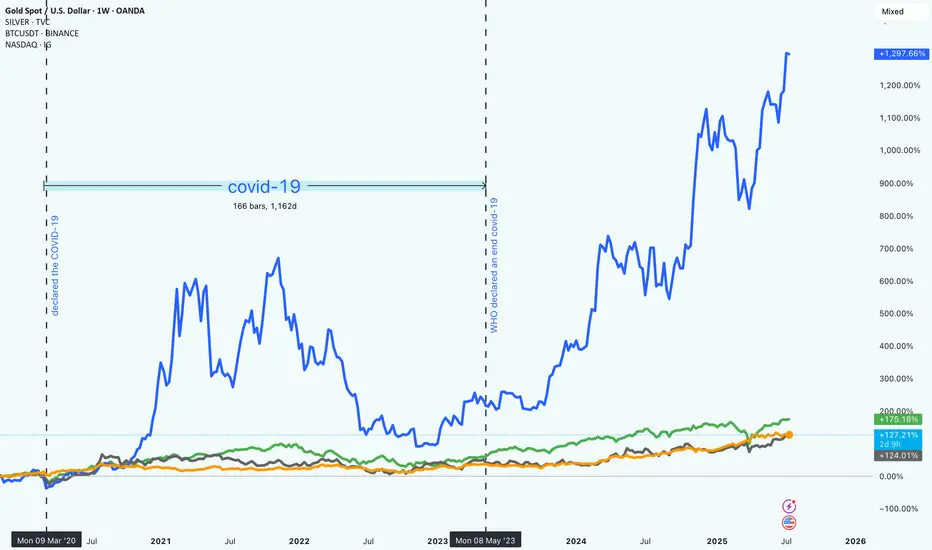
Market Trends from 2020 to 2025How Bitcoin, NASDAQ, Gold, and Silver Really Performed Since 2020
It’s been a wild few years in the markets. From early 2020 to mid-2025, investors have had to navigate uncertainty, changing interest rates, tech booms, and the rise of digital assets. Looking back, it’s clear that some assets took off while others just quietly held their ground.
So, what happened if you had invested in Bitcoin, the NASDAQ, gold, or silver five years ago?
Bitcoin (BTC): +1,297.87%
No surprise here. Bitcoin absolutely stole the show. Despite all the ups and downs (and there were plenty), BTC ended up with nearly 1,300% gains. It had a huge surge in late 2020 and 2021, crashed hard, and then climbed even higher starting in 2023.
This kind of return doesn’t come without risk. Bitcoin was by far the most volatile of the group. But for those who held on, the reward was massive. It also marked a big shift in how people think about money and investing.
"Crypto is no longer just a fringe idea."
NASDAQ: +175.26%
Tech stocks had a strong run, too. The NASDAQ gained around 175%, driven by innovation, digital expansion, and eventually, the AI boom. While there were some bumps along the way (especially when interest rates went up), the general trend was up and to the right.
Unlike Bitcoin, the NASDAQ was more predictable, less explosive.
Gold: +127.39%
Gold did what gold usually does. It held its value and slowly moved higher. Over five years, it returned about 127%, which is pretty solid for a “safe haven” asset. It didn’t grab headlines like crypto or tech stocks, but it stayed reliable through the chaos.
Silver: +124.50%
Silver had a similar story to gold, but with a bit more fluctuation. It benefited from both investor demand and industrial use, and it ended up with just over 124% in gains. Not bad for a metal that often gets overshadowed by its shinier cousin ;).
What It All Means
If you were in Bitcoin, you saw huge gains, but also had to stomach major volatility. Tech investors did well too, especially those who stayed in through the dips. Meanwhile, gold and silver offered steadier, more defensive returns.
One big takeaway: the investment landscape is changing. Traditional assets still matter, but new ones like crypto are reshaping what portfolios can look like.
In the end, it’s about balancing risk and reward!
and figuring out what kind of investor you are.
Bitcoin harmonic pattern. Back to back Gartley. BTCGOLD ratio.The BTC/GOLD ratio has experienced a significant correction, currently standing at 27 gold ounces per 1 Bitcoin, down from a peak of 41, representing a decline of 34%.
Gold, priced at $3,114 in US Federal Reserve notes, is in a sustained bull market.
It is reasonable to anticipate that the digital equivalent of gold will gain traction once gold stabilizes at a higher price point.
The Gartley pattern is recognized as the most prevalent harmonic chart pattern.
Harmonic patterns are based on the idea that Fibonacci sequences can be utilized to create geometric formations, which include price breakouts and retracements.
The Gartley pattern illustrated indicates an upward movement from point X to point A, followed by a price reversal at point A. According to Fibonacci ratios, the retracement from point X to point B is expected to be 61.8%.
At point B, the price reverses again towards point C, which should reflect a retracement of either 38.2% or 88.6% from point A.
From point C, the price then reverses to point D. At point D, the pattern is considered complete, generating buy signals with an upside target that aligns with points C and A, as well as a final price target of a 161.8% increase from point A.
Often, point 0 serves as a stop-loss level for the entire trade. While these Fibonacci levels do not have to be precise, greater proximity enhances the reliability of the pattern.
Will these consecutive Gartley patterns succeed in bolstering Bitcoin's strength? We will soon discover the answer.

Could we see the WTI oil bears getting pleased any time soon?The technical picture of MARKETSCOM:OIL is showing a possible bearish flag formation, which may lead WTI oil to some lower areas. Is that the case? Let's dig in.
NYMEX:CL1!
Let us know what you think in the comments below.
Thank you.
75.2% of retail investor accounts lose money when trading CFDs with this provider. You should consider whether you understand how CFDs work and whether you can afford to take the high risk of losing your money. Past performance is not necessarily indicative of future results. The value of investments may fall as well as rise and the investor may not get back the amount initially invested. This content is not intended for nor applicable to residents of the UK. Cryptocurrency CFDs and spread bets are restricted in the UK for all retail clients.

Gold is getting ready to rise.Gold has been resting too long and the neutral triangle is no longer valid in terms of time and a contracting triangle seems to be forming.
In any case, there is at least one more bullish wave left for gold.
Good luck
NEoWave Chart

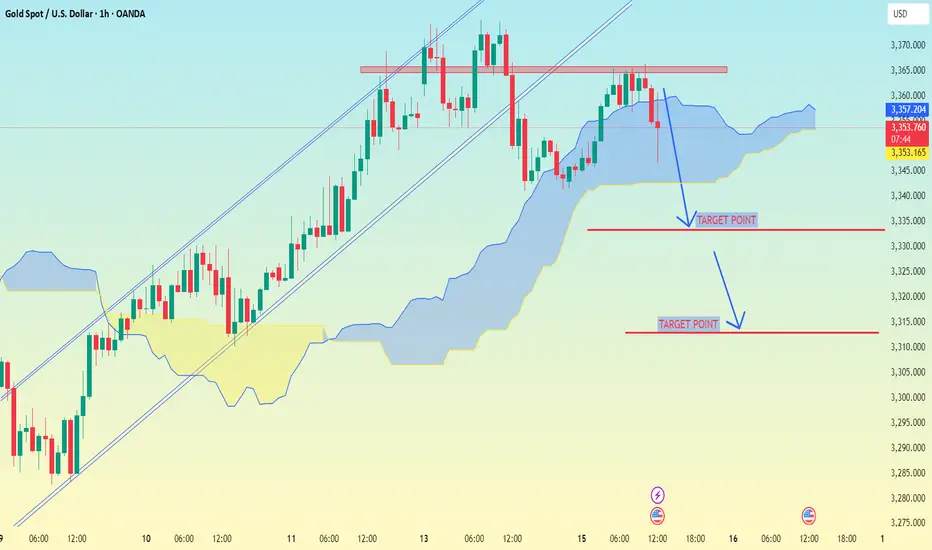
XAU/USD (Gold vs USD) on the 1-hour timeframe..XAU/USD (Gold vs USD) on the 1-hour timeframe, the setup clearly shows a bearish breakdown from an ascending channel, supported by Ichimoku Cloud analysis.
---
📉 Target Points (as marked on your chart):
1. First Target Point: Around $2,335
2. Second Target Point: Around $2,312
---
🔍 Analysis Breakdown:
Price has broken below the Ichimoku cloud – a bearish signal.
The ascending channel is broken to the downside.
Support zones and target levels are clearly marked:
The first target aligns with a previous support level.
The second target is a deeper support area, likely the base of the previous strong rally.
---
📌 Summary:
🥇 First Target: $2,335
🥈 Second Target: $2,312
📉 Bias: Bearish (continuation likely if momentum holds and no strong reversal signs appear)
Let me know if you want suggested stop-loss, entry confirmation ideas, or risk management tips.
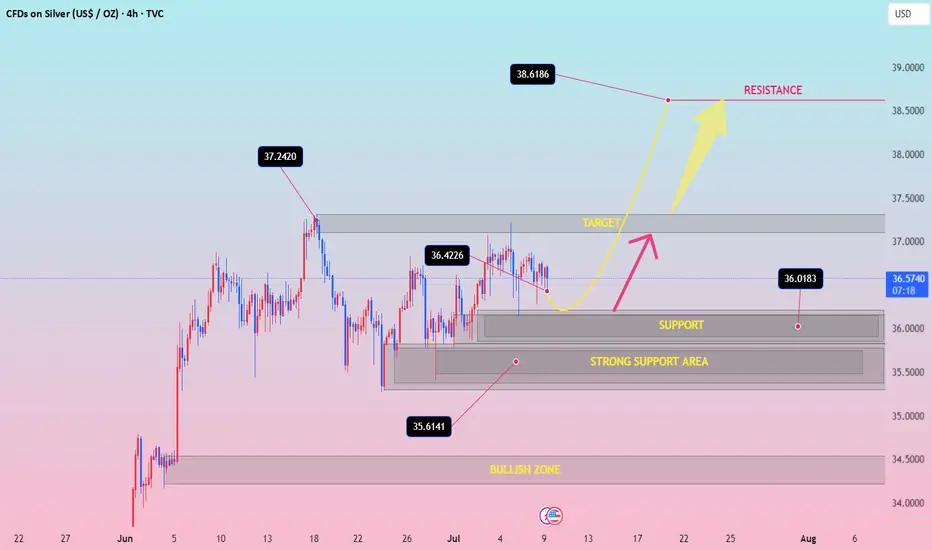
SILVER h4 bullish pattansilver bullish mode Bearish Disruption Scenario:
Fake bounce to ~$37.00
Rejection → Break $36.00 support
Bear momentum pushes to $35.00–34.50
Neutral/Range Disruption:
Price oscillates between 36.00 and 36.80 for longer than expected — builds up coiled energy before either sharp breakout or breakdown
Only Bullish IF:
Clean reclaim of 37.25 with strong close above
NATURAL GAS - STILL IN THE GAME TRADING IDEA UPDATE -
NATURAL GAS - STILL IN THE GAME🔥
The XNGUSD goes quite well, as predicted. It held the trendline and moving upwards slowly, but surely. Short-term support here is the EMA20 on 4h timeframe. The asset is just below 3.600 resistance level and sma200. Since the July 10, the asset seems to be moving within the ascending channel (pic 2). I expect that the price will break the 3.6000 resistance level, will go towards upper channel border and then, after quick retest, move towards 3.8000. Not a trading advice! Trade cautiously!

GOLD Is Going Down! Short!
Please, check our technical outlook for GOLD.
Time Frame: 2h
Current Trend: Bearish
Sentiment: Overbought (based on 7-period RSI)
Forecast: Bearish
The price is testing a key resistance 3,363.11.
Taking into consideration the current market trend & overbought RSI, chances will be high to see a bearish movement to the downside at least to 3,342.15 level.
P.S
Please, note that an oversold/overbought condition can last for a long time, and therefore being oversold/overbought doesn't mean a price rally will come soon, or at all.
Disclosure: I am part of Trade Nation's Influencer program and receive a monthly fee for using their TradingView charts in my analysis.
Like and subscribe and comment my ideas if you enjoy them!
