Gold another bullish breakout supported at 3308The Gold remains in a bullish trend, with recent price action showing signs of a continuation breakout within the broader uptrend.
Support Zone: 3308 – a key level from previous consolidation. Price is currently testing or approaching this level.
A bullish rebound from 3308 would confirm ongoing upside momentum, with potential targets at:
3387 – initial resistance
3400 – psychological and structural level
3435 – extended resistance on the longer-term chart
Bearish Scenario:
A confirmed break and daily close below 3308 would weaken the bullish outlook and suggest deeper downside risk toward:
3290 – minor support
3268 – stronger support and potential demand zone
Outlook:
Bullish bias remains intact while the Gold holds above 3308. A sustained break below this level could shift momentum to the downside in the short term.
This communication is for informational purposes only and should not be viewed as any form of recommendation as to a particular course of action or as investment advice. It is not intended as an offer or solicitation for the purchase or sale of any financial instrument or as an official confirmation of any transaction. Opinions, estimates and assumptions expressed herein are made as of the date of this communication and are subject to change without notice. This communication has been prepared based upon information, including market prices, data and other information, believed to be reliable; however, Trade Nation does not warrant its completeness or accuracy. All market prices and market data contained in or attached to this communication are indicative and subject to change without notice.
Commodities

XAU/USD Update: Ready for a 12% Surge?Welcome back, traders, it’s Skeptic! 😎 Is XAU/USD about to explode or crash?
We’ve formed a symmetrical triangle pattern , and its breakout triggers could deliver solid profits for longs or shorts. Let’s dive into the details with the Daily timeframe to see the big picture.
✔️ Daily Timeframe: Our HWC is strongly bullish. After hitting $ 3,497.80 , we entered a secondary retracement phase, forming a symmetrical triangle. If we break resistance at $ 3,444.18 , my targets are the next ceiling at $ 3,494.50 and, long-term, $ 3,796.64 . But if we break support at $ 3,796.64 , it could signal a major trend change from uptrend to downtrend, opening shorts. Next supports are $ 3,206.32 and $ 3,019.31 —use these as your targets.
📊 Key Insight : Risk management is key to surviving financial markets. Stick to max 1%–2% risk per trade to stay safe.
📉 Market Context: Markets are predicting a major recession in the U.S. economy. If it happens, Gold will be the only safe-haven asset. So, I personally favor riding Gold’s uptrend.
This historic drop screams one thing: global markets are losing faith in U.S. monetary and fiscal policies, big time.
And that’s a loud wake-up call for investors: It’s time to bulletproof your portfolio. What’s that mean?
Your stocks, real estate, cash, bonds , you name it...
They’re slowly but surely turning to Gold .
💬 Let’s Talk!
Which Gold trigger are you eyeing? Hit the comments, and let’s crush it together! 😊 If this update lit your fire, smash that boost—it fuels my mission! ✌️
WTI Oil – From Conflict to StrategyBack on April 24, I marked a short zone. On June 11, price broke above that level, giving a long opportunity — which I took.
Unfortunately, it coincided with the tragic military strike by Israel on Iran, pushing oil sharply higher. I’ve pinned that analysis.
Following the ceasefire, price dropped again — just a reminder that geopolitics can shake the charts.
As traders, we stay prepared to act, even while acknowledging the deep sadness of lives lost.
Now I wait for price to reach my marked level again. If I get a valid signal, I’ll short.
But if price breaks and holds above, I’ll buy the pullback — with no bias, just pure execution.
Risk-managed. Emotion-neutral. Opportunity-focused.
XAUUSD: Market analysis and strategy on July 14Gold technical analysis
Daily chart resistance 3412, support below 3339
Four-hour chart resistance 3400, support below 3349
One-hour chart resistance 3390, support below 3353
Gold news analysis: In the Asian market on Monday, spot gold hit a high of 3374, a new high since June 23. Trump announced last weekend that he would impose a 30% tariff on goods imported from the European Union from August 1, further heating up the market's concerns about international trade and providing momentum for gold prices to rise. Gold prices rose 1% last Friday, closing at 3357, as investors sought safe-haven assets after US President Trump announced multiple tariff measures. Analysts said the uncertainty premium has returned to the market again. Last week, Trump stepped up his tariff offensive against Canada, saying that the United States would impose a 35% tariff on Canadian imports in August and planned to impose a comprehensive tariff of 15% or 20% on most other trading partners. Trump also announced last week that he would impose a 50% tariff on imported copper and a 50% tariff on Brazilian goods.
Gold operation suggestions:
From the current trend analysis, the support below focuses on the four-hour level 3349--53 range support, and the upper pressure focuses on the suppression near the 3400-3412 range. The short-term long and short strength dividing line is 3350. If the four-hour level stabilizes above this position, continue to buy on dips.
Buy: 3350near
Buy: 3356near
XAUUSD (Gold) - Future Outlook (as of mid-July 2025)In continuation :-
The future outlook for Gold (XAUUSD) is a complex interplay of various macroeconomic factors, geopolitical developments, and market sentiment. As of mid-July 2025, several key themes are likely to shape its trajectory:
Monetary Policy and Interest Rate Expectations (Central Bank Actions):
Impact: Gold is a non-yielding asset. Therefore, its attractiveness is highly sensitive to interest rate movements. Higher interest rates (or expectations of them) tend to increase the opportunity cost of holding gold, as investors can earn more from interest-bearing assets like bonds. Conversely, lower rates or a more dovish stance from central banks (like the U.S. Federal Reserve, ECB, BoJ) reduce this opportunity cost, making gold more appealing.
Current Context: As of mid-2025, markets are closely watching central bank rhetoric regarding potential rate cuts. If inflation continues to moderate, leading to clearer signals or actual rate cuts, this would likely be a positive catalyst for gold prices. However, if inflation proves stickier or central banks maintain a "higher for longer" policy, gold could face headwinds.
Inflation Outlook:
Impact: Gold has historically been considered a hedge against inflation and a store of value during periods of rising prices.
Current Context: If inflation remains elevated or shows signs of re-accelerating, demand for gold as an inflation hedge could increase, providing support to prices. If inflation falls back significantly to central bank targets, this traditional appeal might lessen somewhat, unless other safe-haven drivers emerge.
U.S. Dollar Strength:
Impact: Gold is primarily priced in U.S. dollars. A stronger U.S. dollar makes gold more expensive for international buyers holding other currencies, potentially dampening demand. A weaker dollar has the opposite effect, making gold cheaper and generally supportive of higher gold prices.
Current Context: The dollar's strength is heavily influenced by U.S. interest rate differentials and the relative economic performance of the U.S. versus other major economies. A "risk-off" environment can also lead to dollar strength (as a safe-haven itself), which can create a counteracting force for gold.
Geopolitical Risks and Economic Uncertainty:
Impact: Gold is a classic "safe-haven" asset. In times of increased geopolitical tension, economic instability, financial market turmoil, or escalating conflicts, investor demand for gold typically surges as a store of value.
Current Context: Global geopolitical landscape remains complex, with ongoing regional conflicts, trade disputes, and political uncertainties. Any escalation in these areas would likely contribute to increased safe-haven demand for gold. Similarly, if there are growing concerns about a global economic slowdown or recession, gold's appeal as a safe haven could strengthen.
Central Bank Gold Demand:
Impact: Central banks globally have been significant buyers of gold in recent years, diversifying their reserves away from the U.S. dollar. Their sustained buying provides a structural floor to gold demand.
Current Context: Continued strong buying by central banks, particularly from emerging economies, is expected to remain a supportive factor for gold prices in the medium to long term.
Overall Future Outlook (Mid-July 2025 Perspective):
The outlook for Gold (XAUUSD) appears cautiously bullish in the medium term, with potential for continued appreciation.
Positive Drivers: The primary drivers are the increasing likelihood of future interest rate cuts (even if gradual), potentially persistent underlying inflation concerns, and the ongoing elevated geopolitical risks and global economic uncertainties. Continued strong central bank demand further underpins this outlook.
Potential Headwinds: A significantly stronger-than-expected U.S. dollar (e.g., due to a major global "risk-off" event that drives dollar demand, or robust U.S. economic outperformance leading to delayed rate cuts) could provide a counteracting force. Rapid disinflation could also temper some of gold's appeal.
In summary, Gold is likely to remain an important asset in investor portfolios, acting as both an inflation hedge and a safe haven. Its price action will be particularly sensitive to central bank policy shifts and global stability.
⚠️ Disclaimer: This post is educational content and does not constitute investment advice, financial advice, or trading recommendations. The views expressed here are based on technical analysis and are shared solely for informational purposes. The stock market is subject to risks, including capital loss, and readers should exercise due diligence before investing. We do not take responsibility for decisions made based on this content. Consult a certified financial advisor for personalized guidance
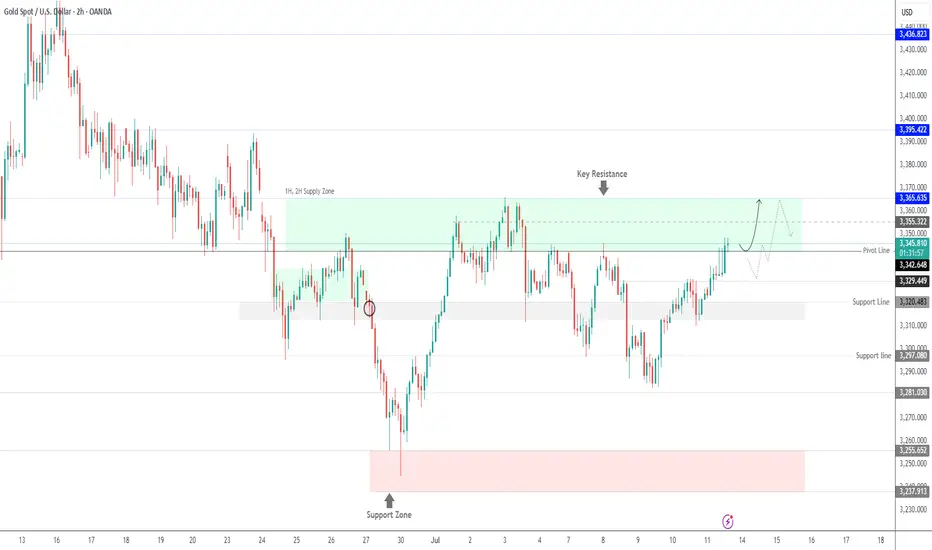
Gold Bullish Above 3342 – Watching 3365 BreakoutGold Futures Rise on Trade & Geopolitical Tensions
Gold continues to gain as renewed tariff threats from the U.S. and rising geopolitical risks weigh on market sentiment.
While markets have become somewhat desensitized to Trump’s recurring trade rhetoric, concerns remain that resolutions may be delayed.
Technical Outlook:
As long as the price holds above 3342, the bullish trend is likely to continue toward 3355 and 3365.
A stable close above 3365 would open the way to 3395.
However, a 1H close below 3342 may trigger a pullback to 3329.
Pivot: 3342
Resistance: 3355, 3365, 3395
Support: 3329, 3319, 3309
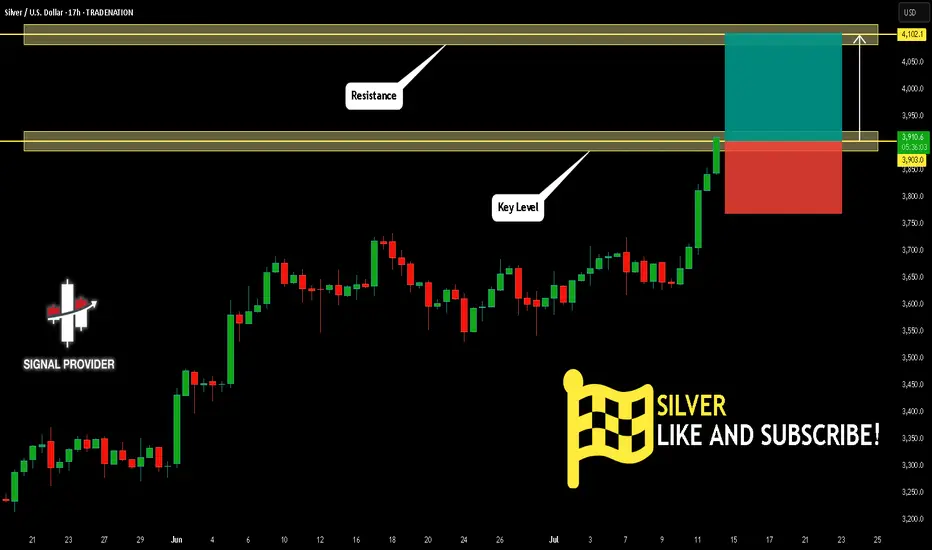
SILVER Will Go Up From Support! Buy!
Please, check our technical outlook for SILVER.
Time Frame: 17h
Current Trend: Bullish
Sentiment: Oversold (based on 7-period RSI)
Forecast: Bullish
The market is approaching a key horizontal level 3,903.0.
Considering the today's price action, probabilities will be high to see a movement to 4,102.1.
P.S
Overbought describes a period of time where there has been a significant and consistent upward move in price over a period of time without much pullback.
Disclosure: I am part of Trade Nation's Influencer program and receive a monthly fee for using their TradingView charts in my analysis.
Like and subscribe and comment my ideas if you enjoy them!
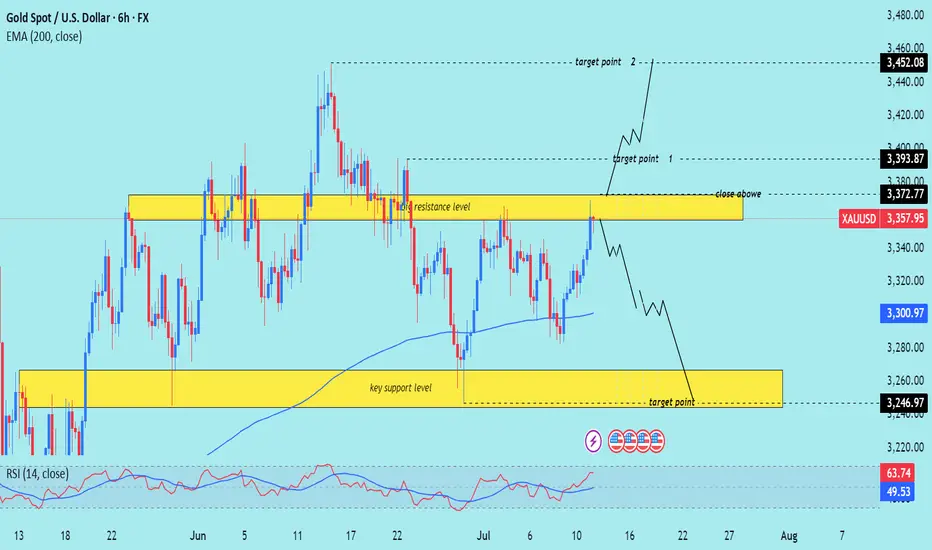
XAU/USD technical analysis setup Read The captionSMC trading point update
Technical analysis of (XAU/USD) on the 6-hour timeframe, focusing on a key resistance zone that could trigger either a bullish breakout or a bearish reversal.
---
Analysis Summary
Current Price: $3,357.95
Trend Context: Price is testing a strong resistance zone with a possible breakout or rejection in play.
---
Scenario 1 – Bullish Breakout
1. Resistance Zone: $3,357–$3,372
Multiple previous rejections.
A confirmed close above $3,372.77 signals bullish strength.
2. Upside Targets:
Target 1: $3,393.87
Target 2: $3,452.08
3. Indicators:
RSI at 63.74, approaching overbought but still with room to rally.
EMA 200 is trending upward, supporting bullish bias.
---
Scenario 2 – Bearish Rejection
1. If price fails to close above $3,372.77, a rejection from resistance is likely.
2. Downside Targets:
Reversal projected toward the key support zone at $3,246.97
EMA 200 at $3,300.97 may provide temporary support before breakdown.
---
Trade Ideas
Direction Entry Level Stop-Loss Target 1 Target 2
Bullish Close above $3,372 Below $3,346 $3,393.87 $3,452.08
Bearish Rejection from $3,357–$3,372 Above $3,380 $3,300 → $3,246.97
Mr SMC Trading point
---
Summary
This is a critical decision point for Gold. A breakout above resistance can propel price to $3,450, while rejection could drive price back to $3,246. The reaction at the current zone will dictate the next major swing.
Please support boost 🚀 this analysis)
Short position profit, focus on 3355-3345 support📰 News information:
1. Focus on tomorrow's CPI data
2. Bowman's speech at the Federal Reserve
3. Tariff information outflows and countries' responses to tariff issues
📈 Technical Analysis:
The short-term bears have successfully hit the TP to realize profits, and the trading strategy is still valid. Continue to pay attention to the 3355-3345 support during the day. If effective support is obtained here, you can consider going long. For the rebound, the first TP can focus on the 3365 line. If the gold price breaks through 3380 in the future, it will not be far from 3400. If it falls below, pay attention to the support of 3330-3320 below. It is expected that this is the limit position of short-term bearishness. The impact of tariffs is still there, and the bullish trend remains optimistic in the short term, unless Europe, Japan and other countries have a new solution to tariffs.
🎯 Trading Points:
BUY 3355-3345
TP 3365-3380-3400
In addition to investment, life also includes poetry, distant places, and Allen. Facing the market is actually facing yourself, correcting your shortcomings, facing your mistakes, and exercising strict self-discipline. I share free trading strategies and analysis ideas every day for reference by brothers. I hope my analysis can help you.
OANDA:XAUUSD PEPPERSTONE:XAUUSD FOREXCOM:XAUUSD FX:XAUUSD TVC:GOLD FXOPEN:XAUUSD
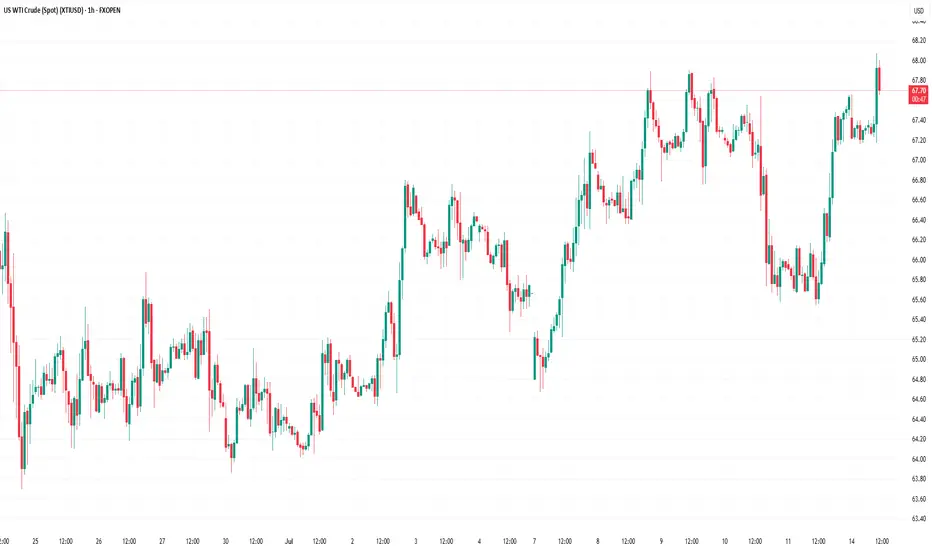
WTI Crude Oil Climbs Higher Amid Market OptimismMarket Analysis: WTI Crude Oil Climbs Higher Amid Market Optimism
WTI Crude Oil price climbed higher above $66.50 and might extend gains.
Important Takeaways for WTI Crude Oil Price Analysis Today
- WTI Crude Oil price started a decent increase above the $66.60 resistance levels.
- There was a break above a connecting bearish trend line with resistance at $67.15 on the hourly chart of XTI/USD at FXOpen.
Oil Price Technical Analysis
On the hourly chart of WTI Crude Oil at FXOpen, the price started a decent upward move from $65.50. The price gained bullish momentum after it broke the $66.50 resistance and the 50-hour simple moving average.
The bulls pushed the price above the $67.00 and $67.50 resistance levels. There was a break above a connecting bearish trend line with resistance at $67.15.
The recent high was formed at $67.63 and the price started a downside correction. There was a minor move toward the 23.6% Fib retracement level of the upward move from the $65.54 swing low to the $67.63 high.
The RSI is now above the 60 level. Immediate support on the downside is near the $67.15 zone. The next major support on the WTI Crude Oil chart is near the $66.60 zone or the 50% Fib retracement level, below which the price could test the $65.50 level. If there is a downside break, the price might decline toward $64.70. Any more losses may perhaps open the doors for a move toward the $63.50 support zone.
If the price climbs higher again, it could face resistance near $67.85. The next major resistance is near the $70.00 level. Any more gains might send the price toward the $72.50 level.
This article represents the opinion of the Companies operating under the FXOpen brand only. It is not to be construed as an offer, solicitation, or recommendation with respect to products and services provided by the Companies operating under the FXOpen brand, nor is it to be considered financial advice.
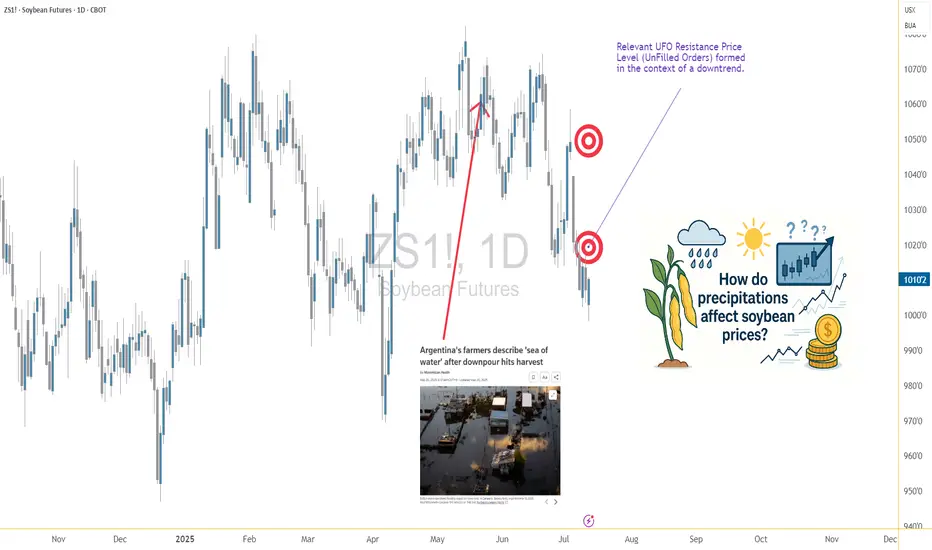
Soybeans and Rain: Moisture’s Market Impact on the Bean Trade1. Introduction: Moisture & Market Momentum
Soybeans, often referred to as “the oilseed king,” are a cornerstone of global agriculture. As a leading source of protein for both humans and animals, their price fluctuations affect industries ranging from food production to biofuels. One key variable traders often monitor? Rainfall. 🌧️
Moisture plays a critical role in soybean development, influencing yield and quality from the moment the seed is sown. It’s no surprise that many market participants assume a strong correlation between rainfall and price behavior. But is that assumption truly supported by data?
In this article, we analyze how varying precipitation levels impact weekly soybean futures returns. As you'll see, the results might not be as clear-cut as you’d expect—but they still offer meaningful insights.
2. Biological Realities: Soybeans’ Water Needs
Soybeans thrive under specific conditions. While they’re generally resilient, rainfall—or the lack thereof—can tip the balance between bumper harvests and disappointing yields.
During early vegetative stages, sufficient moisture ensures healthy root development. Later, during the pod-fill phase, rainfall becomes even more essential. Too little water at this point leads to incomplete pods or aborted seeds. On the flip side, too much rain can invite fungal diseases and delay harvests, especially in lower-lying regions.
In countries like Brazil and Argentina, soybean fields often face seasonal extremes, while the U.S. Midwest typically enjoys more consistent conditions—though droughts and floods have both hit the Corn Belt in recent years. These environmental realities create natural volatility in both yield and pricing expectations.
3. Methodology: How We Analyzed Weather vs. Futures
To explore the potential connection between rainfall and soybean futures prices, we collected weekly weather data for major soybean-growing cities across the globe. Each week’s precipitation was categorized using a normalized percentile system:
Low Rainfall: below the 25th percentile
Normal Rainfall: between the 25th and 75th percentiles
High Rainfall: above the 75th percentile
We then matched this data against weekly returns of standard soybean futures (ZS) and micro soybean futures (MZS), both traded on the CME Group.
This allowed us to compare average price behavior in different rainfall scenarios—and test whether there was any statistically significant difference between dry and wet weeks.
4. Statistical Findings: Is There a Signal in the Noise?
When examining the data, the initial visual impression from boxplots was underwhelming—return distributions across rainfall categories looked surprisingly similar. However, a deeper dive showed that the difference in mean returns between low and high precipitation weeks was statistically significant, with a p-value around 0.0013.
What does that mean for traders? While the signal may not be obvious to the naked eye, statistically, rainfall extremes do impact market behavior. However, the magnitude of impact remains modest—enough to be part of your strategy but not enough to drive decisions in isolation.
Soybean prices appear to be influenced by a mosaic of factors, with precipitation being just one tile in that complex picture.
5. Charting the Relationship: Visual Evidence
While statistical tests gave us the green light on significance, we know traders love to “see” the story too. Boxplots of weekly soybean futures returns segmented by rainfall categories offered a subtle narrative:
Low-precipitation weeks showed slightly higher average returns and tighter interquartile ranges.
High-precipitation weeks had broader return distributions and more frequent downside outliers.
Normal weeks exhibited relatively stable behavior, reinforcing the idea that the market reacts most during extremes.
This kind of visualization may not scream alpha at first glance, but it reinforces the idea that precipitation events—particularly dry spells—tend to nudge prices upward, possibly as market participants price in production risk.
6. Trading Implications: Positioning Around Weather
Here’s where things get practical. While weather alone won’t dictate every trading decision, it can be a key filter in a broader strategy. For soybean traders, rainfall data can help inform:
Bias assessment: Low-precipitation weeks may suggest bullish tendencies.
Risk control: Expect wider return distributions in high-precip weeks—adjust stops or contract sizing accordingly.
Event trading: Pair weather anomalies with technical signals like trendline breaks or volume surges for potential setups.
It’s also worth noting that weekly weather forecasts from reputable sources can serve as a forward-looking indicator, giving traders a head start before the market fully reacts.
7. Margin Efficiency with Micro Soybeans
For traders looking to scale into soybean exposure without the capital intensity of full contracts, the CME Group’s micro-sized futures offer a compelling alternative.
📌 Contract Specs for Soybean Futures (ZS):
Symbol: ZS
Contract size: 5,000 bushels
Tick size: 1/4 of one cent (0.0025) per bushel = $12.50
Initial margin: ~$2,100 (varies by broker and volatility)
📌 Micro Soybean Futures (MZS):
Symbol: MZS
Contract size: 500 bushels
Tick size: 0.0050 per bushel = $2.50
Initial margin: ~$210
These smaller contracts are perfect for strategy testing, risk scaling, or layering exposure around key macro events like WASDE reports or weather disruptions. For traders aiming to build weather-aligned positions, MZS is a powerful tool to balance conviction with capital efficiency.
8. Wrapping It All Together
Rain matters. Not just in fields, but in futures prices too. While soybean markets may not overreact to every drizzle or downpour, extreme rainfall conditions—especially drought—can leave noticeable footprints on price action.
For traders, this means opportunity. By incorporating precipitation metrics into your workflow, you unlock a new layer of context. One that doesn’t replace technical or fundamental analysis, but enhances both.
And remember: this article is just one piece of a larger exploration into how weather affects the commodity markets. Make sure you also read prior installments.
When charting futures, the data provided could be delayed. Traders working with the ticker symbols discussed in this idea may prefer to use CME Group real-time data plan on TradingView: tradingview.sweetlogin.com - This consideration is particularly important for shorter-term traders, whereas it may be less critical for those focused on longer-term trading strategies.
General Disclaimer:
The trade ideas presented herein are solely for illustrative purposes forming a part of a case study intended to demonstrate key principles in risk management within the context of the specific market scenarios discussed. These ideas are not to be interpreted as investment recommendations or financial advice. They do not endorse or promote any specific trading strategies, financial products, or services. The information provided is based on data believed to be reliable; however, its accuracy or completeness cannot be guaranteed. Trading in financial markets involves risks, including the potential loss of principal. Each individual should conduct their own research and consult with professional financial advisors before making any investment decisions. The author or publisher of this content bears no responsibility for any actions taken based on the information provided or for any resultant financial or other losses.
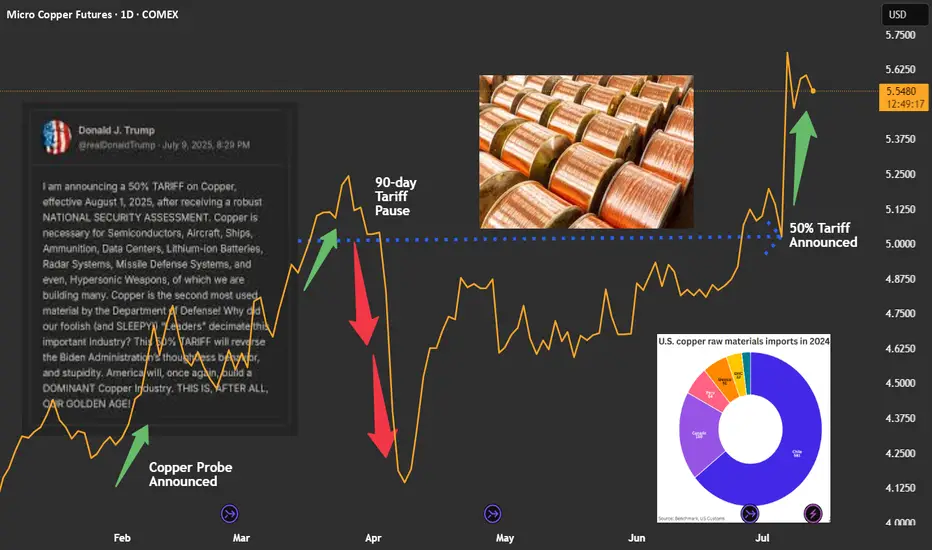
Copper: Event-driven Trade Idea on Recent TariffsCOMEX: Micro Copper Futures ( COMEX_MINI:MHG1! ), #microfutures
The Event
On July 9th, President Trump announced that he would impose a 50% tariff on imports of copper, effective August 1st.
The decision was based on national security assessment. Copper is the second most used material by the U.S. Department of Defense. The President intents to use tariffs to reduce reliance on imports and shore up support for domestic production.
Immediate Market Reaction
U.S. copper prices ended Tuesday’s session over 13% higher — the sharpest single-day gain since 1989. The September COMEX copper futures contract was settled at $5.584 a pound on Friday, up 35.7% year-to-date.
Due to tariffs, Copper in the U.S. is priced at a large premium over international markets.
• UK: LME copper contract was quoted at $9,660.5 per ton on Friday.
• China: SHFE coper futures was settled at RMB 78,420 per ton. It can be converted to $10,959.4 via the Dollar/RMB exchange rate of 7.1555.
• US: COMEX copper quote of $5.584 can be converted to $12,312.7 per ton.
• As of Friday, COMEX copper is priced at a 27.5% premium over LME copper, and a 12.3% premium over SHFE copper.
The U.S. Copper Market
The U.S. Geological Survey reports that the 2024 total refined copper consumption was 1.8 million metric tons. Of which, 850,000 tons were from mining, 150,000 tons were refined from scrap, and 810,000 tons from imports.
Chile is the biggest source of U.S. copper imports, accounting for 581,000 tons, or 71.7% of total imports. Canada is the second largest, for 169,000 tons, or 20.9%.
Copper is a widely used base metal, found in products ranging from machinery, electronics, household goods, housing, infrastructure projects, to aircraft and missiles.
Since President Trump announced a probe into copper in February, traders have been poised for a hike on copper duties, leading to major shifts in inventories away from Europe and Asia and into the U.S.
The Next Event: Will the Copper Tariffs get postponed or reduced?
The goal to increase domestic production of copper is very challenging. It will take years to ramp up and decades to fully meet demand — at a massive upfront investment cost.
Hiking the import duties would not help national security. It could not change the fact that the biggest copper mines are in Chile, Peru and Canada. A sharp increase in the cost of copper will quickly translate into wide-ranging inflation in the U.S.
In my opinion, once the Trump administration realizes the full impacts, we could possibly see a crawl-back from the intended copper tariffs. The effective date would be postponed, the tariff rate could be reduced, and many companies may get exemption/waiver. We have seen similar maneuvers happening multiple times in the past few months.
Overall, the actual impact of copper tariffs will be much smaller than the original announcement.
Shorting COMEX Copper Futures
Historically, the price difference between COMEX and LME coppers has been near-zero and was around the $150 level in 2024.
Since February, COMEX copper has been trading at $500-$1,500 premium over LME. As of Friday, COMEX copper futures have gone up 35% this year and are now priced at $2,652 per ton above LME copper.
In my opinion, these price differences reflect no economic fundamentals. It is purely due to the ever-changing global tariff conflict. If President Trump rescinds his tariff narratives, we could likely see a large drop in COMEX copper prices.
A trader sharing this view could explore shorting the COMEX Micro copper ( GETTEX:MHG ).
Last Friday, the September micro copper futures contract (MHGU5) was settled at 5.5910. Each contract has a notional value of 2,500 pounds of high-grade copper, or a market value of $13,977.5. To buy or sell 1 contract, a trader is required to post an initial margin of $1,100. The margining requirement reflects a built-in leverage of 12.7-to-1.
Let’s use a hypothetical trade to illustrate how to use a short futures position to take advantage a potential reduction on copper tariffs.
Hypothetical Trade:
• Short 1 MHGU5 contract at 5.5910, and set a stop loss at 6.00
• Trader pays $1,100 for initial margin
Scenario 1: Tariffs go into effect, copper rises to $6.57
• Futures reflect a 50% premium over current LME copper price, which is at $4.38 per pound
• Short order stop loss at 6.00, and the maximum loss is $1,022.5 (= (6-5.591) x 2500)
• The trader loses most of the margining fund, but owes no more
Scenario 2: Trump Rescinds Tariffs, Copper falls to $4.38
• COMEX copper will be priced at No premium over LME
• Short position gains: $3,027.5 (= (5.591-4.38) x 2500)
• The hypothetical return will be 275.2% (= 3027.5 / 1100)
The above scenarios show that
• When copper falls, short position will have higher returns due to its leverage nature.
• When copper rises, the stoploss will kick in to set maximum losses.
The above trade idea could be deployed using the standard-size Copper Futures contract. Its notional value is 25,000 tons, which is 10 times bigger than that of the micro contract. The initial margin is $11,000. The standard-size contract is more liquid. On Friday, it had a total volume of 60,313 contracts, and an open interest of 221,682.
Happy Trading.
Disclaimers
*Trade ideas cited above are for illustration only, as an integral part of a case study to demonstrate the fundamental concepts in risk management under the market scenarios being discussed. They shall not be construed as investment recommendations or advice. Nor are they used to promote any specific products, or services.
CME Real-time Market Data help identify trading set-ups and express my market views. If you have futures in your trading portfolio, you can check out on CME Group data plans available that suit your trading needs tradingview.sweetlogin.com
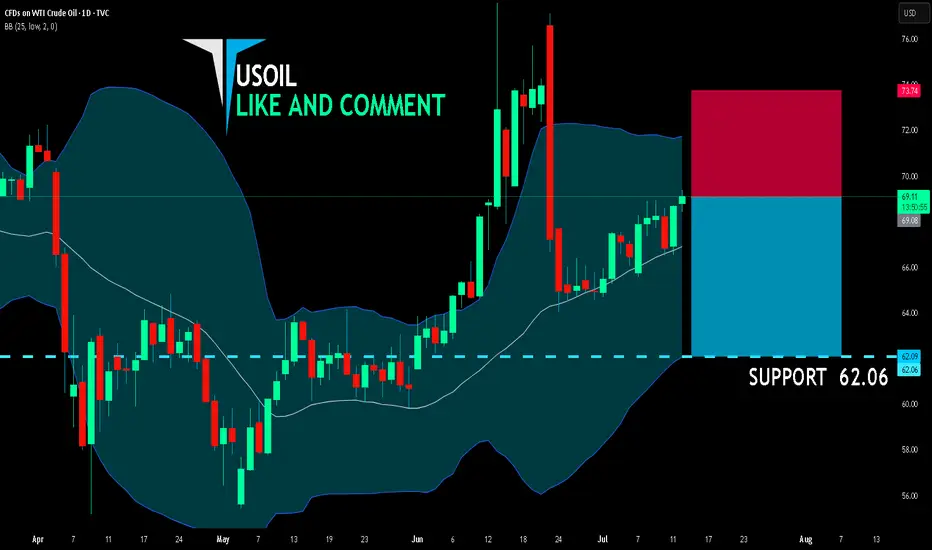
USOIL SELLERS WILL DOMINATE THE MARKET|SHORT
USOIL SIGNAL
Trade Direction: short
Entry Level: 69.08
Target Level: 62.06
Stop Loss: 73.74
RISK PROFILE
Risk level: medium
Suggested risk: 1%
Timeframe: 1D
Disclosure: I am part of Trade Nation's Influencer program and receive a monthly fee for using their TradingView charts in my analysis.
✅LIKE AND COMMENT MY IDEAS✅
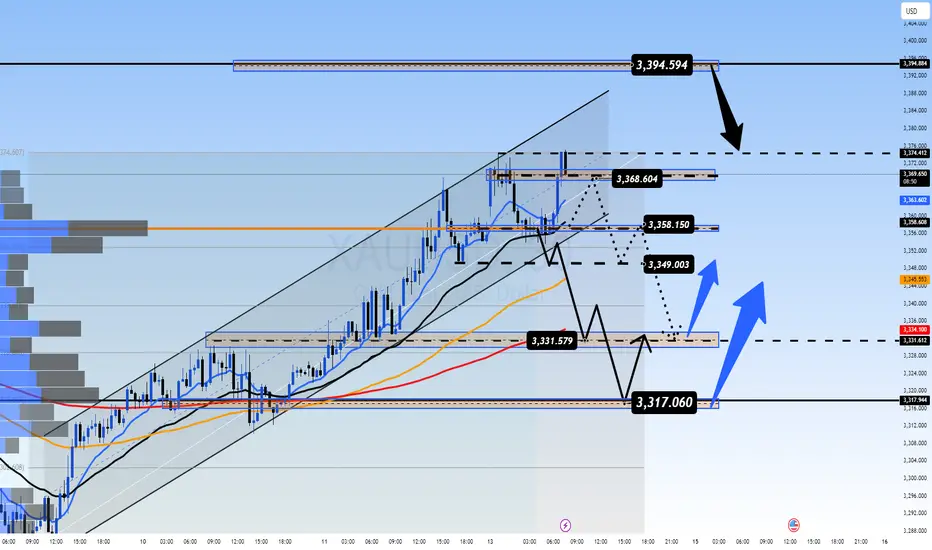
Early Week Pullback Ahead of Key Economic ReleasesGold Outlook – 14 July | Early Week Pullback Ahead of Key Economic Releases
🌍 Market Sentiment & Macro Overview
Gold has started the week with a sharp retracement after filling prior liquidity gaps (FVG) from the past two weeks.
This early weakness signals a risk-off tone as traders adopt a cautious stance ahead of a heavy macroeconomic calendar and geopolitical trade discussions.
This week’s high-impact events include:
📌 US CPI (Inflation Data)
📌 US PPI (Producer Prices)
📌 Unemployment Claims
📌 Retail Sales Figures
These data points will likely set the tone for price action through the second half of the week, with potential for sharp moves in gold.
📉 Technical Snapshot – M30 Chart Structure
Price swept minor liquidity above recent highs
Pulled back by more than $15 from the short-term top
Currently trading below the intraday VPOC (~3358), suggesting short-term bearish momentum
If the selling pressure holds, we may see a move toward:
⚠️ 333x zone — initial liquidity pool
❗ 332x zone — deeper liquidity grab before any bullish reversal
🧭 Trading Plan – Key Zones and Setup
📥 Buy Setup: 3331 – 3329 (Zone of Interest)
Stop Loss: 3325
Target Levels:
TP1: 3335
TP2: 3340
TP3: 3344
TP4: 3350
TP5: 3360 – 3370
✅ A highly reactive zone — ideal for intraday long setups if price sweeps into this area and shows bullish confirmation (e.g., volume spike or rejection wick).
📤 Sell Setup: 3393 – 3395 (Resistance Re-Test)
Stop Loss: 3399
Target Levels:
TP1: 3390
TP2: 3386
TP3: 3382
TP4: 3378
TP5: 3374 – 3370 – 3360
📉 Potential scalp zone if price retests resistance with signs of exhaustion. Monitor closely for bearish structure confirmation.
📊 Key Support & Resistance Levels
Resistance Zones:
3358
3368
3374
3394
Support Zones:
3349
3340
3331
3318
These zones remain relevant for both momentum trades and reversion setups.
⚠️ Strategy Considerations
At the time of writing, gold is trading indecisively around the M30 VPOC. No clear breakout has occurred yet.
⏳ Wait for volume confirmation during the London session
🚫 Avoid impulsive entries based on emotions or FOMO
✅ Stick to your risk parameters and let price come to your level
🧠 Summary & Bias
Gold is experiencing an early-week technical correction after recent strength.
The market is in "wait-and-see" mode, with macro drivers likely to dictate direction from mid-week onwards.
📍 Watch the 3331–3329 zone closely — it remains the most attractive level for long setups.
📍 The 3393–3395 zone is a key area to fade strength if price struggles at resistance.
Patience and precision are key this week. Let the market reveal its intention, and trade accordingly.
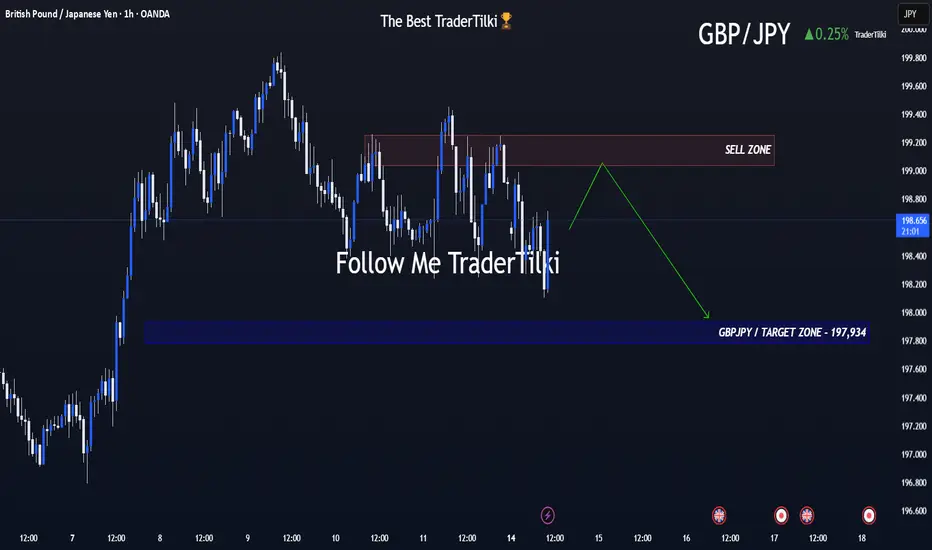
Volatile Times for GBPJPY: What’s Going On Behind the Moves?Good morning, Guys,
I’m anticipating a new short opportunity on GBPJPY once the pair reaches my sell zone level. From there, my target is set at 197.934.
Every like from you is what truly motivates me to keep sharing these insights.
Massive thanks to everyone who shows love and support!
Gold 30Min Engaged ( Two Bullish Entry's Detected )Time Frame: 30-Minute Warfare
Entry Protocol: Only after volume-verified breakout
🩸Bullish Reversal 3311 Zone
🩸Bullish Break 3343 Zone
➗ Hanzo Protocol: Volume-Tiered Entry Authority
➕ Zone Activated: Dynamic market pressure detected.
The level isn’t just price — it’s a memory of where they moved size.
Volume is rising beneath the surface — not noise, but preparation.
🔥 Tactical Note:
We wait for the energy signature — when volume betrays intention.
The trap gets set. The weak follow. We execute.
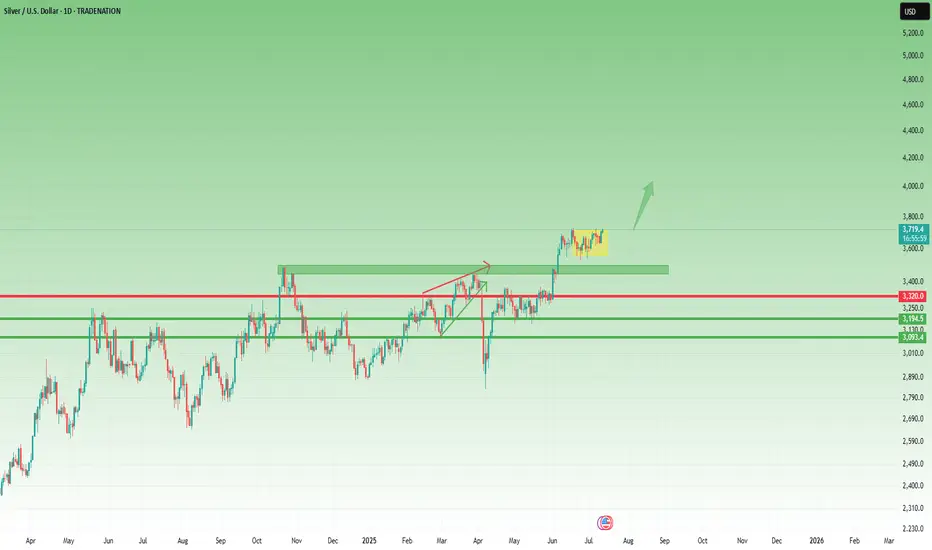
Silver Analysis – Strong Bulls and a Clean Setup AheadLast month, Silver printed a new multi-decade high, a major technical milestone.
Since then, price has entered a sideways consolidation, forming a rectangle — but what stands out is this:
👉 Silver bulls have absorbed every dip, even when Gold dropped.
That’s strength. And strength usually precedes breakout.
🔍 Current Situation
At the time of writing, price is trading around 37.20,
and from the current structure, it looks like nothing is standing in the way of an upside break.
We don’t predict — we prepare...
And this chart looks ready.
🎯 Next Target: 40.00 USD?
A push to 40.00 looks like the next “normal” target.
But don’t forget: that’s a 3,000 pip move.
This type of move will require patience
Plan your trade.
Respect your risk.
Let the bulls work. 🚀
Disclosure: I am part of TradeNation's Influencer program and receive a monthly fee for using their TradingView charts in my analyses and educational articles.
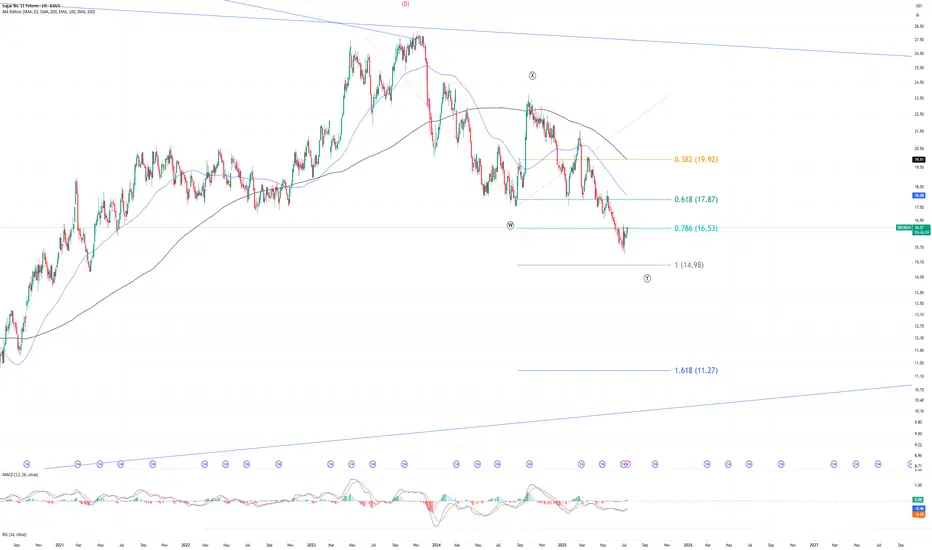
Sugar is entering into bullish marketSugar is entering a bull market. I expect a recovery this week or two. The minimum wave equality norm has been fulfilled, so we may see multi-year bullish growth. But we need to be careful not to fall into another, final low at $13-11.
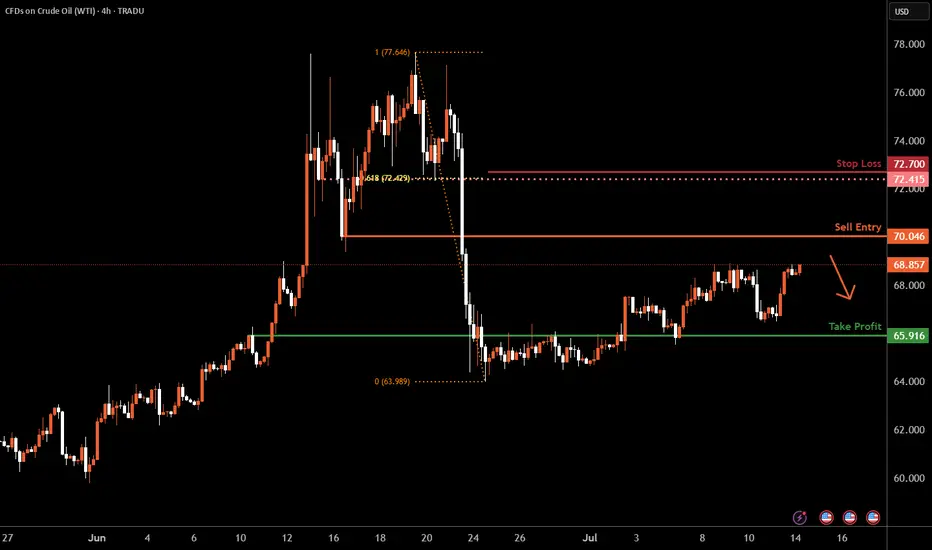
WTI Oil H4 | Rising into a pullback resistanceWTI oil (USOIL) is rising towards a pullback resistance and could potentially reverse off this level to drop lower.
Sell entry is at 70.04 which is a pullback resistance.
Stop loss is at 72.70 which is a level that sits above the 61.8% Fibonacci retracement and a pullback resistance.
Take profit is at 65.91 which is an overlap support.
High Risk Investment Warning
Trading Forex/CFDs on margin carries a high level of risk and may not be suitable for all investors. Leverage can work against you.
Stratos Markets Limited (tradu.com ):
CFDs are complex instruments and come with a high risk of losing money rapidly due to leverage. 63% of retail investor accounts lose money when trading CFDs with this provider. You should consider whether you understand how CFDs work and whether you can afford to take the high risk of losing your money.
Stratos Europe Ltd (tradu.com ):
CFDs are complex instruments and come with a high risk of losing money rapidly due to leverage. 63% of retail investor accounts lose money when trading CFDs with this provider. You should consider whether you understand how CFDs work and whether you can afford to take the high risk of losing your money.
Stratos Global LLC (tradu.com ):
Losses can exceed deposits.
Please be advised that the information presented on TradingView is provided to Tradu (‘Company’, ‘we’) by a third-party provider (‘TFA Global Pte Ltd’). Please be reminded that you are solely responsible for the trading decisions on your account. There is a very high degree of risk involved in trading. Any information and/or content is intended entirely for research, educational and informational purposes only and does not constitute investment or consultation advice or investment strategy. The information is not tailored to the investment needs of any specific person and therefore does not involve a consideration of any of the investment objectives, financial situation or needs of any viewer that may receive it. Kindly also note that past performance is not a reliable indicator of future results. Actual results may differ materially from those anticipated in forward-looking or past performance statements. We assume no liability as to the accuracy or completeness of any of the information and/or content provided herein and the Company cannot be held responsible for any omission, mistake nor for any loss or damage including without limitation to any loss of profit which may arise from reliance on any information supplied by TFA Global Pte Ltd.
The speaker(s) is neither an employee, agent nor representative of Tradu and is therefore acting independently. The opinions given are their own, constitute general market commentary, and do not constitute the opinion or advice of Tradu or any form of personal or investment advice. Tradu neither endorses nor guarantees offerings of third-party speakers, nor is Tradu responsible for the content, veracity or opinions of third-party speakers, presenters or participants.
Silver breaks out to 14 year highsSilver has broken out again above the previous resistance zone at $37.00-$37.30 amid ongoing concerns surrounding tariffs
If we see corrective retests of this $37.00-$37.30 it can offer a good opportunity to get long and take advantage of Silvers bullish momentum.
Stops would need to be below $36.75 and targets can be set to around $40.00-$41.50

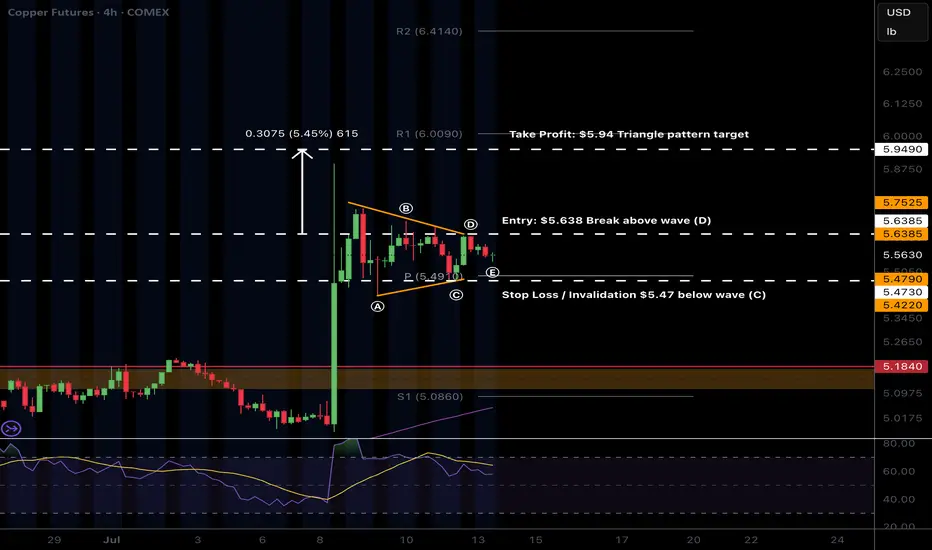
$COPPER triangle trade?CAPITALCOM:COPPER triangle has potentially printed and a triangle is an Elliot wave pattern that results in a terminal thrust up to complete a motif wave.
That would trap bulls as price terminates with a poke above the all time high keeping them believing they can capture the same gains already gone.
After the termination wave 2 often finds support at the triangle base.
Safe trading
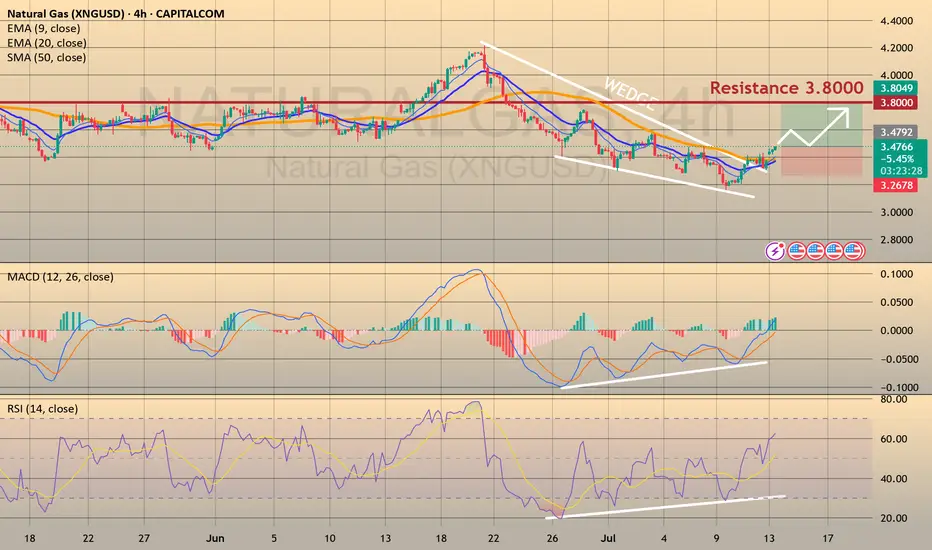
NATURAL GAS - REBOUND FROM THE MAJOR TRENDLINE AND ANOTHER LONG CAPITALCOM:NATURALGAS
Last week on Wednesday and Thursday we observed the false breakout of the major trendline. Eventually, Thursday ended up bullish, gaining 4.8% day-to-day. On Friday the asset has been trading majorly sideways, retesting the major trendline (pic 1). Technically, looks like the divergence on RSI, MACD and Momentum works out as well as the bullish wedge (pic 2). Fundamentally, we still have warm temperature weather forecasts in the U.S. and bullish Thursday's EIA report. Additionally, today the market opened with a bullish gap and continues to grow, which is a good signal for the buyers.
Considering major levels here, I decided to open long positions:
🔼 a market buy order at 3.4556 with
❌a stop loss at 3.2995 and
🤑a take profit at 3.7927
At 3.6000 would be reasonable to reduce long position on a half. Thank you for the attention!
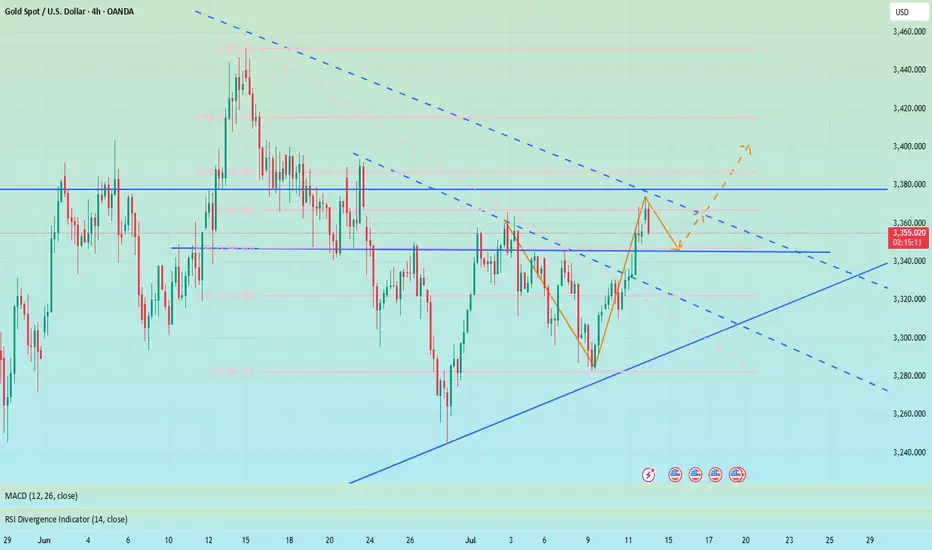
Market Structure & Technical Context 14 July 20241. Price Action & Market Structure
Gold has broken recent swing highs above ~$3,360, marking a bullish Break of Structure (BOS) and signaling upward momentum continuity
Recent pullback zones around $3,350–$3,340 formed a clear Higher Low (Change of Character) — textbook price action confirmation.
2. Fibonacci Retracement / Extension
Measuring from the last swing low near ~$3,326 to swing high ~3,374:
38.2% retracement at ~$3,352 coincides with the current bounce zone.
50% retracement at ~$3,350 aligns with key structure support.
Upside extension targets: 1.272 at ~$3,396, 1.618 at ~$3,425 — overlapping major resistance zones
3. ICT & Smart Money Concepts (SMC)
Order Blocks (OBs) identified near $3,340–$3,342 (prior resistance turned support) — ideal demand zone.
A recent Buy-side liquidity grab eclipsed above $3,360, sweeping stops and gathering liquidity before the breakout — classic ICT setup .
A Fair Value Gap (imbalance) lies around $3,345–$3,350 — zone to expect value-driven retracement.
Higher timeframe has clear SMC alignment: BOS above 3,360 with CHoCH already formed.
4. Major Supply / Demand & Support / Resistance Zones
Demand: $3,340–$3,352 (OB + Fib + BOS confluence).
Supply: $3,380–$3,385 (intraday swing high resistance), followed by zone at $3,396–$3,400.
Key resistance at $3,360–$3,362 — confirmed supply pocket that needs to be reclaimed
5. Moving Average Confirmation
The 4‑hour SMA/EMA 100–200 band is sloping up just below current price (~$3,340–$3,350), reinforcing the bullish context .
1‑Hour Intraday Setups (Aligned with HTF Bullish Bias)
Setup A: Pullback into 4‑Hour OB / Fair Value Gap
Entry: Limit buy at $3,345–$3,350.
Stop: Below $3,335 (below imbalance & BOS).
TP1: $3,362 (former resistance).
TP2: $3,380 (next supply block).
Setup B: Breakout Retest of 3,360
Entry: Buy on retest of broken resistance at $3,360.
Stop: Below $3,356.
TP1: $3,380.
TP2: $3,396 (Fib extension confluence).
Setup C: Momentum Continuation Fresh Breakout
Entry: Market buy on clear H1 BOS above $3,365.
Stop: Below breakout candle low (~$3,360).
TP: $3,396 (1.272 Fib) – extend to $3,425 if momentum strong.
The Golden Setup:
Setup A—buy from $3,345–$3,350—has strong confluences:
4‑hour demand OB + fair value gap,
38.2–50% Fib retracement,
SMC BOS/imbalance alignment,
ICT-style order block zone.
This offers high edge with confluence clusters.
✔ Summary Report: Direction & Key Zones
Directional Bias:
Medium-term (4H): Bullish, confirmed by BOS above 3,360, higher lows, OB and Fibonacci alignment.
🔹 Primary Buy Zones:
$3,345–$3,350 — 4H OB + fair value gap + Fib.
$3,360 on retention — breakout retest zone.
Momentum entry >$3,365.
🔹 Key Target Zones:
First resistance: $3,360–$3,362.
Next supply: $3,380–$3,385.
Extension target: $3,396 (1.272 Fib), then $3,425 (1.618 Fib).
🔻 Watchdownside Risk:
Daily invalidation if drop below $3,335 (4H OB break).
Next support at $3,326–$3,330.
📋 Consolidated Table: Setups at a Glance
Setup Entry Zone Stop Targets
Golden $3,345–$3,350 $3,335 TP1: $3,362 / TP2: $3,380
Breakout Pullback $3,360 retest $3,356 $3,380 → $3,396
Momentum BOS >$3,365 (H1 BOS) < $3,360 $3,396 → $3,425
Final Thoughts
On the 4‑hour chart, price is firmly in a bullish regime, supported by price structure, SMC, ICT concepts, and Fibonacci confluence. The $3,345–$3,350 zone is the highest‑probability entry for buyers, offering excellent risk/reward. The Golden Setup targets ~$3,380 and beyond, combining structure, gap fill, and liquidity strategy.
