Gold H4 | Rising into a swing-high resistanceGold (XAU/USD) is rising towards a swing-high resistance and could potentially reverse off this level to drop lower.
Sell entry is at 3,336.84 which is a swing-high resistance.
Stop loss is at 3,370.00 which is a level that sits above the 127.2% Fibonacci extension and a swing-high resistance.
Take profit is at 3,289.33 which is a swing-low support.
High Risk Investment Warning
Trading Forex/CFDs on margin carries a high level of risk and may not be suitable for all investors. Leverage can work against you.
Stratos Markets Limited (tradu.com ):
CFDs are complex instruments and come with a high risk of losing money rapidly due to leverage. 63% of retail investor accounts lose money when trading CFDs with this provider. You should consider whether you understand how CFDs work and whether you can afford to take the high risk of losing your money.
Stratos Europe Ltd (tradu.com ):
CFDs are complex instruments and come with a high risk of losing money rapidly due to leverage. 63% of retail investor accounts lose money when trading CFDs with this provider. You should consider whether you understand how CFDs work and whether you can afford to take the high risk of losing your money.
Stratos Global LLC (tradu.com ):
Losses can exceed deposits.
Please be advised that the information presented on TradingView is provided to Tradu (‘Company’, ‘we’) by a third-party provider (‘TFA Global Pte Ltd’). Please be reminded that you are solely responsible for the trading decisions on your account. There is a very high degree of risk involved in trading. Any information and/or content is intended entirely for research, educational and informational purposes only and does not constitute investment or consultation advice or investment strategy. The information is not tailored to the investment needs of any specific person and therefore does not involve a consideration of any of the investment objectives, financial situation or needs of any viewer that may receive it. Kindly also note that past performance is not a reliable indicator of future results. Actual results may differ materially from those anticipated in forward-looking or past performance statements. We assume no liability as to the accuracy or completeness of any of the information and/or content provided herein and the Company cannot be held responsible for any omission, mistake nor for any loss or damage including without limitation to any loss of profit which may arise from reliance on any information supplied by TFA Global Pte Ltd.
The speaker(s) is neither an employee, agent nor representative of Tradu and is therefore acting independently. The opinions given are their own, constitute general market commentary, and do not constitute the opinion or advice of Tradu or any form of personal or investment advice. Tradu neither endorses nor guarantees offerings of third-party speakers, nor is Tradu responsible for the content, veracity or opinions of third-party speakers, presenters or participants.
Commodities

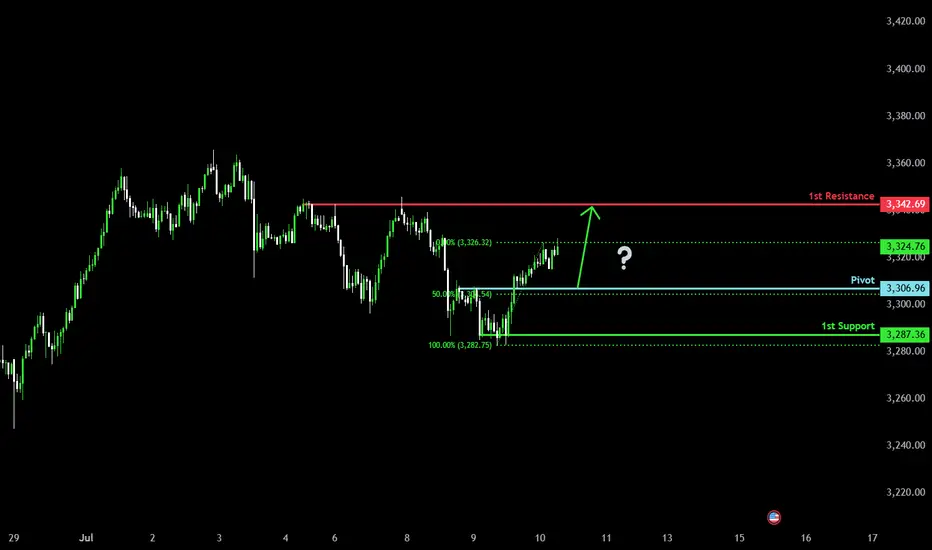
Falling towards 50% Fibonacci supprt?The Gold (XAU/USD) is falling towards the pivot and could bounce to the 1st resistance which is a pullback resistance.
Pivot: 3,306.96
1st Support: 3,287.36
1st Resistance: 3,342.69
Risk Warning:
Trading Forex and CFDs carries a high level of risk to your capital and you should only trade with money you can afford to lose. Trading Forex and CFDs may not be suitable for all investors, so please ensure that you fully understand the risks involved and seek independent advice if necessary.
Disclaimer:
The above opinions given constitute general market commentary, and do not constitute the opinion or advice of IC Markets or any form of personal or investment advice.
Any opinions, news, research, analyses, prices, other information, or links to third-party sites contained on this website are provided on an "as-is" basis, are intended only to be informative, is not an advice nor a recommendation, nor research, or a record of our trading prices, or an offer of, or solicitation for a transaction in any financial instrument and thus should not be treated as such. The information provided does not involve any specific investment objectives, financial situation and needs of any specific person who may receive it. Please be aware, that past performance is not a reliable indicator of future performance and/or results. Past Performance or Forward-looking scenarios based upon the reasonable beliefs of the third-party provider are not a guarantee of future performance. Actual results may differ materially from those anticipated in forward-looking or past performance statements. IC Markets makes no representation or warranty and assumes no liability as to the accuracy or completeness of the information provided, nor any loss arising from any investment based on a recommendation, forecast or any information supplied by any third-party.
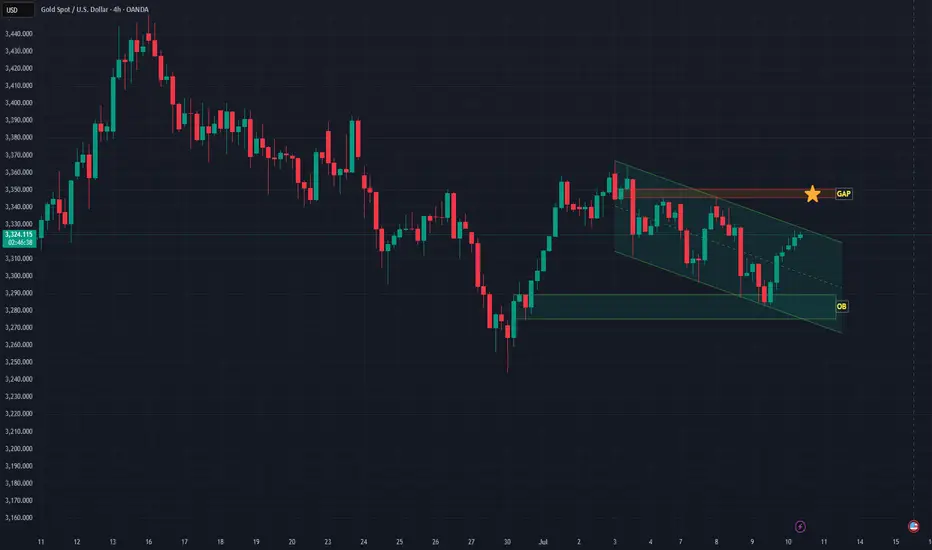
Waiting for the Perfect Entry: XAUUSD Market Structure Breakdown🔍 Taking a look at XAUUSD today: it’s clearly in a downtrend 📉 on the 4H chart, with consecutive lower highs and lower lows 🔽.
📌 My bias is bearish, and I’m patiently waiting for price action to set up for an entry 🎯.
If we get a break of market structure 🧱, followed by a retest and failure of the current range high 🚫, that could present an opportunity 👀 — not financial advice ⚠️.

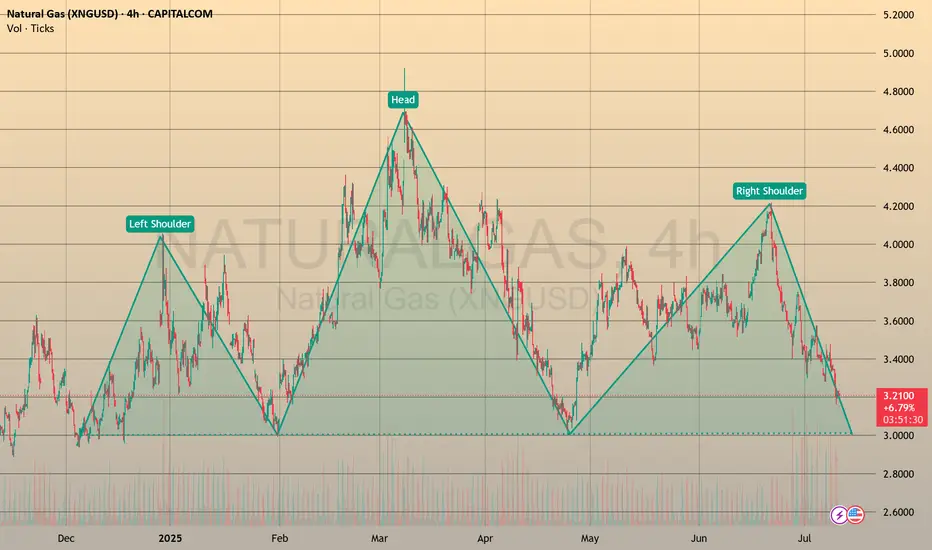
NATURAL GAS formed Head and Shoulders patternCAPITALCOM:NATURALGAS
🔍 From a longer-term perspective, I noticed that a Head and Shoulders pattern 🪖🩻 is about to form. This pattern has been forming since December 2024 and in the long term 🕰️ means no good for those who play long here 📉.
🙋♂️ Personally, I will stay aside for now and observe 👀. The asset may head towards the 3.0000 support level 🪙, where I expect a potential rebound 🔄, possibly even a retest of the trendline from below ↩️.
⏳ In the long term, the asset may even move towards the 2.0000 support level 🚨, but I will need more observation and data to be sure 🧪.
🕊️ Time will show. Thank you for the attention! 🙏
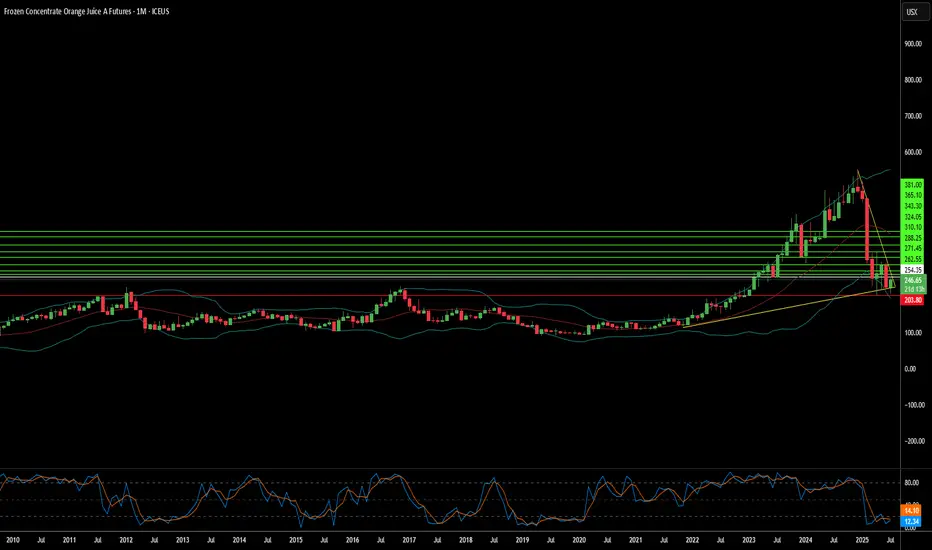
Why Your Orange Juice Costs More?The price of orange juice is surging, impacting consumers and the broader economy. This increase stems from a complex interplay of geopolitical tensions, macroeconomic pressures, and severe environmental challenges. Understanding these multifaceted drivers reveals a volatile global commodity market. Investors and consumers must recognize the interconnected factors that now influence everyday staples, such as orange juice.
Geopolitical shifts significantly contribute to the rising prices of orange juice. The United States recently announced a 50% tariff on all Brazilian imports, effective August 1, 2025. This politically charged move targets Brazil's stance on former President Jair Bolsonaro's prosecution and its growing alignment with BRICS nations. Brazil dominates the global orange juice supply, providing over 80% of the world's trade share and 81% of U.S. orange juice imports between October 2023 and January 2024. The new tariff directly increases import costs, squeezing margins for U.S. importers and creating potential supply shortages.
Beyond tariffs, a convergence of macroeconomic forces and adverse weather conditions amplify price pressures. Higher import costs fuel inflation, potentially compelling central banks to maintain tighter monetary policies. This broader inflationary environment impacts consumer purchasing power. Simultaneously, orange production faces severe threats. Citrus greening disease has devastated groves in both Florida and Brazil. Extreme weather events, including hurricanes and droughts, further reduce global orange yields. These environmental setbacks, coupled with geopolitical tariffs, create a robust bullish outlook for orange juice futures, suggesting continued price appreciation in the near term.
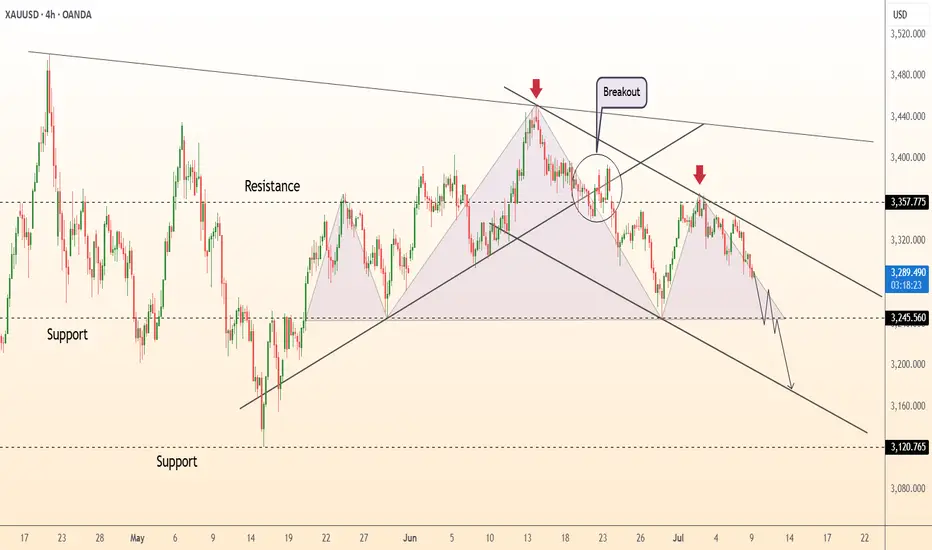
DeGRAM | GOLD forming head and shoulders📊 Technical Analysis
● A double rejection at 3 358—confluence of the May-July descending trend-line and the long-term channel roof—has carved successive lower highs; the break of the inner up-trend (circled) shifts structure bearish.
● Price is now slipping out of a contracting pennant; sustained trade beneath 3 246 (pattern base / April pivot) exposes the mid-channel magnet at 3 202, with the outer rail projecting 3 121.
💡 Fundamental Analysis
● Surprise rise in NY Fed 1-yr inflation expectations and Daly’s “no urgency to cut” remarks lifted 2-yr real yields and the DXY, while ETFs saw a fifth straight day of outflows, signalling fading bullion demand.
✨ Summary
Sell 3 300–3 320; break below 3 246 targets 3 202 → 3 121. Short view void on a 4 h close above 3 358.
-------------------
Share your opinion in the comments and support the idea with a like. Thanks for your support!
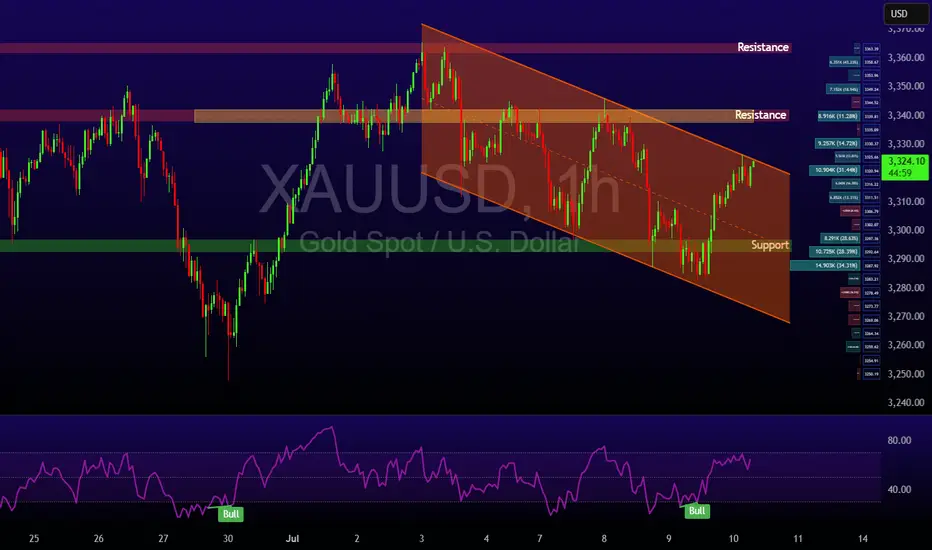
Gold (XAU/USD): Tugged Between Tariffs and Treasury YieldsGold is finding renewed interest from two forces: falling real yields and a cautious Fed. Despite the dollar’s strength, we’re seeing the yellow metal hold above $3,300. Treasury yields are sliding, and global central banks, especially China’s PBOC, are still net buyers of gold. The World Gold Council reported $38 billion in inflows to gold ETFs in the first half of the year, the highest in five years.
Technically, support remains stiff at the 50-day EMA ($3,305), with a ceiling at $3,340. If broken, $3,360 - $3,400 comes back into play. But failure to hold above $3,300 opens downside risk to $3,246, and possibly $3,185.
Early impulsive action got me active! This was a move I was looking to happen yesterday but got slapped trying. It just rocks out like that some time and you have to wait for the next opportunity. In this move early and looking for it to continue if it can hold well above yesterdays high. Trailing stop with every 50 ticks cause anything can happen turning price around and I dont want to give to much back.

Gold Loses Its Shine – Short-Term Sentiment Turns BearishHello everyone, great to see you again for today’s market chat!
The factors that once made gold appealing — inflation fears, economic uncertainty, and the flight to safety — are gradually fading. As confidence grows that the Fed will maintain high interest rates for an extended period, capital is steadily moving away from gold and into more stable, yield-generating assets.
Across the financial community, there’s growing consensus: gold is no longer a top investment priority. The U.S. dollar is gaining strength, Treasury yields are rising, and gold’s support structure is weakening. While investors await the Fed’s next move, many are staying on the sidelines — or even leaning toward a bearish outlook. Notably, the rebound in the DXY is also playing a key role in adding pressure.
Gold is currently lacking momentum, lacking support, and most of all — lacking conviction. At this stage, the trend is no longer a debate, but a widely accepted short-term reality.
What about you — where do you think gold is headed next?

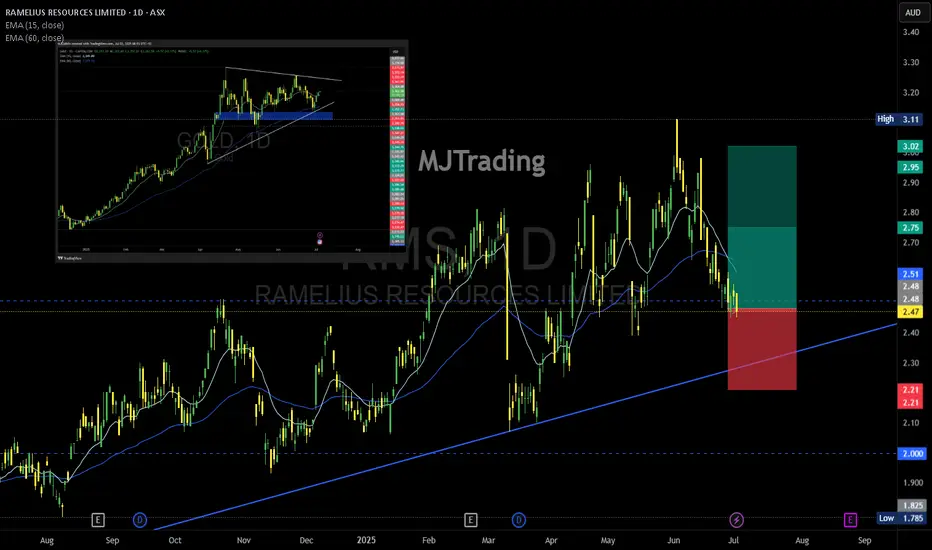
Ramelius Resources (ASX: RMS) –A Tactical Re-Entry Zone?🟡 Gold-Linked Opportunity: Ramelius Resources (ASX: RMS) – A Tactical Re-Entry Zone?
Context: Ramelius Resources, a mid-tier Aussie gold producer, is showing signs of technical exhaustion after a strong rally from its 2024 lows. With gold prices consolidating and RMS pulling back to a key support zone, this could be a tactical opportunity for shareholders and swing traders alike.
📊 Technical Snapshot:
Current Price: $2.47
Trendline Support: The long-term ascending trendline remains intact, offering a potential re-entry zone for bulls.
Risk-Reward Setup: Defined green/red zones highlight a favorable R:R ratio for those targeting a rebound toward $2.80–$3.00.
🪙 Gold Correlation Insight:
The inset chart shows gold (XAU/USD) stabilizing after a volatile June. If gold resumes its uptrend, RMS could follow suit, given its strong correlation with bullion prices.
🧠 Psychological Angle:
After a 40%+ rally from the $1.78 low, some profit-taking is natural. But this pullback may shake out weak hands before a continuation move.
Watch for sentiment shifts around gold and broader risk appetite—these could be catalysts for RMS’s next leg.
#RMS #Gold #ASX #MJTrading #Forex #Trading #Investment
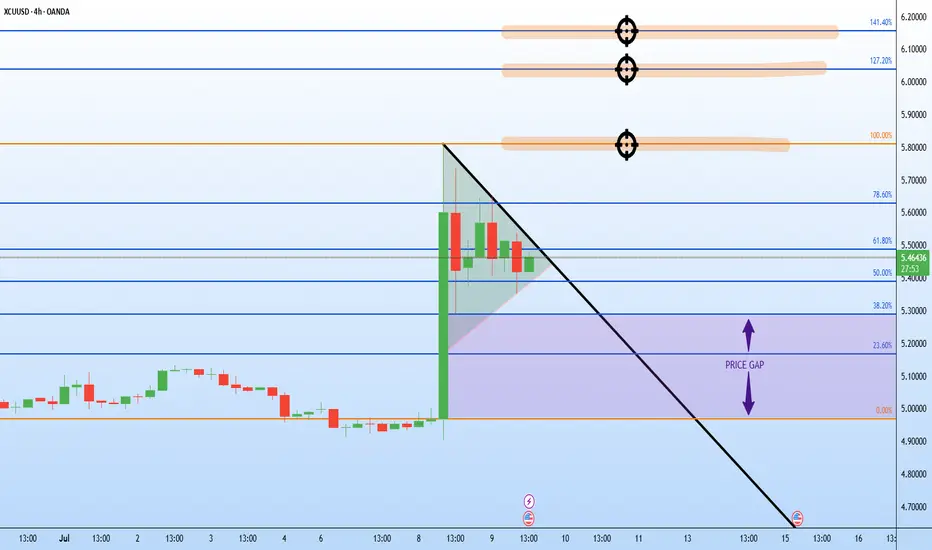
Gap below… but copper’s breakout still in playCopper markets erupted higher this week following President Trump's proposal to impose a 50% tariff on copper imports. The price ripped from just above $5.20 to nearly $5.80 in a single 4-hour candle.
Now, copper could be forming a bullish flag or pennant on the 4-hour timeframe. After the vertical spike, price is consolidating in a tight, potentially downward-sloping channel between ~$5.45 and ~$5.60.
If confirmed with a clean breakout above the flag’s upper trendline - perhaps near $5.62—the next leg could project toward the previous high near $5.80
There’s also a gap below current price action, between $5.20 and $5.35, formed during the explosive move up. While gaps can act as support zones, they also tend to get revisited.
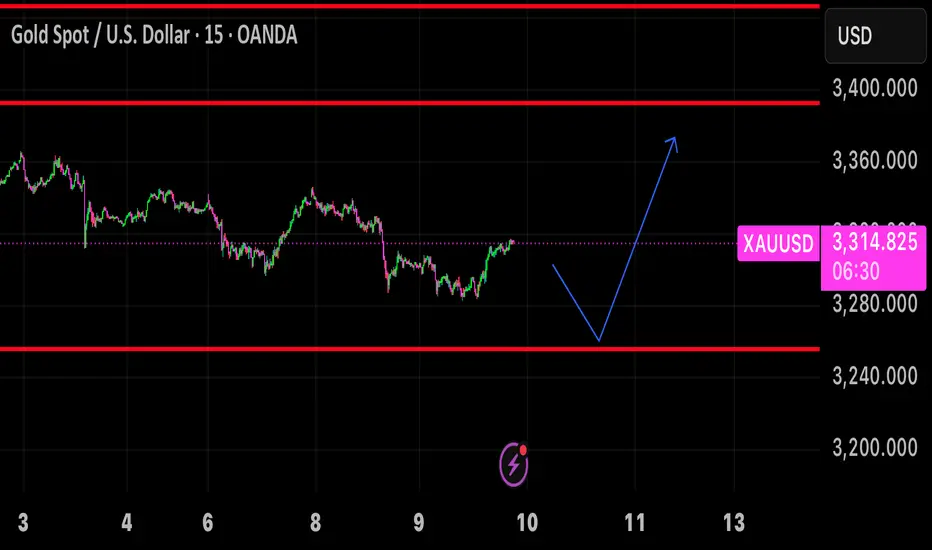
Gold is probably gonna buy from support level back to resistanceAfter gold buys off from support, it’s gonna retest the resistance and finally break out from the support to give a clear down trend.👑
Gold is Nearing The Daily TrendHey Traders, in today's trading session we are monitoring XAUUSD for a buying opportunity around 3,260 zone, Gold is trading in an uptrend and currently is in a correction phase in which it is approaching the trend at 3,260 support and resistance area.
Trade safe, Joe.

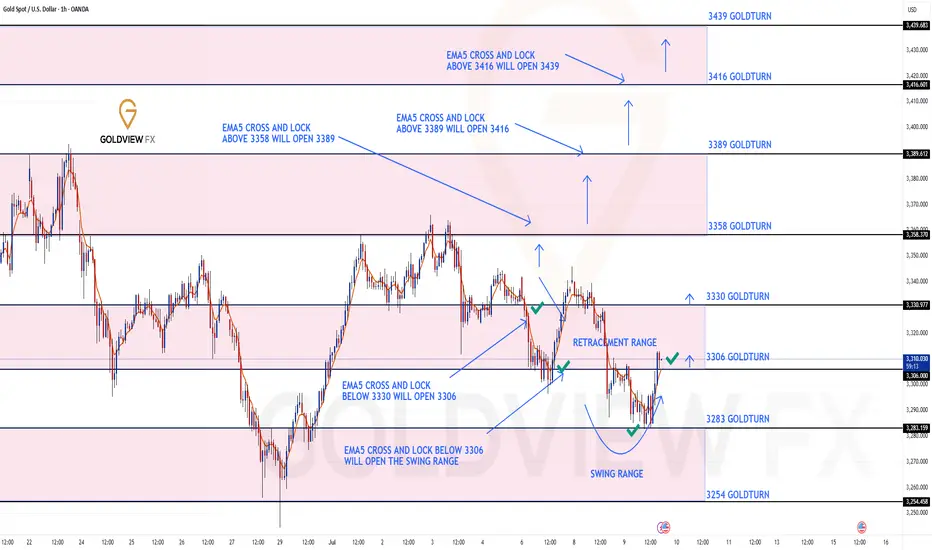
GOLD ROUTE MAP UPDATEHey Everyone,
Absolutely beautiful to see our 1h chart idea playing out perfectly. After completing the bearish targets earlier this week, we had the ema5 cross and lock below 3306 opening the swing range.
- This played out perfectly hitting the first swing range level and doing exactly what it say son the tin giving the full swing into 3306 just like we highlighted.
We will now look for ema5 lock above 3306 for a continuation into the bullish targets above or failure to lock will see rejections into the lower Goldturns for suport and bounce.
If it continues to fail breakout above, into the first Bullish target, then we are likely to see the full swing range tested on the rejections.
We will keep the above in mind when taking buys from dips. Our updated levels and weighted levels will allow us to track the movement down and then catch bounces up.
We will continue to buy dips using our support levels taking 20 to 40 pips. As stated before each of our level structures give 20 to 40 pip bounces, which is enough for a nice entry and exit. If you back test the levels we shared every week for the past 24 months, you can see how effectively they were used to trade with or against short/mid term swings and trends.
The swing range give bigger bounces then our weighted levels that's the difference between weighted levels and swing ranges.
BULLISH TARGET
3358
EMA5 CROSS AND LOCK ABOVE 3358 WILL OPEN THE FOLLOWING BULLISH TARGETS
3389
EMA5 CROSS AND LOCK ABOVE 3389 WILL OPEN THE FOLLOWING BULLISH TARGET
3416
EMA5 CROSS AND LOCK ABOVE 3416 WILL OPEN THE FOLLOWING BULLISH TARGET
3439
BEARISH TARGETS
3330 - DONE
EMA5 CROSS AND LOCK BELOW 3330 WILL OPEN THE FOLLOWING BEARISH TARGET
3306 - DONE
EMA5 CROSS AND LOCK BELOW 3306 WILL OPEN THE SWING RANGE
3283 - DONE
3254
As always, we will keep you all updated with regular updates throughout the week and how we manage the active ideas and setups. Thank you all for your likes, comments and follows, we really appreciate it!
Mr Gold
GoldViewFX
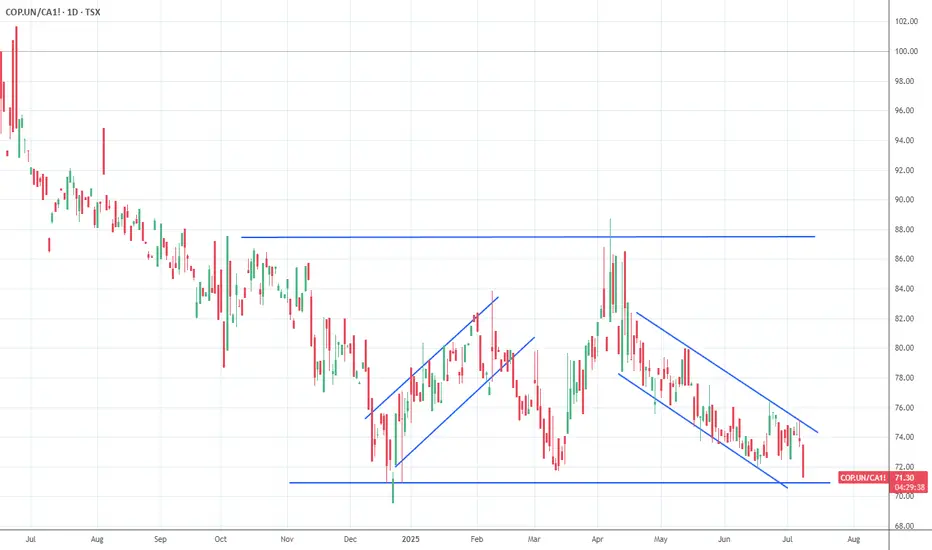
Sprott Copper Arbitrage against LME copper futures, discount 20%Currently COP.UN (traded on TSX, Toronto Stock Exchange) is showing some substantial discount again against NAV. Discount is more than 20% which basically means that you can buy copper on the world markets (LME) with a 20% discount! I expect discount will narrow again in coming weeks and wil go back to minus 10 or even better.
A more detailed description can be find below of all facts and figures.
Current Situation:
Discount to NAV: COP.UN is trading at just over a 20% discount to its net asset value (NAV). Essentially, this means you can buy copper exposure at a significant discount to the current market price.
Copper Storage and Transfers: The trust’s copper is stored in LME-approved warehouses and is increasingly being shipped to COMEX warehouses in the U.S. The reason is straightforward: copper prices on COMEX are currently higher than on the LME. By moving copper to COMEX, Sprott can sell inventory at better prices.
Mechanism for Payouts: The proceeds from selling copper at a premium on COMEX versus the LME can be distributed to unitholders as a special cash distribution (dividend). This provides a direct way for investors to benefit from arbitrage between exchanges.
Redemption Option: Institutional investors can redeem trust units for physical copper, subject to minimum tonnages and fees. This helps keep the trust price connected to physical copper markets and offers an arbitrage route if the discount remains wide.
The Opportunity:
This setup offers trading houses huge opportunities:
Arbitrage Play: Buy COP.UN units at a >20% discount, redeem them for physical copper, and sell the metal at spot prices, pocketing the spread (net of costs).
Dividend Upside: Hold COP.UN units and potentially benefit from future special dividends if Sprott continues moving copper to COMEX and realizing higher sales prices.
Useful Resources:
COP.UN Prospectus (Sprott Physical Copper Trust) cop-prospectus-en.pdf