Gold Price Analysis July 30Gold (XAUUSD) Consolidating in a Triangle Pattern – Preparing for a Big Breakout
Currently, gold is moving within a triangle consolidation pattern, reflecting the market’s indecision as investors await a series of important economic data from the US this week. This hesitation suggests that a breakout from the triangle pattern could trigger a strong FOMO effect, creating a significant price movement in either direction.
The current price action is similar to a “bull flag” or “pennant” pattern, where a breakout could lead to a clearer and more decisive trend. If the support zone in the pattern fails to hold, the possibility of a sell-off is high.
Trading scenario:
🔻 Activate SELL order:
When price breaks the triangle bottom around 3324
Downside target: 3285, further is the strong support zone at 3250
🔺 Activate BUY order:
When price breaks and holds above the resistance zone 3333
Or: when there is a bearish rejection signal and candle confirmation at the area 3385
Commodities

Gold - Powerful RunAfter its powerful run, gold has shown signs of fatigue, stalling near technical resistance between $3,330–$3,350 per ounce in late July. Analysts warn that while the bullish trend remains intact on a structural level, daily volatility is high and some profit-taking or consolidation could continue unless new destabilizing events emerge.
Will the Rally Continue?
The Bull Case
Structural Demand: Multiple sources, including J.P. Morgan and other major forecast groups, predict gold’s structural bull case remains strong with average prices of $3,220–$3,675 per ounce likely through the end of 2025, and even $4,000 possible by 2026.
Ongoing Uncertainty: Persistent geopolitical risks, trade disputes, and fiscal pressures are expected to maintain robust safe haven flows into gold.
Central Bank and Asian Demand: Sustained buying by central banks and consumers in Asia could provide a solid floor below current levels.
The Bear Case
Interest Rate Dynamics: If central banks, especially the US Federal Reserve, hold or increase interest rates, gold could lose momentum, higher rates increase the opportunity cost of holding non yielding bullion.
Diminishing New Risks: Unless fresh economic or geopolitical shocks appear, further upside may be capped in the near term. Several experts predict gold may consolidate or trade sideways pending new catalysts.
Speculator Flows: Rapid speculative bets could lead to sharp corrections, particularly on technical breakdowns after such a strong rally.
Conclusion
The gold rally of 2025 has been driven by an unusual mix of global volatility, central bank behavior, and shifting investor psychology. While prices could pause or pull back in the coming months, the fundamental supports structural demand, central bank buying, and persistent global risks, suggest that the broader gold bull cycle is not yet over, with $3,000+ likely forming the new base for gold as we look toward 2026.
*NOT INVESTMENT ADVICE*
#gold #safehaven #uncertainty #economy #finance #trading #indicator

XAU/USD) Bearish Trend Read The captionSMC Trading point update
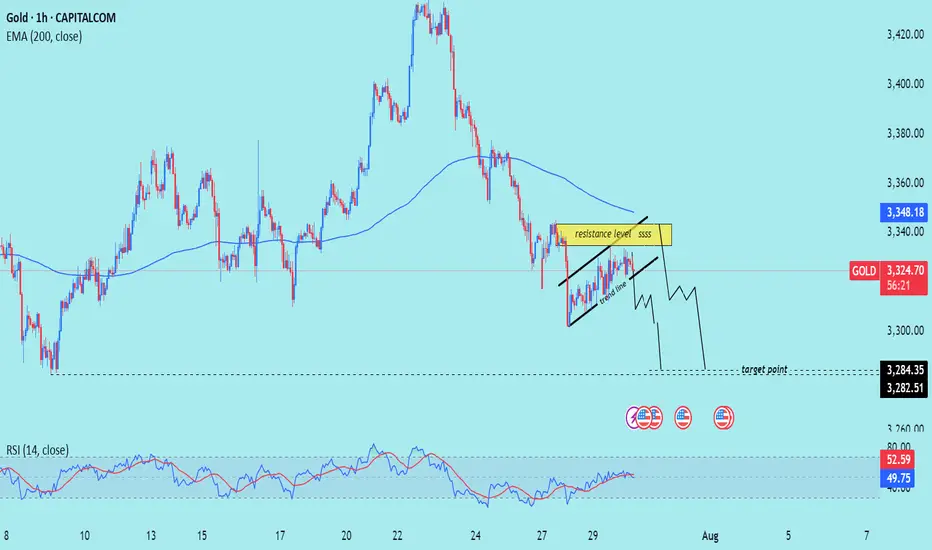
Technical analysis of Gold (XAU/USD) on the 1-hour timeframe, using a combination of trend lines, EMA, RSI, and price structure.
---
Technical Breakdown:
1. Price Structure:
Gold is forming a rising channel (black trend lines) within a short-term uptrend, but this is happening below the 200 EMA, which generally indicates bearish momentum.
A resistance zone is highlighted near the top of the channel, suggesting sellers might defend this level.
2. Key Level:
Resistance Level: Around 3,330–3,335 zone.
Target Point: Price is expected to break down from the channel and reach support levels near 3,284.35 and 3,282.51.
3. Moving Average (EMA 200):
Current price is below the 200 EMA (3,348.42), reinforcing a bearish bias.
4. RSI (14):
RSI is near 52.58, indicating neutral-to-slightly-overbought territory. No strong divergence is visible, but RSI is not confirming a bullish trend either.
5. Projection (Hand-drawn Path):
The drawn path shows a potential breakdown from the channel with a bearish impulse targeting lower support zones.
Mr SMC Trading point
---
Trade Idea Summary:
Bias: Bearish
Confirmation Needed: Break below channel support
Entry Zone: Near the resistance of the rising channel (~3,330–3,335)
Target Zone: 3,284.35 – 3,282.51
Invalidation: Sustained break above 3,348 (above EMA 200)
plesse support boost 🚀 this analysis)
XUA/USD) Bearish Trend Read The captionSMC Trading point update
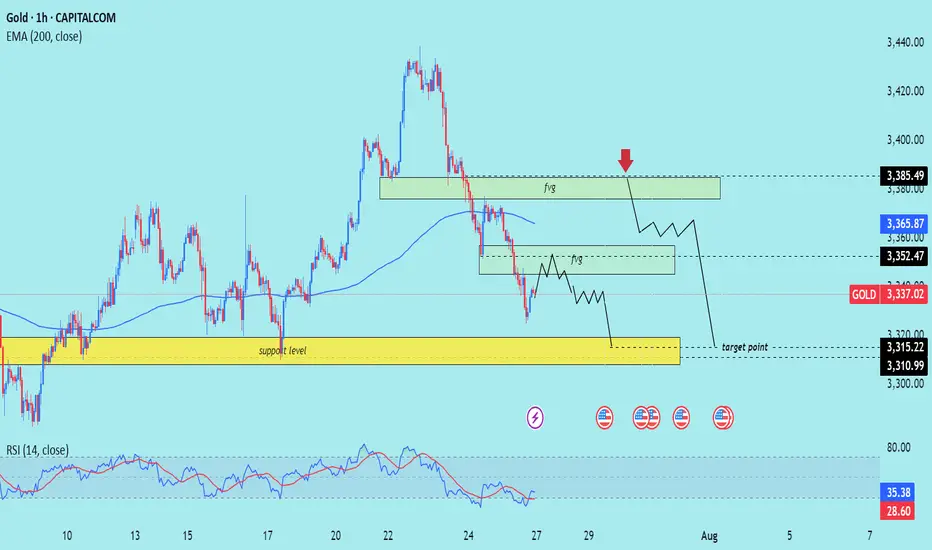
Technical analysis of (XAU/USD) on the 1-hour timeframe, targeting a move toward the $3,310–$3,315 support zone. Here's the full breakdown:
---
Technical Analysis – Gold (1H)
1. Fair Value Gap (FVG) Supply Zones
Two FVG supply zones are marked where price previously dropped sharply:
Upper FVG zone near $3,385.49 (with red arrow: expected rejection point)
Lower FVG zone near $3,352.47
Price is expected to reject from either zone, resuming the bearish move.
2. Market Structure: Lower Highs, Lower Lows
The chart shows a clear bearish structure, with consistent lower highs and lower lows.
The current price action suggests a potential pullback into FVG, followed by another leg down.
3. Key Support Zone (Target Area)
The yellow box between $3,315.22–$3,310.99 represents a strong demand/support zone and is marked as the target point.
This level has acted as a prior accumulation zone and is likely to attract buying interest again.
4. EMA 200 Resistance
Price is trading below the 200 EMA (currently at $3,365.87) — indicating a bearish bias.
EMA also aligns near the lower FVG zone, reinforcing the area as a potential reversal point.
5. RSI Indicator
RSI at 35.38 is nearing oversold territory but still shows downward pressure.
No divergence or reversal signal yet — supports the continuation view.
Mr SMC Trading point
---
Summary
Bias: Bearish
Current Price: $3,337.02
Supply Zones (FVG):
$3,385.49 (stronger supply)
$3,352.47 (minor supply)
Support Target: $3,315.22–$3,310.99
Structure: Bearish (LL-LH formation)
EMA: 200 EMA acting as dynamic resistance
RSI: 35.38 – still bearish momentum
---
Please support boost 🚀 this analysis)
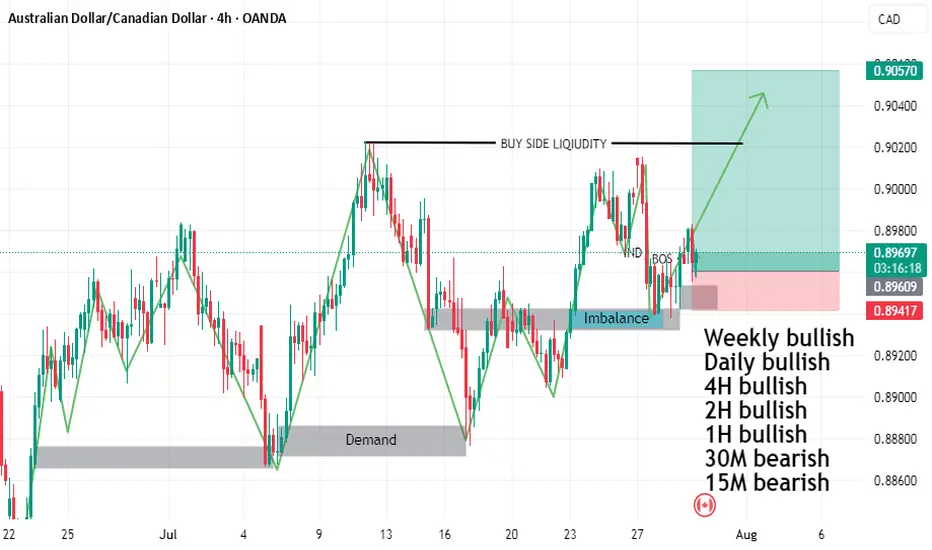
AUDCAD BUY SETUPTHE PRICE FORMED HEAD AND SHOULDER
and do rejection from mitigation order block and imbalance
and we have liquidity on time frame daily buy side liquidity
and time frame weekly double top
so I will buy with you
DON'T forget to follow me so that get more refresh analysis
Gold Channel on 1h chartThis is Gold channel on 1H chart it is showing support and resistance levels. If Gold cross this channel then an strong trend could be possible.

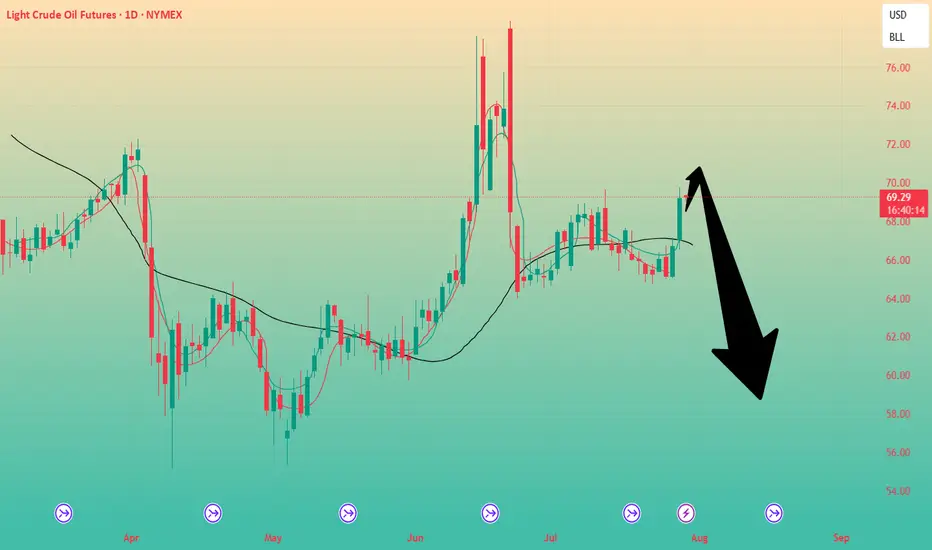
Crude oil: Sell around 70.20, target 65.00-64.00Crude Oil Market Analysis:
Yesterday's crude oil market was very strong, with buying driving the market higher. The daily chart ultimately closed with a clear bullish candlestick. Buying on the daily chart is testing the resistance level between 70.00 and 70.60. After two consecutive days of bullish closes, and with clear bullish candlesticks, I predict another surge today. Let's look at the daily chart. The daily chart shows a significant rebound after a significant drop. Today, focus on selling opportunities between 70.00 and 70.60. A break of this level will change the overall selling trend. The strategy remains to sell high and be bearish.
Fundamental Analysis:
Today, focus on the ADP employment data and the EIA crude oil inventory data. The key news will be the interest rate results during the US trading session, along with speeches.
Trading Recommendations:
Crude oil: Sell around 70.20, target 65.00-64.00
XAUUSD M45 Outlook XAUUSD
Liquidity grabbed ✅
Break of Structure & ChoCh confirmed ✅
Price taps into premium OB zone 🧠
Entry from refined supply zone 🎯
Risk:Reward 🔥
SL: 3348
TP: 3290
If this plays out, it's textbook Smart Money 👑
Risk managed. Emotions off. Let the market speak.

Gold Contract Rolled!Now that the contract rolled We might get a bit more movement. Yesterday was nothing but a giant flag. I want to see price go sweep levels before turning full on bullish. We must keep in mind that we are at the end of the month as well. so price can end up stalling till next week. but tomorrow there is a lot of News pending. So that can really shake things up.


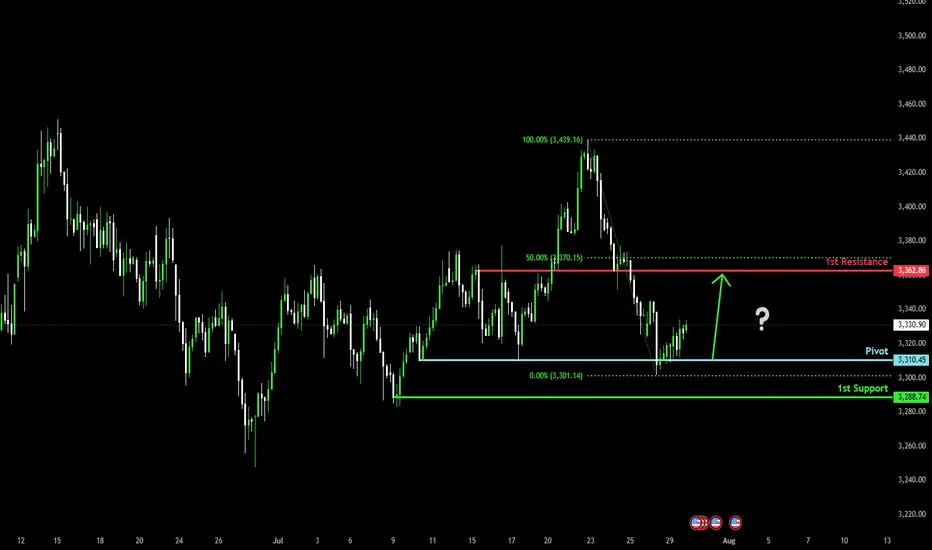
Bullish bounce off?The Gold (XAU/USD) has bounced off the pivot, which acts as a multi-swing low support and could rise to the 1st resistance, which is slightly below the 50% Fibonacci retracement.
Pivot: 3,310.45
1st Support: 3,288.74
1st Resistance: 3,362.86
Risk Warning:
Trading Forex and CFDs carries a high level of risk to your capital and you should only trade with money you can afford to lose. Trading Forex and CFDs may not be suitable for all investors, so please ensure that you fully understand the risks involved and seek independent advice if necessary.
Disclaimer:
The above opinions given constitute general market commentary, and do not constitute the opinion or advice of IC Markets or any form of personal or investment advice.
Any opinions, news, research, analyses, prices, other information, or links to third-party sites contained on this website are provided on an "as-is" basis, are intended only to be informative, is not an advice nor a recommendation, nor research, or a record of our trading prices, or an offer of, or solicitation for a transaction in any financial instrument and thus should not be treated as such. The information provided does not involve any specific investment objectives, financial situation and needs of any specific person who may receive it. Please be aware, that past performance is not a reliable indicator of future performance and/or results. Past Performance or Forward-looking scenarios based upon the reasonable beliefs of the third-party provider are not a guarantee of future performance. Actual results may differ materially from those anticipated in forward-looking or past performance statements. IC Markets makes no representation or warranty and assumes no liability as to the accuracy or completeness of the information provided, nor any loss arising from any investment based on a recommendation, forecast or any information supplied by any third-party.
Crude oil starts to rise, are you ready?
💡Message Strategy
Oil prices continued their upward trend amid rising geopolitical risks. US President Trump recently issued a tough statement, demanding Russia end the conflict with Ukraine within 10 to 12 days or face secondary sanctions.
Fears that Russian crude oil exports might be disrupted pushed Brent crude oil prices close to $70 per barrel, marking their largest single-day gain in two weeks at 2.3%. Meanwhile, US West Texas Intermediate (WTI) crude oil prices also remained stable around $67.
The intertwined uncertainties of geopolitics and trade policy have complicated market sentiment. Besides the situation between Russia and Ukraine, investors are closely watching the August 1st trade policy deadline set by the United States and the upcoming OPEC+ meeting in early August, which will determine its September crude oil production increase plan.
The industry generally expects that despite tight crude oil inventories in some parts of the world and strong peak season consumption in the Northern Hemisphere, if OPEC+ continues to increase production, oversupply pressure will gradually emerge by the end of the year.
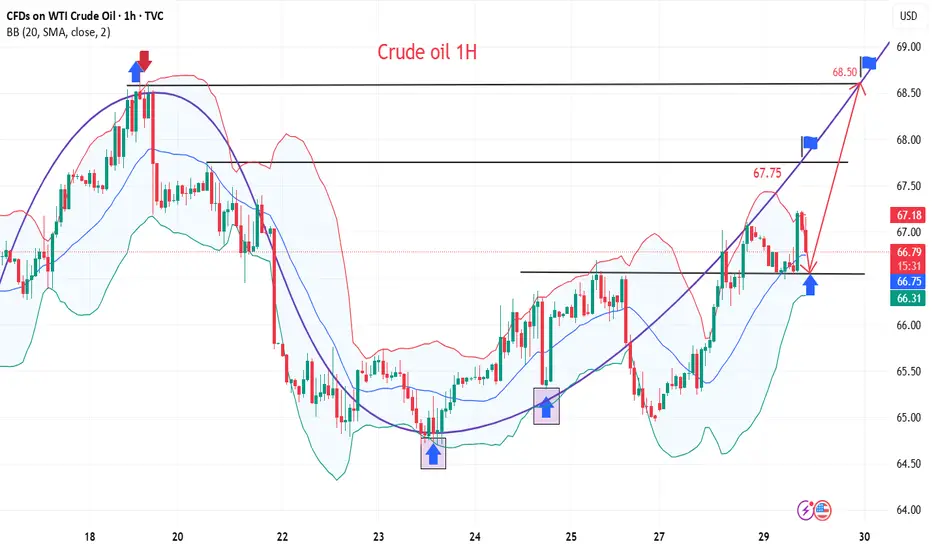
📊Technical aspects
From a technical perspective, the daily chart of US crude oil (WTI) shows a modest upward trend. The current price is trading steadily above its 100-day moving average, indicating continued bullish momentum.
The Relative Strength Index (RSI) remains between 55 and 60, remaining within overbought territory, suggesting further upside potential. A successful break above the key resistance level of $68.50 would open up opportunities towards $70.
💰Strategy Package
Long Position:66.50-67.00,SL:65.50,Target:68.50-69.00
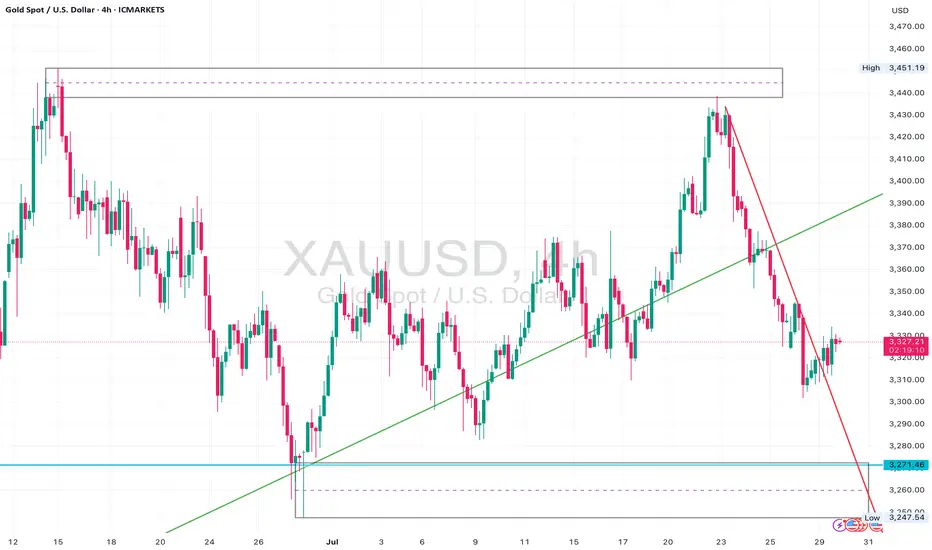
Gold Bear Flag Forming After Trendline Break – Short Setup BelowGold (XAUUSD) recently broke a major ascending trendline that had held since late June, leading to an aggressive sell-off from the $3,440s down to the $3,270 zone.
Following that, price is now consolidating just beneath the previous support trendline, forming what appears to be a bear flag or rising channel inside a corrective structure.
The $3,330–$3,340 zone is now acting as resistance, and price is struggling to close above this level.
The current structure suggests continuation to the downside, with clean space to revisit the $3,271 liquidity pool and potentially even sweep that low.
Watch for bearish confirmation below the current flag – especially if price prints a rejection wick or engulfing candle at the upper edge of the box.
⸻
Key Levels:
• Resistance: $3,330 – $3,340 (flag top + previous support turned resistance)
• Support: $3,271 zone, followed by $3,248 sweep potential
⸻
Trigger Criteria:
• Bearish rejection inside the flag (e.g. pin bar or engulfing)
• Break and retest of the flag bottom or horizontal support
⸻
Risk Note:
A clean break back above $3,350 and reclaim of the previous trendline would invalidate this idea short term and shift bias back to neutral/bullish.
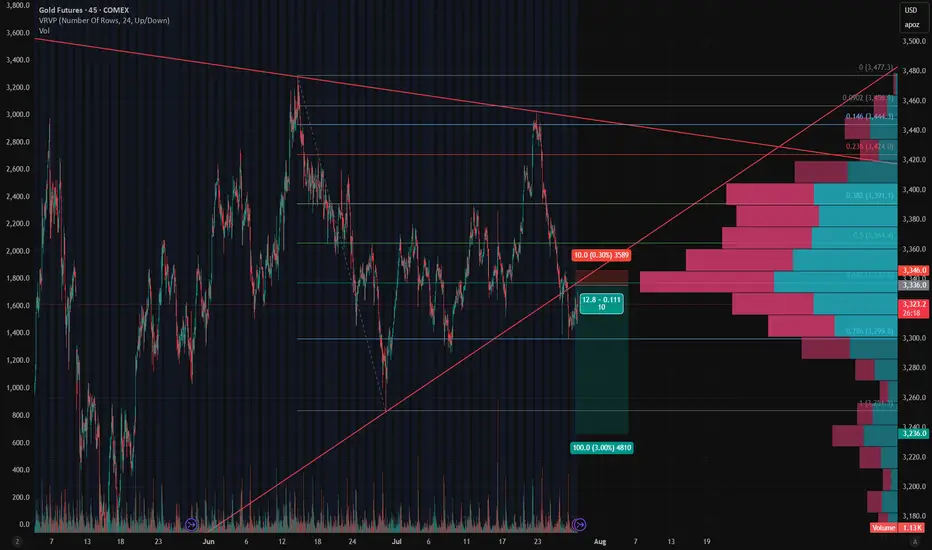
Gold - Short Setup Off Major Trendline Rejection📉 Gold - Short Setup Off Major Trendline Rejection
Gold has broken down through the rising trendline and is now retesting it — the moment of truth! 🧐
🔻 Short Entry: 3,336
🎯 Target: 3,236 (Fib 1.0 + HVN gap fill)
🛑 Stop: 3,346 (Above trendline retest)
⚖️ Risk/Reward: ~1:10
📊 Bonus: High volume node above adds resistance. Bearish volume profile structure confirms the breakdown bias.
Watching for volume to pick up on the move down. Let's see if GC bleeds into August. 🩸📆
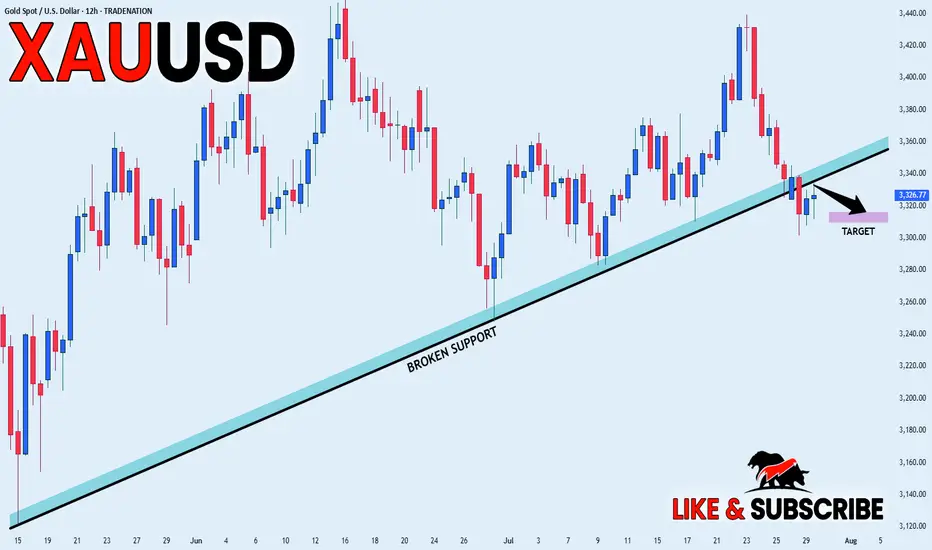
GOLD BEARISH BIAS|SHORT|
✅GOLD broke the rising
Support line which is now
A resistance and the price
Is retesting the line now so
We are locally bearish biased
And we will be expecting a
Local move down
SHORT🔥
✅Like and subscribe to never miss a new idea!✅
Disclosure: I am part of Trade Nation's Influencer program and receive a monthly fee for using their TradingView charts in my analysis.
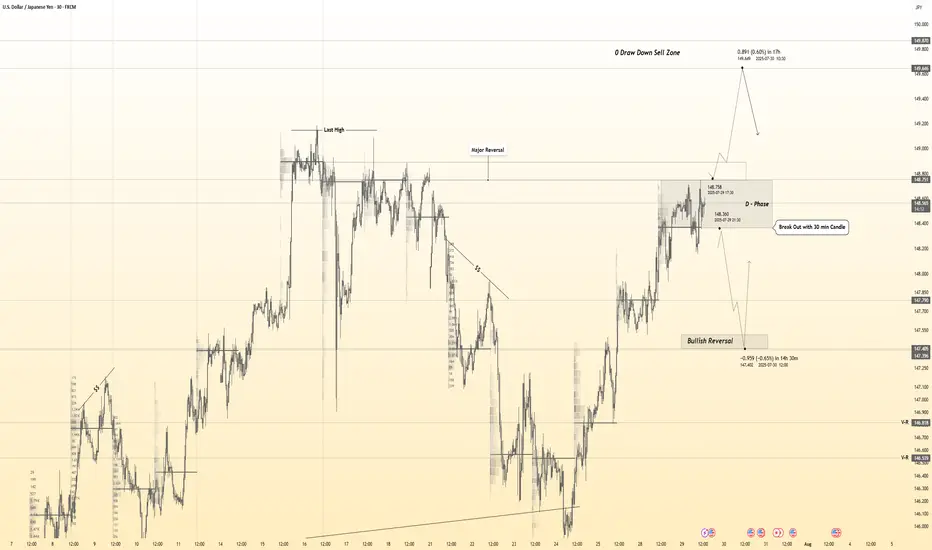
USDJPY 30Min Engaged ( BULLISH & Bearish Break Entry Detected )Time Frame: 30-Minute Warfare
Entry Protocol: Only after volume-verified breakout
🩸Bullish Break- 148.750
🩸Bearish Break- 148.370
➗ Hanzo Protocol: Volume-Tiered Entry Authority
➕ Zone Activated: Dynamic market pressure detected.
The level isn’t just price — it’s a memory of where they moved size.
Volume is rising beneath the surface — not noise, but preparation.
🔥 Tactical Note:
We wait for the energy signature — when volume betrays intention.
The trap gets set. The weak follow. We execute.
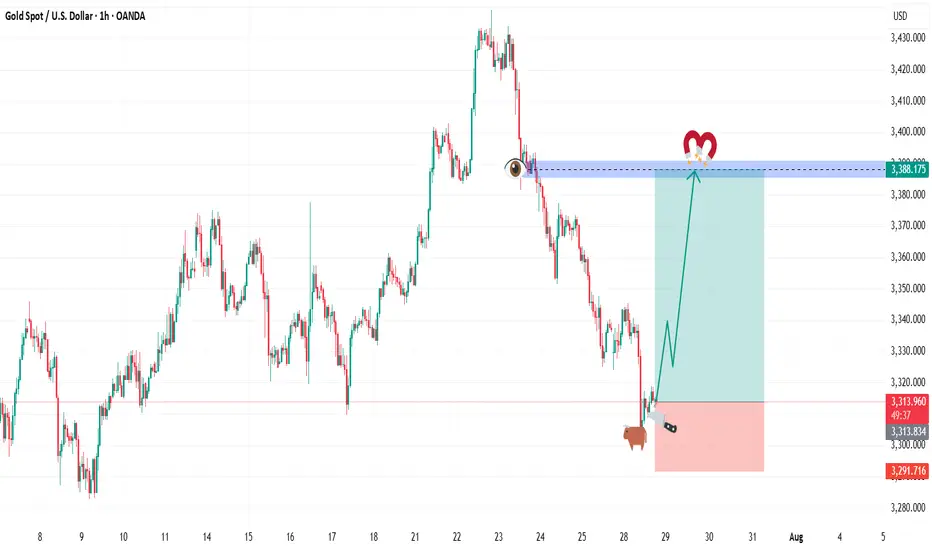
BUY GOLDIn todays session we are monitoring GOLD for buy opportunities. We have out entry at 3313.600 and stops below 3291 our target is at 3388.175 and higher. Use proper risk management. Cheers to you all.
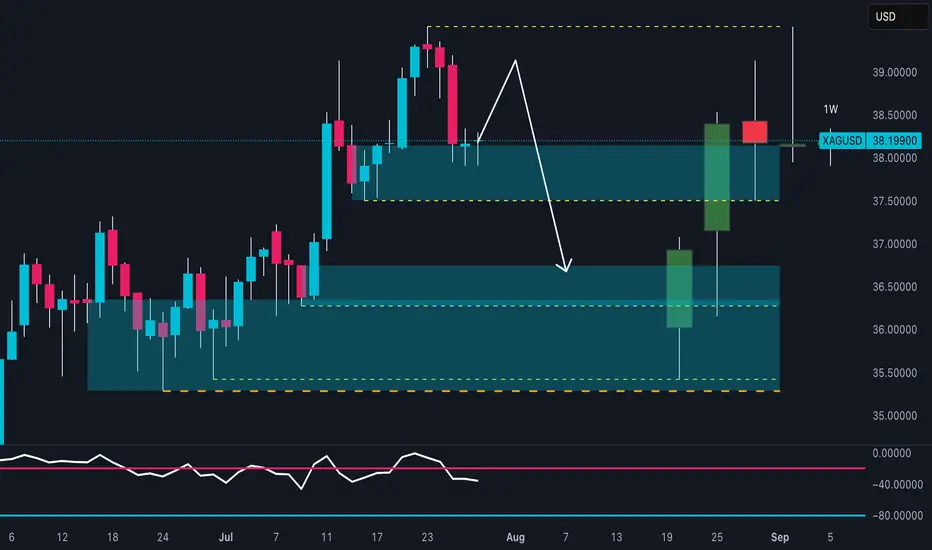
SILVER Is About to Collapse? Watch This Critical Supply Zone!Price recently tapped a high near 39.20 before sharply rejecting from the 38.80–39.20 supply zone, confirming strong selling pressure. The current structure shows:
- Supply zone tested and rejected
- Likely return to the previous demand zone (36.50–36.00)
- RSI is turning down, confirming loss of momentum
A pullback toward 38.30–38.50, followed by a bearish continuation toward the 36.50 area, which acts as a key structural and institutional support.
🗓️ Seasonality
Historically, July is bullish for silver:
Last 5Y average: +0.89%
Last 2Y average: +2.18%
However, August–September are bearish months:
August: mildly positive, but weak
September: consistently negative across all time frames (-0.86% to -1.10%)
This increases the probability of a downward move starting in early August, in line with current price action rejection.
🪙 Commitment of Traders (COT) – July 22
Non-Commercials (speculators):
Longs: +656
Shorts: -516
Commercials (hedging):
Longs: +1,337
Shorts: +916
➡️ Commercials are increasing both long and short exposure, while non-commercials remain net long — a sign of moderate optimism.
However, long positioning is slowing down compared to previous weeks. A potential exhaustion in bullish momentum is forming.
📉 Sentiment
52% short vs 48% long
Volume: more lots on the short side (492 vs 454)
Sentiment remains neutral to slightly contrarian bullish, but not extreme. This may allow for a fake breakout before a deeper move down.
🧩 Operational Summary
Main bias: Bearish short to mid-term (starting August), supported by:
- Technical rejection at supply
- Negative seasonal tendencies ahead
- RSI showing momentum loss
- COT showing stabilization, not accumulation
Crude Oil Spikes - Russia / Ukraine / USA sanction? Concerns about the possibility of tighter global oil supplies are supporting crude prices after President Trump warned of "secondary sanctions" if Russia fails to reach a ceasefire in Ukraine within 10 to 12 days.
These sanctions have absolutely burned the shorts in oil and can cause a 3 bar surge on the daily chart if crude breaks this channel.
Keep you eye on the daily 200 MA...if it holds above we should push higher on crude.
FOMC RATE DECISION TOMORROW - Tune into our live stream.

Oil Market Sentiment Shifts After Trump’s Urgent Warning, but...On June 23, 2025, at 9:35 AM, President Donald J. Trump issued a stark warning via social media:
"EVERYONE, KEEP OIL PRICES DOWN. I’M WATCHING! YOU’RE PLAYING RIGHT INTO THE HANDS OF THE ENEMY. DON’T DO IT!"
Since his post, oil prices experienced a notable bullish impulse. From both fundamental and technical perspectives, the market is now approaching a 16-hour supply zone, which could serve as a potential resistance area.
Additionally, I’ve observed a divergence in trader positioning: non-commercial traders increased their short positions significantly last week, while retail traders remain long. This divergence between price action and non-commercial positions suggests a possible shift in momentum, and I am currently eyeing a short setup.
As always, I encourage traders to conduct their own analysis. The trader featured below operates on the D1 timeframe and focuses on scalping, which can be useful for short-term entries.
Stay cautious and keep an eye on how the market reacts near the identified supply zone.
✅ Please share your thoughts about CL1! in the comments section below and HIT LIKE if you appreciate my analysis. Don't forget to FOLLOW ME; you will help us a lot with this small contribution.

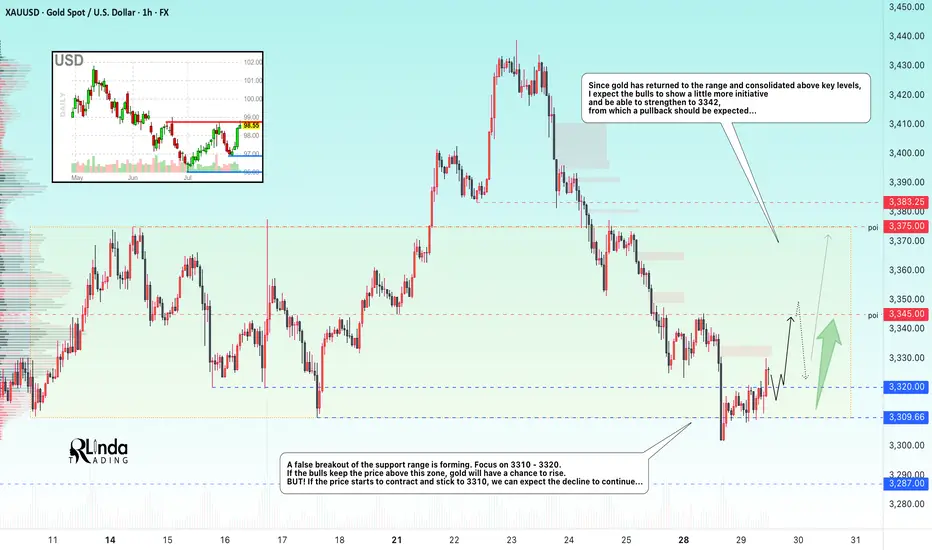
GOLD → Formation of a trading range. 3345?FX:XAUUSD confirms support for the local range. A false breakdown has formed and the price has returned to the buying zone. We are waiting for the bulls to take the initiative...
Gold is trying to recover after falling to $3302, remaining under pressure ahead of key events in the US: the publication of GDP data and the Fed's decision on interest rates. Support is provided by a pause in the dollar's growth, expectations of an extension of the US-China trade truce, and growing demand for safe-haven assets amid a surge in oil prices due to the threat of new sanctions against Russia. However, the sustainability of growth is in question: the dollar may strengthen thanks to optimism about the US economy and progress in negotiations.
A false breakdown of the support range is forming. Focus on 3310-3320. If the bulls keep the price above this zone, gold will have a chance to grow. BUT! If the price starts to contract and stick to 3310, we can expect the decline to continue...
Resistance levels: 3345, 3375
Support levels: 3320, 3310, 3287
The two-day movement has most likely exhausted its potential, or the market has decided to recover slightly due to the unpredictability factor. A false breakdown of support could trigger a pullback to the strong level of 3345, from which a rebound could form (either before growth or before the continuation of the decline; it is necessary to monitor the reaction and the market background...).
Best regards, R. Linda!
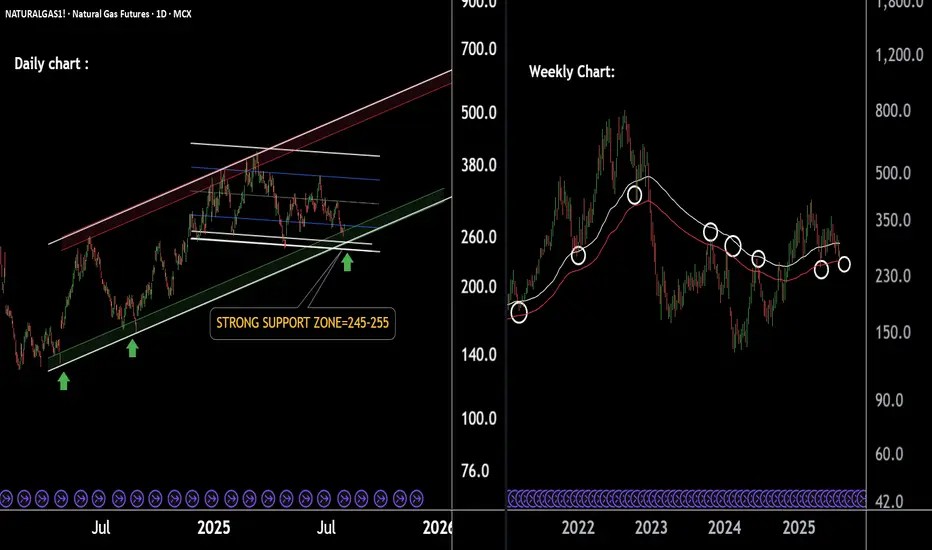
Natural Gas Cooling Near Support Zone – Bounce Ahead!Natural Gas Technical Overview (2-Chart Analysis):
Chart 1 – Parallel Channel Formation:
Natural Gas is moving within a well-defined parallel channel.
The lower support boundary of this channel is observed near 250, indicating a potential bounce zone.
Chart 2 – EMA-Based Support Structure:
Price is currently sustaining above key EMAs, reflecting short-term strength.
The last EMA support lies around 252, acting as an additional support confluence.
If this level is sustain then we may see higher prices in Natural gas futures.
Thank you !!
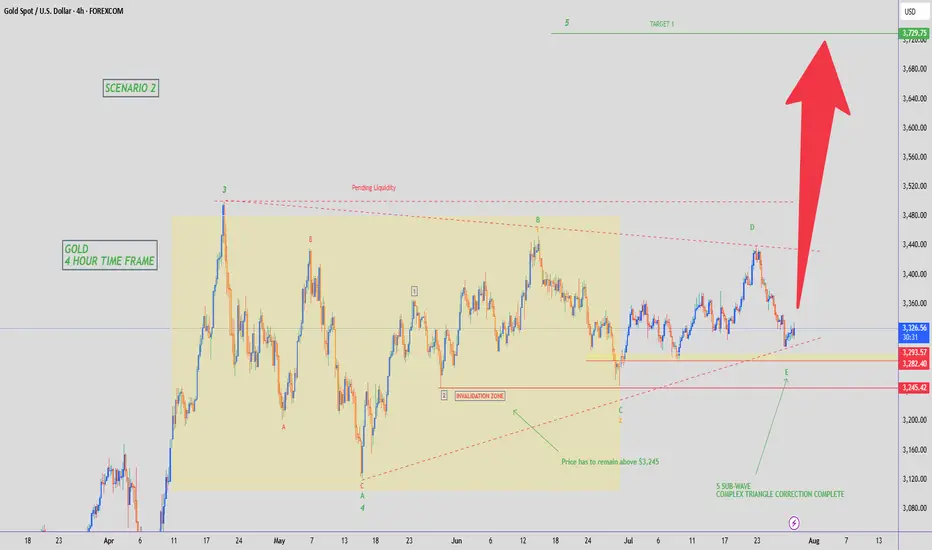
GOLD - WAVE 5 BULLISH TO $3,734 (UPDATE)Quick & simple ‘Elliott Wave Theory’ analysis for our Gold ALTERNATIVE SCENARIO.
⭕️Complex 5 Sub-Wave Correction.
⭕️Buyers Remain Above $3,245.
⭕️Pending LQ at $3,500.