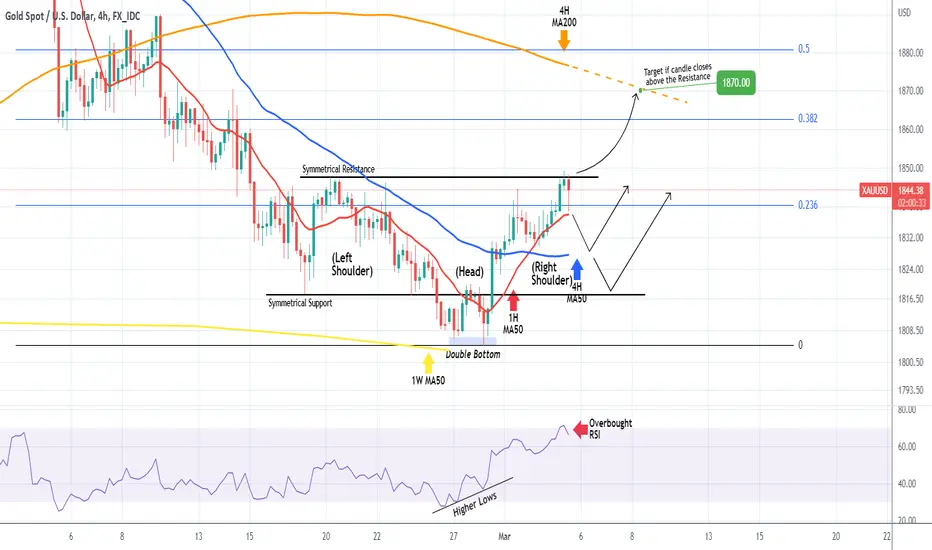
XAUUSD Battling to stay bullish on this Resistance. $1870 eyed.We are updating on our view earlier this week:
Gold (XAUUSD) hit and got rejected today on the 1847.50 Symmetrical Resistance (February 20 High) as the 4H RSI turned overbought. Assuming the bottom reversal pattern is an Inverse Head and Shoulders (IH&S), we need a candle closing above the Symmetrical Resistance in order to extend buying towards the 4H MA200 (orange trend-line) and our 1870 medium-term target.
If instead it closes below the 1H MA50 (red trend-line) we expect to see a pull-back first to the 4H MA50 (blue trend-line) and if closed below then the 1817.50 Symmetrical Support before rebounding.
-------------------------------------------------------------------------------
** Please LIKE 👍, FOLLOW ✅, SHARE 🙌 and COMMENT ✍ if you enjoy this idea! Also share your ideas and charts in the comments section below! **
-------------------------------------------------------------------------------
💸💸💸💸💸💸
👇 👇 👇 👇 👇 👇
Commoditysignals
XAUUSD closed above the 4H MA50, first time since Feb 02!Gold (XAUUSD) is having the first major bullish break-out since it started its aggressive collapse on the February 02 top, as it closed a 4H candle today above the 4H MA50 (blue trend-line) for the first time since the top!
By doing so it also broke above the Falling Wedge pattern of the past two weeks and with the 4H RSI on Higher Lows (i.e. a Bullish Divergence), and this is a legitimate bullish reversal formation.
As the 1W MA50 (yellow trend-line) formed the bottom, it is advised to buy initially the pull-backs to the 1H MA50 (red trend-line) and target the upper Fibonacci levels systematically. We will do this until the price approached the 4H MA200 (orange trend-line), potentially within the 0.382 - 0.5 Fib Zone and then re-evaluate.
-------------------------------------------------------------------------------
** Please LIKE 👍, FOLLOW ✅, SHARE 🙌 and COMMENT ✍ if you enjoy this idea! Also share your ideas and charts in the comments section below! **
-------------------------------------------------------------------------------
💸💸💸💸💸💸
👇 👇 👇 👇 👇 👇

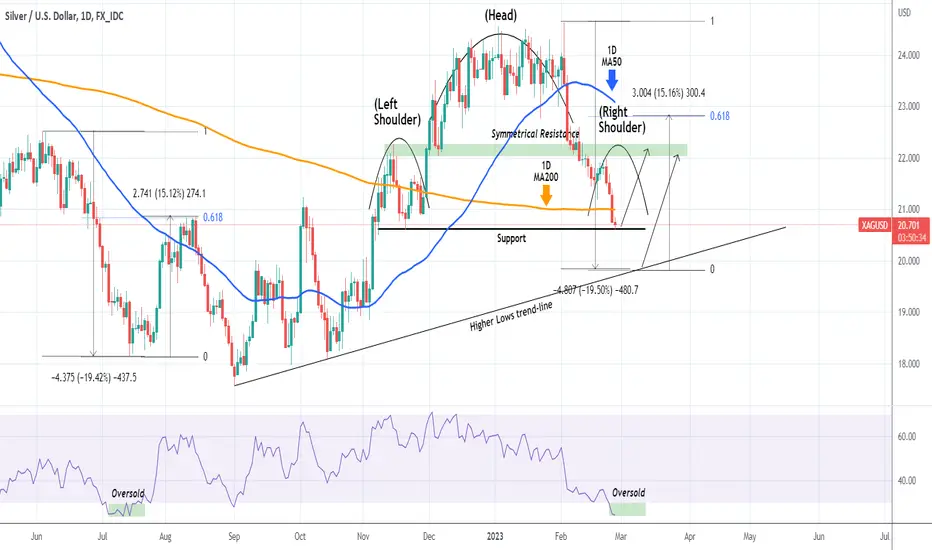
XAGUSD Our great masterplan continues to work to perfection.Since early last year, we have been following a certain buy low/ sell high approach on Silver (XAGUSD) after we identified that it has been trading inside a 2-year Channel Down:
We most recently turned bearish again on precisely the right time on our previous January 31 sell call:
Right now however, with the price having broken on Friday below the 1D MA200 (orange trend-line) for the first time since November 30, it hit the 20.625 Support formed by the November 21 Low. This is potentially the formation of the Right Shoulder of a giant Head and Shoulders (H&S) pattern. With the 1D RSI deep below the oversold barrier, this is were we will attempt our first medium term buy targeting the (green) Symmetrical Resistance Zone and the 1D MA50 (blue trend-line), any of the two gets hit first.
We will attempt an additional buy entry near the Higher Lows trend-line (holding since the September 01 Low), as this would complete a -19.50% decline, similar to the June 06 - July 14 pattern. Its target was a +15.10% rise to the 0.618 Fibonacci, but again we will settle for just the (green) Symmetrical Resistance Zone and the 1D MA50 as targets.
-------------------------------------------------------------------------------
** Please LIKE 👍, FOLLOW ✅, SHARE 🙌 and COMMENT ✍ if you enjoy this idea! Also share your ideas and charts in the comments section below! **
-------------------------------------------------------------------------------
💸💸💸💸💸💸
👇 👇 👇 👇 👇 👇
WTI OIL Two break-out buy signals11 days ago we took the best possible sell entry we could have as we shorted the exact top, calling for the best sell opportunity since December:
Right now the price is on a strong rebound, slightly higher than Support 1 (73.25) but with the 1D RSI on a confirmed reversal within its range. If you missed the bottom buy opportunity, wait for a 4H candle closing above the 4H MA50 (blue trend-line) as this was a confirmed buy opportunity on all previous three occasions (circles). First target at 78.50 and if the price closes above the Lower Highs (dashed) trend-line, we will re-buy targeting 80.00.
-------------------------------------------------------------------------------
** Please LIKE 👍, FOLLOW ✅, SHARE 🙌 and COMMENT ✍ if you enjoy this idea! Also share your ideas and charts in the comments section below! **
-------------------------------------------------------------------------------
💸💸💸💸💸💸
👇 👇 👇 👇 👇 👇

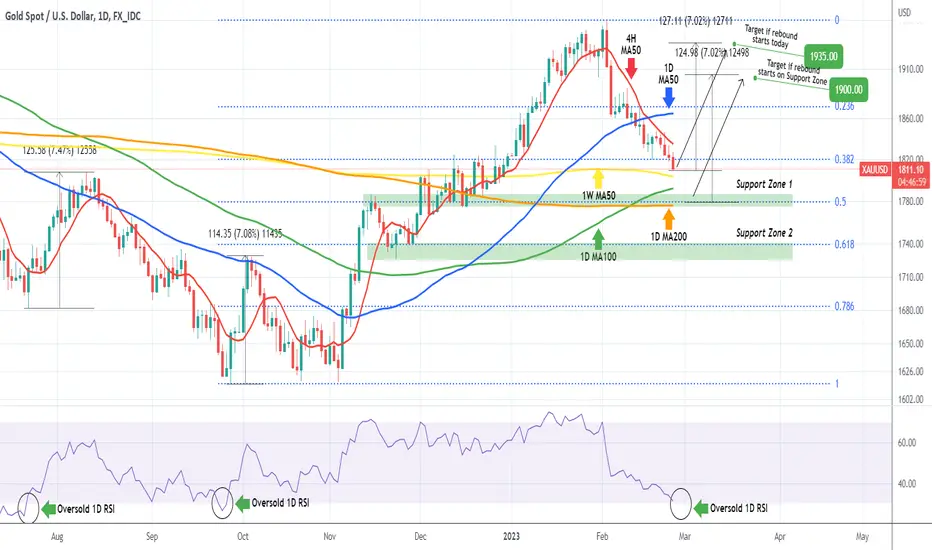
XAUUSD Major Support Cluster approaching. Strong buy.Gold (XAUUSD) is about to test the 1W MA50 (yellow trend-line) after breaking the 0.382 Fibonacci retracement level. Following the sell signal we gave last week, with the 4H MA50 (red trend-line) as Resistance/ entry point, we are starting to turn bullish on Gold after a long time.
The 1D RSI is very close to the 30.000 oversold barrier and that is our first buy entry. The last two times the 1D RSI breached that oversold territory, Gold rallied by +7.08% and +7.47% respectively, reaching the 1D MA50 (blue trend-line) on both occasions. If the 1W MA50 breaks, our second buy entry will be on the huge Support Cluster consisting of the 1D MA100 (green trend-line), the 1D MA200 (orange trend-line), the 0.5 Fibonacci retracement level and Support Zone 1.
On the short term we are targeting the 1D MA50. If we close a candle above it, we will re-buy and target 1935 (if the low is in today) or 1900 (if the rebound starts lower). In both cases this represents a +7.00% rise.
-------------------------------------------------------------------------------
** Please LIKE 👍, FOLLOW ✅, SHARE 🙌 and COMMENT ✍ if you enjoy this idea! Also share your ideas and charts in the comments section below! **
-------------------------------------------------------------------------------
💸💸💸💸💸💸
👇 👇 👇 👇 👇 👇
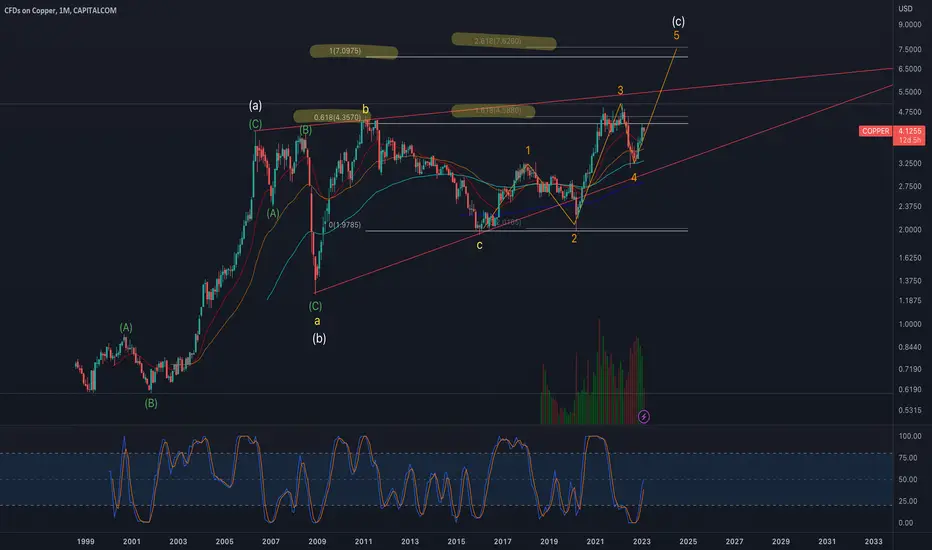
CopperCopper looking to start the 5th wave of the C wave of the super cycle degree here IMO. Should hit around $7.50
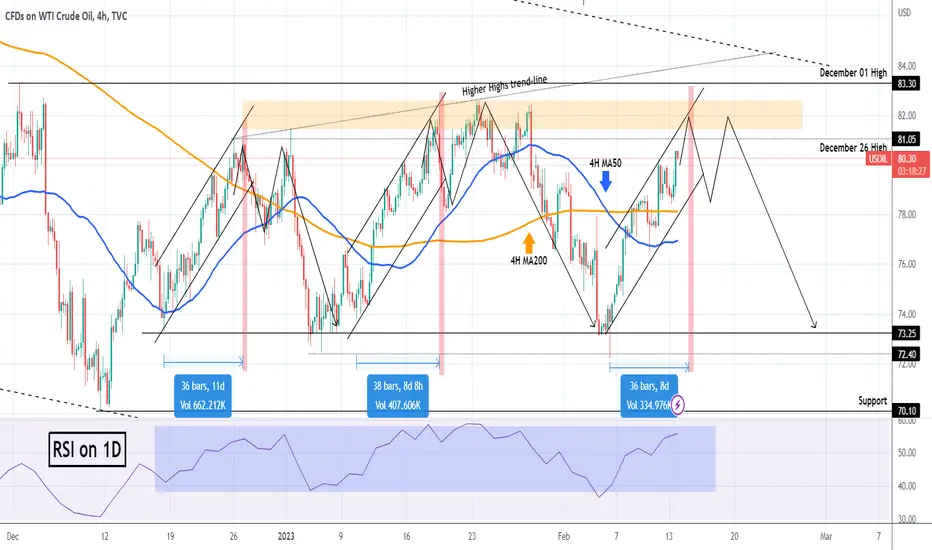
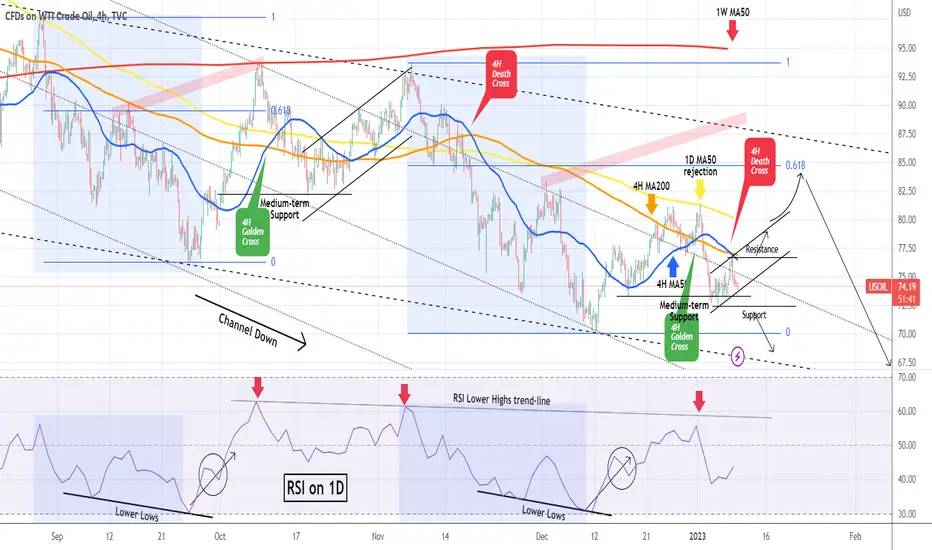
WTI OIL Approaching the best sell entry since December.WTI Oil (USOIL) has been rising within the short-term Channel Up as presented on our analysis last week:
As previously mentioned, since December 12, WTI hasn't closed below the 72.40 Support or above the 83.30 Resistance. That keeps the price ranged and recurring patterns emerge. One of those is the current Channel Up which is quite similar to the Channel Up patterns of December 16 - 27 and January 05 - 18.
This is what helped us take the buy last week above the 4H MA200 (orange trend-line), while the 4H MA50 (blue trend-line) gave a boost on February 09. The price is now approaching the orange Resistance Zone and technically a price near 81.50 is a Sell despite the presence of a Higher Highs trend-line.
The reason is that the previous two Chanel Up patterns took approximately 36 and 38 candles respectively from bottom to top. A 36 bar sequence gets completed tomorrow so by Wednesday the latest (if this fractal gets repeated again), the Channel Up should top. We are waiting for that top, or better yet Double Top, to sell again and target the 73.25 Support.
-------------------------------------------------------------------------------
** Please LIKE 👍, FOLLOW ✅, SHARE 🙌 and COMMENT ✍ if you enjoy this idea! Also share your ideas and charts in the comments section below! **
-------------------------------------------------------------------------------
💸💸💸💸💸💸
👇 👇 👇 👇 👇 👇
XAUUSD Closing below the 1D MA50. Major bearish break-out.Gold (XAUUSD) got rejected just below the 4H MA50 (blue trend-line) and is following the downtrend as presented on our previous analysis:
We are re-adjusting the Fibonacci levels as they make a much more accurate fit for the uptrend, but right now we are about to make a strong bearish break-out as the price is attempting to close a 1D candle below the 1D MA50 for the first time since November 03 2022, which was practically the bottom of the previous multi-month downtrend.
A new Channel Down has emerged, with three Lower Highs already, while the the 4H time-frame has completed a Death Cross (4H MA50 (blue) crossed below the 4H MA200 (orange)) for the first time since October 16 2022.
As you see, the Higher Lows and Higher Highs of the uptrend have so far formed the Lower Lows of the Channel Up. The next one is Support Zone 1 within 1827 - 1823.50 and its top is our first target. If it breaks, we will extend selling towards Support Zone 2 but will target the 1D MA200 (yellow trend-line) a little higher.
We will shift back to buying only if the price breaks above the 4H MA200.
-------------------------------------------------------------------------------
** Please LIKE 👍, FOLLOW ✅, SHARE 🙌 and COMMENT ✍ if you enjoy this idea! Also share your ideas and charts in the comments section below! **
-------------------------------------------------------------------------------
💸💸💸💸💸💸
👇 👇 👇 👇 👇 👇

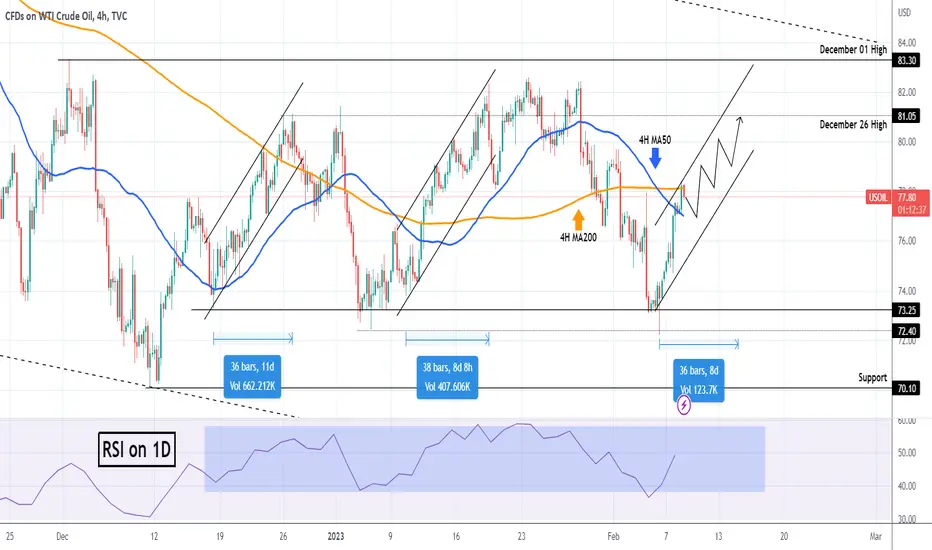
WTI OIL Recurring pattern turning it neutral mid-term?Our previous WTI Oil (USOIL) signal couldn't have gone any better as the bearish reversal was confirmed and we took the sell:
Following the rebound however after the (marginal) fake-out just below the 72.40 Support, we see the medium-term scene turning neutral. The reason is that since December 12, so effectively in the past 2 months, WTI hasn't closed below the 72.40 Support or above the 83.30 Resistance. And on top of that, the current rise looks quite similar to the Channel Up patterns of December 16 - 27 and January 05 - 18.
As a result, a clear candle closing above the 4H MA200 (orange trend-line), while the 4H MA50 (blue trend-line) is supporting, is a buy signal targeting at least the 81.05 December 26 High. Also look how well the 1D RSI also fits into a range itself.
-------------------------------------------------------------------------------
** Please LIKE 👍, FOLLOW ✅, SHARE 🙌 and COMMENT ✍ if you enjoy this idea! Also share your ideas and charts in the comments section below! **
-------------------------------------------------------------------------------
💸💸💸💸💸💸
👇 👇 👇 👇 👇 👇
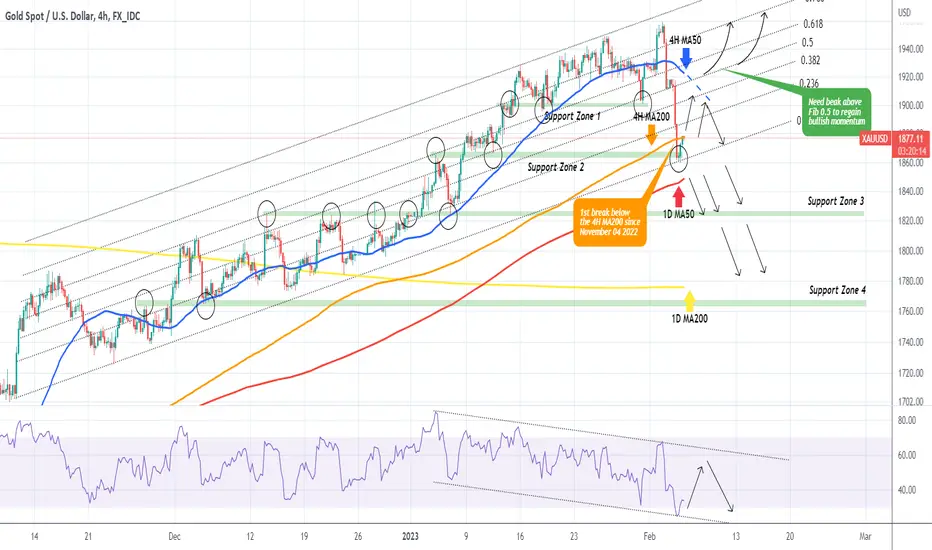
XAUUSD Broke below the 4H MA200 after 3 months! What's next?Gold (XAUUSD) has its strongest 1D losses (-2.45%) in 7 months (since July 05 2022/ -2.47%) and managed to break below its 4H MA200 (orange trend-line) for the first time in 3 months (since November 04 2022). Obviously this is a major technical development as the 1D RSI Bearish Divergence that was building up in January, eventually materialized the loss of strength into loss of price.
The long-term bullish trend hasn't been broken yet but is loosely supported after the 4H MA200 break on the Channel Up that started on November 10. Practically the 1D MA50 (red trend-line) just below is the true test of the uptrend. The 4H MA200 is now a Resistance but with the 4H RSI getting oversold and rebounding, it is likely to see a bullish market reaction (the last if this is the start of a downtrend) towards the 4H MA50 (blue trend-line) as the current price is the lowest in a month.
A rejection on the 4H MA50 practically empowers the trend reversal but the true confirmation would be closing a day below the 1D MA50. The role of the Support Zones we display is crucial as they were both Resistance and Support levels previously. As you see currently the price is support on Zone 2. As a result we are willing to sell only below the 1D MA50 and target Support Zone 3. Below that we will target the 1D MA200 (yellow trend-line).
In order to resume buying, we need to see the price break above the 0.5 Fibonacci retracement level again, which is both a bullish break-out point and rebound point inside the Channel Up.
-------------------------------------------------------------------------------
** Please LIKE 👍, FOLLOW ✅, SHARE 🙌 and COMMENT ✍ if you enjoy this idea! Also share your ideas and charts in the comments section below! **
-------------------------------------------------------------------------------
💸💸💸💸💸💸
👇 👇 👇 👇 👇 👇
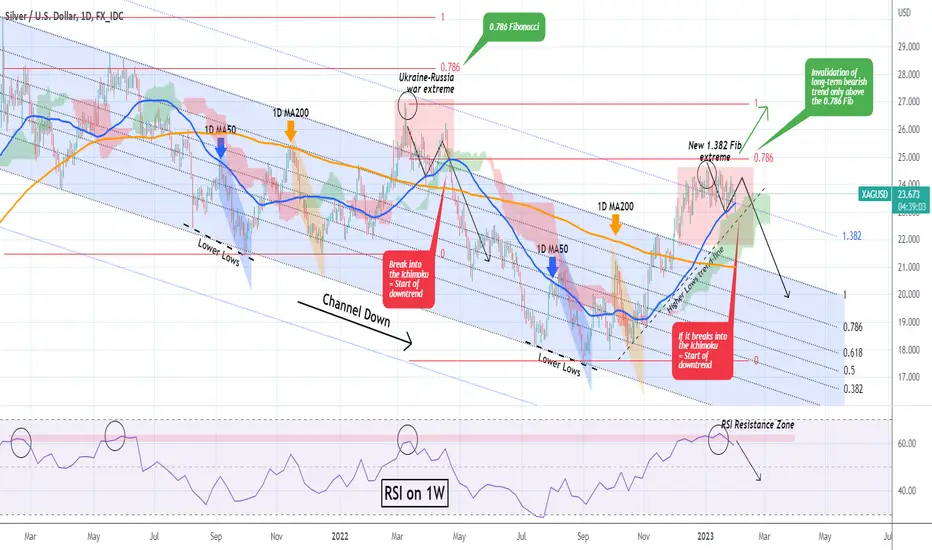
XAGUSD Hanging on a tight thread about to turn bearish.Silver (XAGUSD) couldn't have gone better since our September 12 buy signal as following the Lower Lows Double Bottom, it not only broke above the 1D MA50 (blue trend-line) and 1D MA200 ( orange trend-line), but also made a new Extreme High on the 1.382 Fibonacci extension .
As you see, we've charted Silver's pattern since February 01 2021, which is a Channel Down, most effectively viewed using the Fibonacci channel levels. This is basically the pattern we used to analyze the metal 3 months ago, and it helped us call accurately that bullish break-out.
At the moment, with a slight modification to better adapt to the new Highs and Lows, we see that Silver is has been pushing downwards on the 1.382 Fib treating it as strong of a Resistance so far as the March 08 High during the Ukraine - Russia war. Now of course the fundamentals are not the same but technically since the price broke below the 1D MA50, the confirmation of the downtrend will come if it breaks inside the Ichimoku Cloud, which is exactly where today's low hit. That was the Bearish Signal on the April 19 2022 Ichimoku breach.
If that happens, we can see a nose-dive even as low as the 0.382 Channel Fib. Notice also how the RSI on the 1W time-frame is being rejected on the Resistance Zone which since February 2021 was rejected and formed all major Lower Highs of this Channel Down.
In order for us to call for a bullish extension and invalidation of this long-term bearish trend, we ideally want to see XAGUSD closing above the 0.786 horizontal Fib, which failed to get tested during the March was High. In that case we will target initially the 26.900 March High on the short-term.
-------------------------------------------------------------------------------
** Please LIKE 👍, FOLLOW ✅, SHARE 🙌 and COMMENT ✍ if you enjoy this idea! Also share your ideas and charts in the comments section below! **
-------------------------------------------------------------------------------
💸💸💸💸💸💸
👇 👇 👇 👇 👇 👇
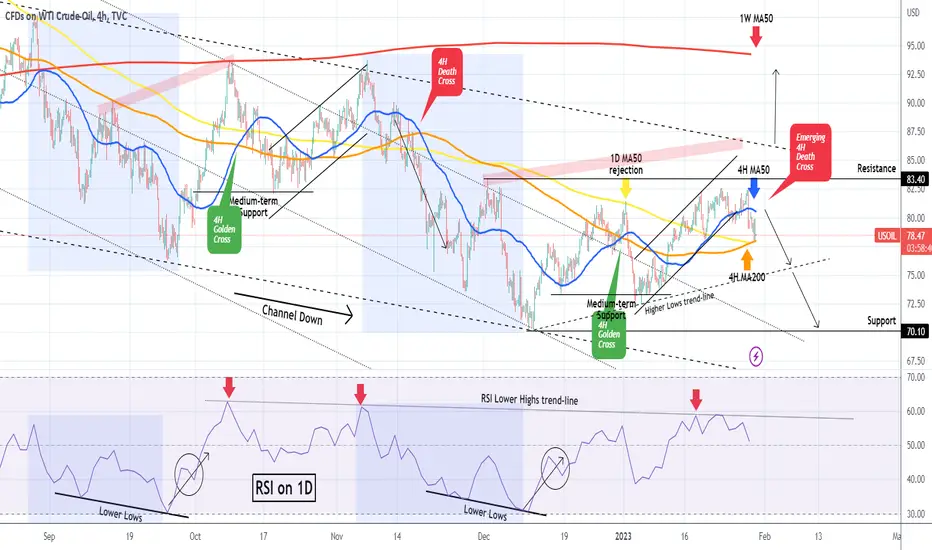
WTI OIL Bearish reversal confirmedWTI Oil (USOIL) is so far following the trading plan we presented 11 days ago, rising first towards the 83.40 Resistance and as it failed to break above it, it instead broke the short-term Channel Up downwards:
This basically confirms the bearish reversal of January's rally, with the price breaking below the 4H MA50 (blue trend-line) but at the moment finding Support on both the 4H MA200 (orange trend-line) and 1D MA50 (yellow trend-line). A new rejection on the 4H MA50 and closing below the 4H MA200/ 1D MA50 cluster, will be a sell signal for us, targeting first the Higher Lows (dashed) trend-line and the 70.10 in extension on the longer term.
Check also how the 1D RSI got rejected emphatically on its own Lower Highs trend-line.
-------------------------------------------------------------------------------
** Please LIKE 👍, FOLLOW ✅, SHARE 🙌 and COMMENT ✍ if you enjoy this idea! Also share your ideas and charts in the comments section below! **
-------------------------------------------------------------------------------
💸💸💸💸💸💸
👇 👇 👇 👇 👇 👇
XAUUSD 1H Death Cross and the break-out levelsGold (XAUUSD) is close to forming a strong bearish pattern on the 1H time-frame, the Death Cross, which is when the 1H MA50 (blue trend-line) crosses below the 1H MA200 (orange trend-line). Last time it formed this was a month ago (December 26).
This is the first bearish signal on Gold in a long time and we are going to approach this by candle closings and Resistance/ Support levels. In the past 7 days, all 1H candles have closed above the 1919.50 Support (1) so we will go short upon a closing below it and target the Higher Lows trend-line (1) and the 4H MA100 (red trend-line). We are willing to extend this selling only if we close a candle below the 1911 Support (2) and target Support 3 (1895.50), where contact will most likely be made with 4H MA200 (yellow trend-line), which is the long-term Support during such uptrends.
Similarly, a break above the 1935 Resistance (1) will be a buy signal, targeting Resistance 2 (1949.50).
-------------------------------------------------------------------------------
** Please LIKE 👍, FOLLOW ✅, SHARE 🙌 and COMMENT ✍ if you enjoy this idea! Also share your ideas and charts in the comments section below! **
-------------------------------------------------------------------------------
💸💸💸💸💸💸
👇 👇 👇 👇 👇 👇

Cotton prices on the stepping stone?As described here - I see the signs are right for a bullish move in cotton.

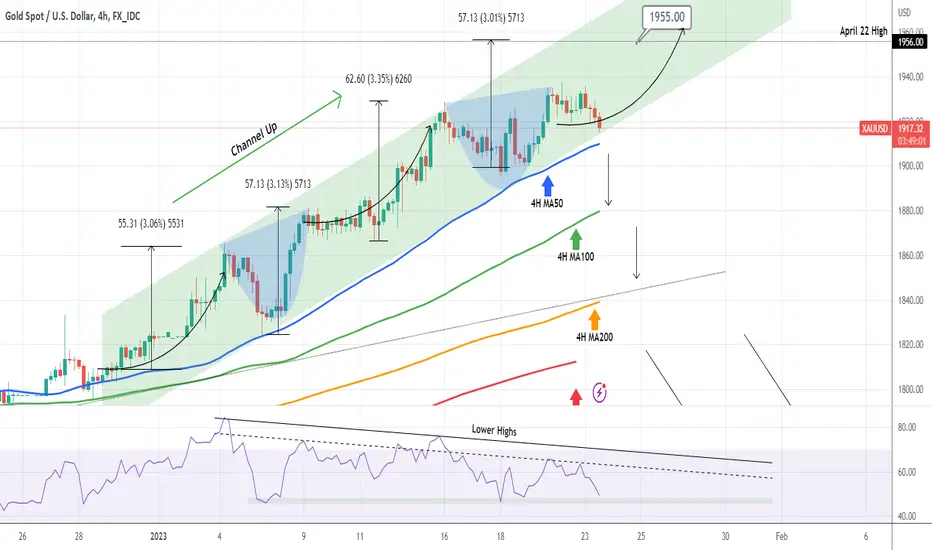
XAUUSD Channel Up at the limitGold (XAUUSD) is now at the bottom (Higher Lows trend-line) of the 1-month Channel Up. It has been closing above the 4H MA50 (blue trend-line) since December 28, above the 4H MA100 (green trend-line) since December 15 and above the 4H MA200 (orange trend-line) since November 04! Needless to say, a closing below each MA would target the one below it.
As long as the Channel Up and 4H MA50 hold, we see a recurring +3.00% rise, three straight times, which at the moment targets 1955, where the April 22 2022 High was formed. The 4H RSI being on its Support Zone, is also a buy signal for as long as it holds and a sell if it breaks.
-------------------------------------------------------------------------------
** Please LIKE 👍, FOLLOW ✅, SHARE 🙌 and COMMENT ✍ if you enjoy this idea! Also share your ideas and charts in the comments section below! **
-------------------------------------------------------------------------------
💸💸💸💸💸💸
👇 👇 👇 👇 👇 👇
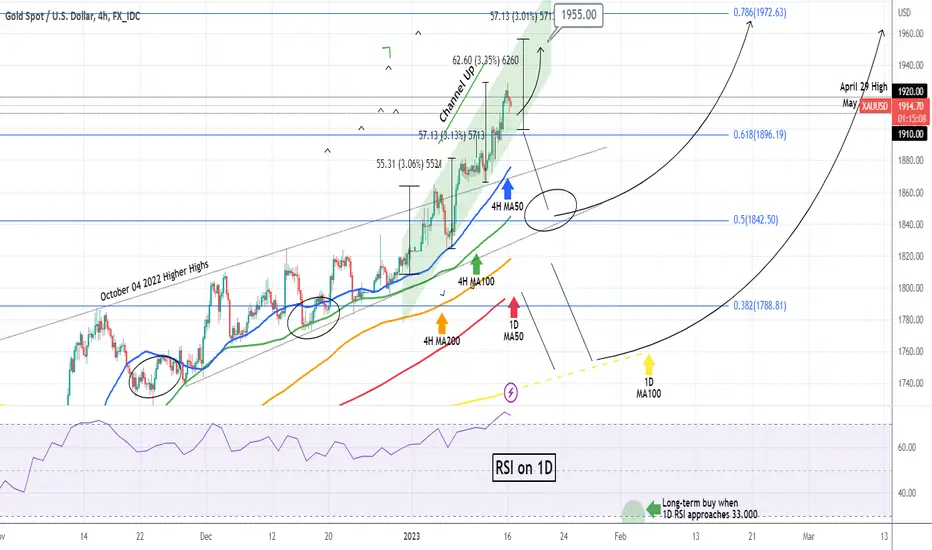
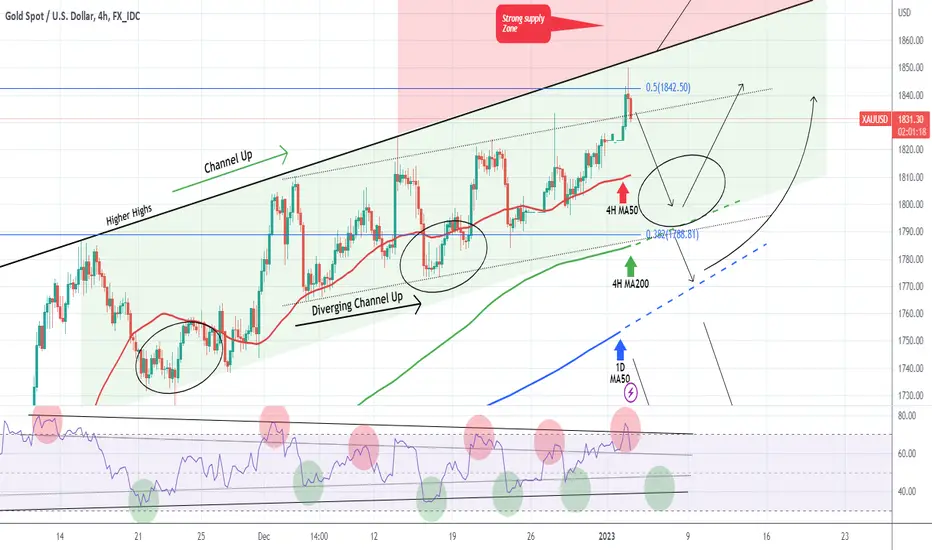
XAUUSD This level separates buying from sellingGold (XAUUSD) is overextending its long-term bullish trend which we first called on our early November idea:
The overextension is being done within a Channel Up (green) pattern after the broke above the October 04 2022 Higher Highs and after the 1D RSI turned overbought above the 70.000 barrier on January 12. As long as the Channel Up holds, the price should aim at a new +3.00% (at least) Higher High extension, translated into a 1955 target.
A closing below the Channel Up though, should target the last known bounce level of January 05, the 4H MA50 (blue trend-line) and then the 4H MA100 (green trend-line), which last made contact with on December 23. However given the fact that overextensions typically burst more emphatically, they test lower support levels. As a result, in our opinion, the next Support level will most likely be the zone within the 4H MA200 (orange trend-line) and 1D MA50 (red trend-line).
A daily close below the 1D MA50 opens the way for the 1D MA200 (yellow trend-line), which is the strongest long-term buy level, but less likely to get tested. Another long-term buy indicator to look out for is when the 1D RSI approaches the 30.000 oversold barrier.
In both cases, the long term target is the 0.786 Fibonacci retracement level at 1972.
-------------------------------------------------------------------------------
** Please LIKE 👍, FOLLOW ✅, SHARE 🙌 and COMMENT ✍ if you enjoy this idea! Also share your ideas and charts in the comments section below! **
-------------------------------------------------------------------------------
💸💸💸💸💸💸
👇 👇 👇 👇 👇 👇
WTI OIL 4H Death Cross. Trade the break-outs.WTI Oil (USOIL) formed yesterday a Death Cross on the 4H time-frame, the first such (bearish) formation in almost 2 months (since November 17 2022). The price got rejected exactly on both the 4H MA50 (blue trend-line) and 4H MA200 (orange trend-line) following last week's rejection (January 03) on the 1D MA50 (yellow trend-line). We covered this on our last week analysis:
The only pattern that is in favor of Oil rising is the Channel Up of October 18 to November 07, which held the Medium-term Support. A similar Channel Up can re-test the 1D MA50 but as always on risky set-ups, it is best to trade the break-out. That is the 76.70 Resistance, between the 4H MA200 and 4H MA50.
On the downside, a break below the 72.50 Support, targets a Lower Low on the long-term Channel Down (dashed) close to 68.00.
As before, keep an eye on the 1D RSI, which has a clear Lower Highs trend-line that offers solid sell entries.
-------------------------------------------------------------------------------
** Please LIKE 👍, FOLLOW ✅, SHARE 🙌 and COMMENT ✍ if you enjoy this idea! Also share your ideas and charts in the comments section below! **
-------------------------------------------------------------------------------
💸💸💸💸💸💸
👇 👇 👇 👇 👇 👇
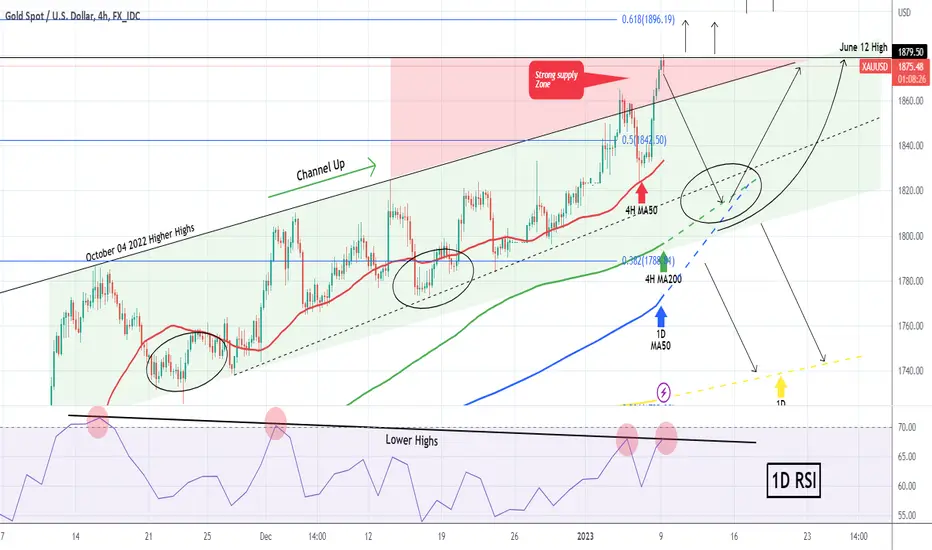
XAUUSD Hit the June 2022 High. Potential pull-back.Gold (XAUUSD) hit the 1880 Resistance, which was formed on the June 12 2022 High. As we mentioned in previous analysis the region within the October 04 Higher Highs and the 1880 June High is a strong Supply Zone and as you saw it already gave a short-term rejection.
If it fails to close a 1D candle above it, we are more likely to see a pull-back first towards the 4H MA50 (red trend-line) and then the 4H MA200 (green trend-line) and eventually the 1D MA50 (blue trend-line), which has been intact for 2 months (since November 08 2022). The 1D RSI also hit its Lower Highs trend-line that started on the November 15 High, indicating that we are on a major medium-term Resistance.
On the other hand, if Gold closes above the 1880 Resistance, expect a quick test of the 0.618 long-term Fibonacci at 1896 followed by the 1910 and 1920 May 05 and April 29 Highs respectively.
-------------------------------------------------------------------------------
** Please LIKE 👍, FOLLOW ✅, SHARE 🙌 and COMMENT ✍ if you enjoy this idea! Also share your ideas and charts in the comments section below! This is best way to keep it relevant, support me, keep the content here free and allow the idea to reach as many people as possible. **
-------------------------------------------------------------------------------
You may also TELL ME 🙋♀️🙋♂️ in the comments section which symbol you want me to analyze next and on which time-frame. The one with the most posts will be published tomorrow! 👏🎁
-------------------------------------------------------------------------------
💸💸💸💸💸💸
👇 👇 👇 👇 👇 👇
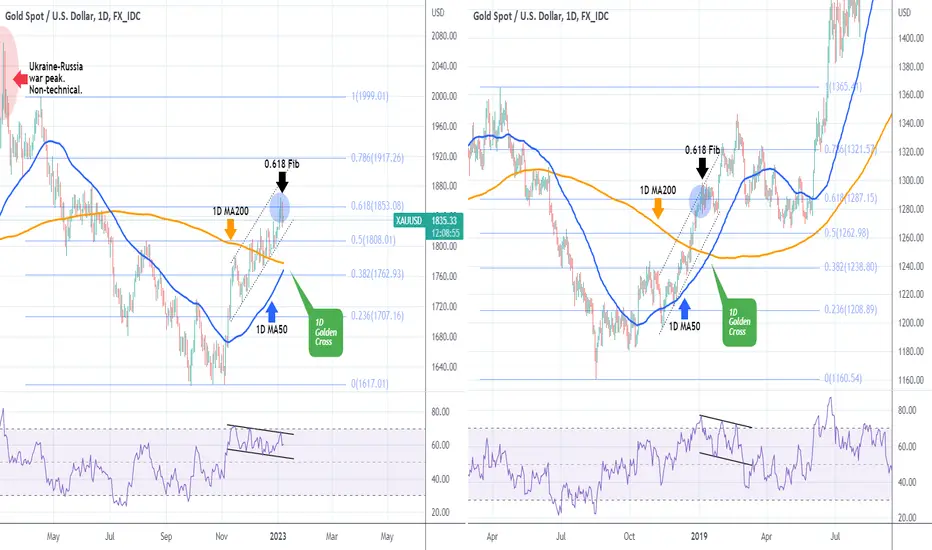
XAUUSD 1D RSI Bearish Divergence before the Golden Cross.Gold (XAUUSD) is about to form a Golden Cross on the 1D time-frame (around next week), which is the bullish pattern when the 1D MA50 (blue trend-line) crosses above the 1D MA200 (orange trend-line). The price has been trading within a Channel Up pattern, while at the same time the 1D RSI has been within a Channel Down. This is a technical Bearish Divergence.
A similar price action was last spotted around the January 15 2019 Golden Cross. Gold was again recovering within a Channel Up on an RSI Bearish Divergence, with the price having breached the 0.618 Fibonacci retracement level just before the Golden Cross. After a short 3-week pull-back, Gold resumed the uptrend even above the 0.786 Fib, and a little before completing the full reversal. Then it made a 2-month correction below the 1D MA50 and towards the 1D MA200.
This time however, the price hasn't made contact with the 1D MA50 at all in 2 months (since November 07 2022). If the USD and the US10Y search for their own 1D MA50, it is possible to see the price test 1D MA50 before rising further. In any case, keep dry powder for that, but the long-term trend remains bullish, which is something we projected would happen on our November 07 2022 analysis, after spotting the Triple Bottom on the RSI Higher Lows:
-------------------------------------------------------------------------------
** Please LIKE 👍, FOLLOW ✅, SHARE 🙌 and COMMENT ✍ if you enjoy this idea! Also share your ideas and charts in the comments section below! This is best way to keep it relevant, support me, keep the content here free and allow the idea to reach as many people as possible. **
-------------------------------------------------------------------------------
You may also TELL ME 🙋♀️🙋♂️ in the comments section which symbol you want me to analyze next and on which time-frame. The one with the most posts will be published tomorrow! 👏🎁
-------------------------------------------------------------------------------
💸💸💸💸💸💸
👇 👇 👇 👇 👇 👇
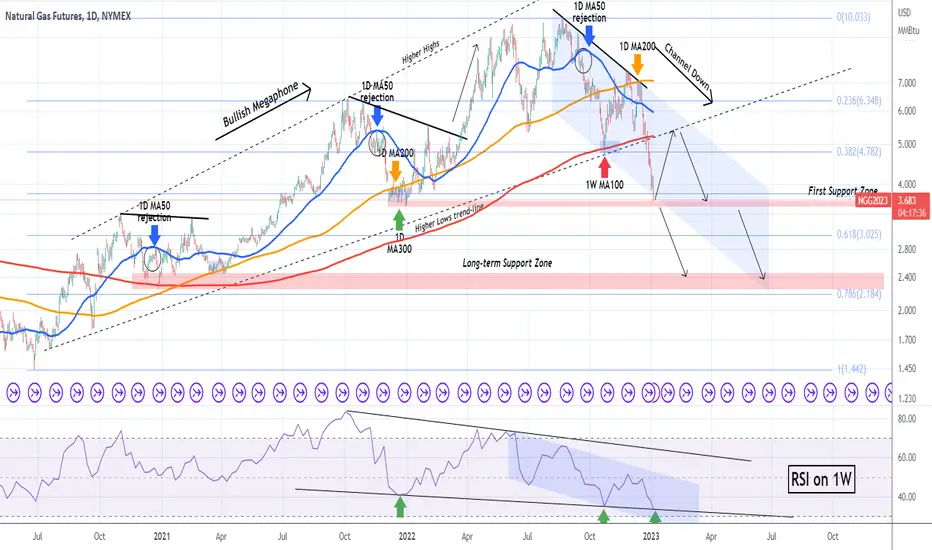
NATURAL GAS Potential rebound but bearish long-term.Last time we gave a signal on Natural Gas (NG1!) in late November, we caught a perfect rejection and sell entry for a strong bearish December trend:
As you see, the price even closed below the 1W MA100 (red trend-line), breaking its previous 1 year Bullish Megaphone pattern, so the trend is confirmed as bearish long-term. By doing so, it has formed a Channel Down whose bottom (Lower Lows trend-line) was hit and the price bounced yesterday. Today though it resumed the downtrend.
We believe the key here is the RSI on the 1W time-frame and the Falling Wedge pattern we identified last time. This is now on its bottom as it was on October 21 2022 Low, which caused the short-term rebound to a Lower High for the Channel Down.
As long as it holds, we expect the price to rebound on the short-term in order to test the 1W MA100 and 1D MA50 (blue trend-line). A rejection there should extend the Channel Down to a new Lower Low. A break of the Channel Down downwards earlier, will simply accelerate the downtrend to the 0.618 Fibonacci and the long-term Support Zone just above the 0.786 Fib. Notice that right now the price is on the 0.5 Fibonacci.
-------------------------------------------------------------------------------
** Please LIKE 👍, FOLLOW ✅, SHARE 🙌 and COMMENT ✍ if you enjoy this idea! Also share your ideas and charts in the comments section below! This is best way to keep it relevant, support me, keep the content here free and allow the idea to reach as many people as possible. **
-------------------------------------------------------------------------------
You may also TELL ME 🙋♀️🙋♂️ in the comments section which symbol you want me to analyze next and on which time-frame. The one with the most posts will be published tomorrow! 👏🎁
-------------------------------------------------------------------------------
💸💸💸💸💸💸
👇 👇 👇 👇 👇 👇
WTI OIL 4H MA50 holding as Support. Levels to buy and sell.The WTI Oil (USOIL) is having so far a full-action day as it hit the 1D MA50 (yellow trend-line) for the first time since November 16 and got rejected and tested once again the 4H MA50 (blue trend-line) which has been holding as a Support since December 14.
This is basically the same time when the short-term Channel Up emerged and as you see so far has two clear Higher Highs and Higher Lows. We had forecasted this 1D MA50 test almost a month ago based on the 1D RSI Lower Lows fractal similarities with September:
This long-term Target is now done and we can only enter a new buy either after a candle close above the 1D MA50 or now with a tight SL at the bottom of the Channel Up. In both cases the target is 83.90, a new Higher High.
The 4H Golden Cross pattern (MA50 crossing above 4H MA200 (orange trend-line)), hasn't always been bullish though as on October 11 it signaled the top. Ideally that should be on the 1D RSI Lower Highs trend-line, but if the price closes below the 4H MA200, it would be a late sell signal, aiming at the 73.35 Support. Tight SL on both buys and sells, and this approach should work in your favor on the medium-term.
-------------------------------------------------------------------------------
** Please LIKE 👍, FOLLOW ✅, SHARE 🙌 and COMMENT ✍ if you enjoy this idea! Also share your ideas and charts in the comments section below! This is best way to keep it relevant, support me, keep the content here free and allow the idea to reach as many people as possible. **
-------------------------------------------------------------------------------
You may also TELL ME 🙋♀️🙋♂️ in the comments section which symbol you want me to analyze next and on which time-frame. The one with the most posts will be published tomorrow! 👏🎁
-------------------------------------------------------------------------------
💸💸💸💸💸💸
👇 👇 👇 👇 👇 👇

XAUUSD Pull-back expected. See where you can buy.Gold (XAUUSD) gave us another excellent buy entry on our most recent analysis last week (December 28) as we caught the exact low entry on the 4H MA50 (red tredn-line) and hit our 1830 target:
The price made a Higher High at the top of the Channel Up (green) that started after the November 15 High, exactly at 1850. The Double Sell signal was triggered not just because of this Higher High but also because the 4H RSI hit (even broke) its 2 month Lower Highs Resistance. This turns into a buy once the RSI enters the low dotted Higher Lows trend-line.
In price terms this should be within the 4H MA50 and 4H MA200 (green trend-line) and with a new buy positions we will target the 1850 - 1860 zone. A closing below the 4H MA200 should put to test the 1D MA50 (blue trend-line), which is the long-term Support for Gold on this 2-month uptrend.
-------------------------------------------------------------------------------
** Please LIKE 👍, FOLLOW ✅, SHARE 🙌 and COMMENT ✍ if you enjoy this idea! Also share your ideas and charts in the comments section below! This is best way to keep it relevant, support me, keep the content here free and allow the idea to reach as many people as possible. **
-------------------------------------------------------------------------------
You may also TELL ME 🙋♀️🙋♂️ in the comments section which symbol you want me to analyze next and on which time-frame. The one with the most posts will be published tomorrow! 👏🎁
-------------------------------------------------------------------------------
💸💸💸💸💸💸
👇 👇 👇 👇 👇 👇
WTI OIL Struggling on the 1D MA50.It has been almost 20 days since our buy signal on WTI Oil (USOIL) after it hit the bottom of the (diverging) Channel Down (dashed lines):
As you see, the price hit our target on the top (Lower Highs trend-line) of the previous Channel Down, but yesterday failed to break the 1D MA50 (blue trend-line) and gor rejected downwards. If it breaks and closes above the 1D MA50 (which happens to be around the 0.5 Fibonacci), we expect one last extension to the 0.618 Fib (84.80) and max the 0.786 Fib (88.80) and test the top (Lower Highs trend-line) of the Diverging Channel Down.
If however the price breaks and closes below the 4H MA50 (yellow trend-line), we will turn bearish instead, targeting the 73.30 Support and potentially (we will update the conditions with a new analysis) the bottom (Lower Lows trend-line) of the Channel Down.
As you may remember, the basis for our buy signal early in December was the similarities with the September sell-off fractal. See how on the 1D RSI the indicator got rejected exactly on the level where on October 04 the price hit the 1D MA50. Unlike yesterday and today, the price broke above it on Oct 05 as a result giving as a significant divergence from our model.
-------------------------------------------------------------------------------
** Please LIKE 👍, SUBSCRIBE ✅, SHARE 🙌 and COMMENT ✍ if you enjoy this idea! Also share your ideas and charts in the comments section below! This is best way to keep it relevant, support me, keep the content here free and allow the idea to reach as many people as possible. **
-------------------------------------------------------------------------------
You may also TELL ME 🙋♀️🙋♂️ in the comments section which symbol you want me to analyze next and on which time-frame. The one with the most posts will be published tomorrow! 👏🎁
-------------------------------------------------------------------------------
💸💸💸💸💸💸
👇 👇 👇 👇 👇 👇
